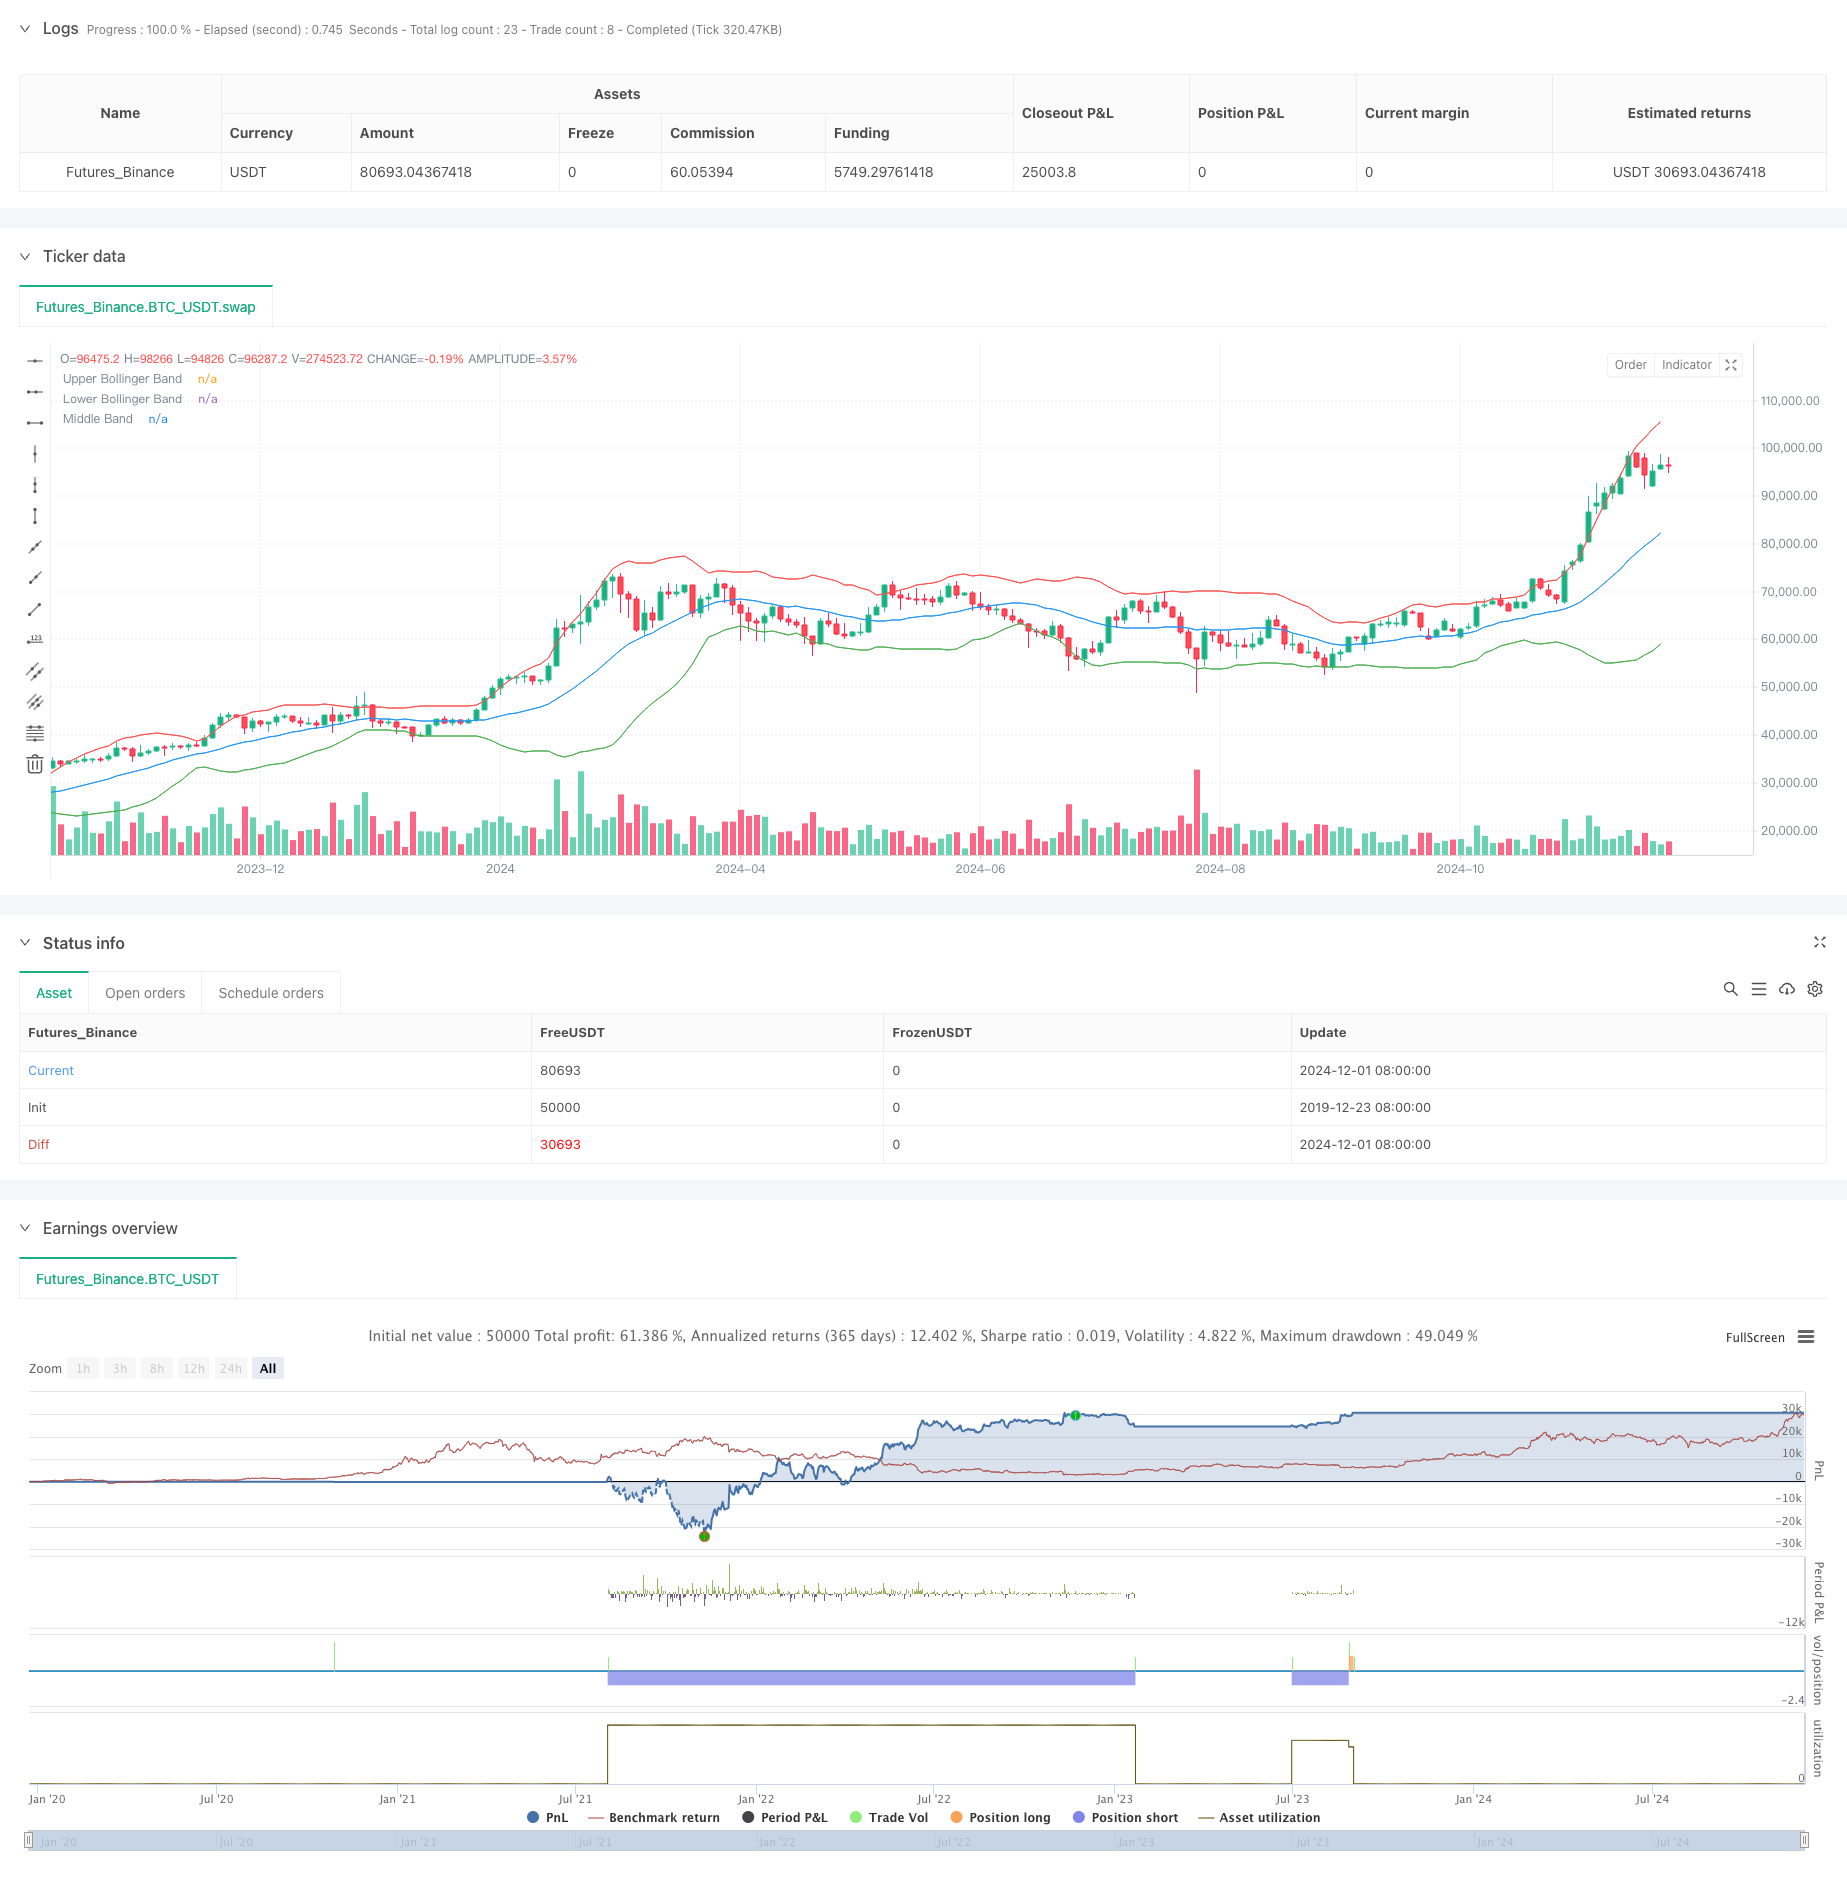
Visão geral
A estratégia é um sistema de negociação de alta frequência que combina indicadores de bandas de Brin com brechas de preços. A estratégia controla a relação entre a posição dos preços e as bandas de Brin, combinando sinais de brechas de altos e baixos prévios, para realizar a reversão de negociação quando o mercado está sobrecomprado. O sistema usa um risco de ganho de risco de 1: 1 para definir um stop loss e mostra os preços-chave de forma visível, ajudando os comerciantes a entender intuitivamente o movimento do mercado.
Princípio da estratégia
A lógica central da estratégia baseia-se em duas principais condições de julgamento: quando o preço quebra o ponto alto anterior e o ponto alto anterior está abaixo da trajetória abaixo da faixa de Brin, o sinal de multiplicação é acionado; quando o preço cai o ponto baixo anterior e o ponto baixo anterior está acima da trajetória acima da faixa de Brin, o sinal de vazio é acionado. Os parâmetros da faixa de Brin usam uma média móvel de 20 períodos com 2 vezes a diferença padrão para julgar a amplitude de oscilação do mercado e o sistema de zonas de venda e compra excessivas. Após o sinal de negociação ser acionado, o ponto de parada e o ponto de destino correspondentes são automaticamente configurados e visualizados através de linhas de diferentes estilos.
Vantagens estratégicas
- A combinação de dois tipos de negociação, o de ruptura de tendência e o de retorno ao valor médio, permite manter a estabilidade em diferentes cenários de mercado
- Administração de posições com uma relação de risco/benefício fixa, que favorece a estabilidade dos lucros a longo prazo
- A operabilidade da estratégia é melhorada através da visualização de entradas, paradas e pontos de destino
- O uso de indicadores de correia de Brin ajuda a identificar o excesso de compra e venda no mercado, aumentando a precisão das transações
- A lógica da estratégia é simples e clara, fácil de entender e executar
Risco estratégico
- As transações de alta frequência podem ter custos de transação mais elevados e os custos de comissões devem ser considerados.
- Falso sinal de ruptura pode ocorrer com frequência em mercados com oscilação horizontal
- A correlação de risco/benefício fixo pode não ser adequada para captar as grandes tendências
- A fixação dos parâmetros das faixas de Bryn pode não ser adequada a todas as circunstâncias do mercado
- Necessidade de monitoramento de mercado em tempo real para garantir a execução de sinais em tempo real
Direção de otimização da estratégia
- Introdução de indicadores de volume de transação como sinais de confirmação para aumentar a confiabilidade da brecha
- Parâmetros da faixa de Bryn ajustados à dinâmica da taxa de flutuação do mercado
- Aumentar os filtros de tendência para evitar a frequência de transações no mercado horizontal
- Considere adicionar um filtro de tempo para evitar transações durante períodos de inatividade
- Desenvolver mecanismos de ajustamento de risco-benefício
Resumir
Trata-se de um sistema de negociação completo que integra vários conceitos de análise técnica. Através da combinação de indicadores de correia de Brin e de breakouts de preços, a estratégia é capaz de capturar oportunidades de reversão em áreas de sobrevenda e sobrevenda no mercado. Embora haja algum espaço para otimização, a estrutura básica do sistema possui boa escalabilidade e valor prático.
/*backtest
start: 2019-12-23 08:00:00
end: 2024-12-03 00:00:00
period: 2d
basePeriod: 2d
exchanges: [{"eid":"Futures_Binance","currency":"BTC_USDT"}]
*/

//@version=5
strategy("Bollinger Band Scalping", overlay=true)

// Input for Bollinger Bands length and standard deviation
bbLength = input(20, title="Bollinger Bands Length")
stdDev = input(2.0, title="Bollinger Bands Std Dev")

// Calculate and plot the Bollinger Bands
basis = ta.sma(close, bbLength)
deviation = stdDev * ta.stdev(close, bbLength)
upperBB = basis + deviation
lowerBB = basis - deviation

// Get previous candle's values
prevHigh = high[1]   // Previous candle high
prevLow = low[1]     // Previous candle low

// Buy Signal Condition: Current high crossed above previous high and previous high is below the lower Bollinger Band
buyCondition = ta.crossover(high, prevHigh) and (prevHigh < lowerBB[1])

// Sell Signal Condition: Current low crossed below previous low and previous low is above the upper Bollinger Band
sellCondition = ta.crossunder(low, prevLow) and (prevLow > upperBB[1])

// Entry and exit for Buy signals
if (buyCondition)
    strategy.entry("Buy", strategy.long)
    // Calculate target and stop loss
    stopLossPrice = prevLow
    targetPrice = prevHigh + (prevHigh - stopLossPrice)  // 1:1 RR target

    // Set stop loss and target orders
    strategy.exit("Sell", "Buy", limit=targetPrice, stop=stopLossPrice)

    // // Plot entry line
    // line.new(x1=bar_index, y1=prevHigh, x2=bar_index + 12, y2=prevHigh, color=color.green, width=2, style=line.style_solid)
    // // Plot stop loss line
    // line.new(x1=bar_index, y1=stopLossPrice, x2=bar_index + 12, y2=stopLossPrice, color=color.red, width=1, style=line.style_dashed)
    // // Plot target line
    // line.new(x1=bar_index, y1=targetPrice, x2=bar_index + 12, y2=targetPrice, color=color.blue, width=2, style=line.style_solid)

// Entry and exit for Sell signals
if (sellCondition)
    strategy.entry("Sell", strategy.short)
    // Calculate target and stop loss
    stopLossPriceSell = prevHigh
    targetPriceSell = prevLow - (stopLossPriceSell - prevLow)  // 1:1 RR target

    // Set stop loss and target orders
    strategy.exit("Cover", "Sell", limit=targetPriceSell, stop=stopLossPriceSell)

    // // Plot entry line
    // line.new(x1=bar_index, y1=prevLow, x2=bar_index + 12, y2=prevLow, color=color.red, width=2, style=line.style_solid)
    // // Plot stop loss line
    // line.new(x1=bar_index, y1=stopLossPriceSell, x2=bar_index + 12, y2=stopLossPriceSell, color=color.green, width=1, style=line.style_dashed)
    // // Plot target line
    // line.new(x1=bar_index, y1=targetPriceSell, x2=bar_index + 12, y2=targetPriceSell, color=color.blue, width=2, style=line.style_solid)

// Plotting Bollinger Bands with 70% transparency
plot(upperBB, color=color.red, title="Upper Bollinger Band", transp=70)
plot(lowerBB, color=color.green, title="Lower Bollinger Band", transp=70)
plot(basis, color=color.blue, title="Middle Band", transp=70)