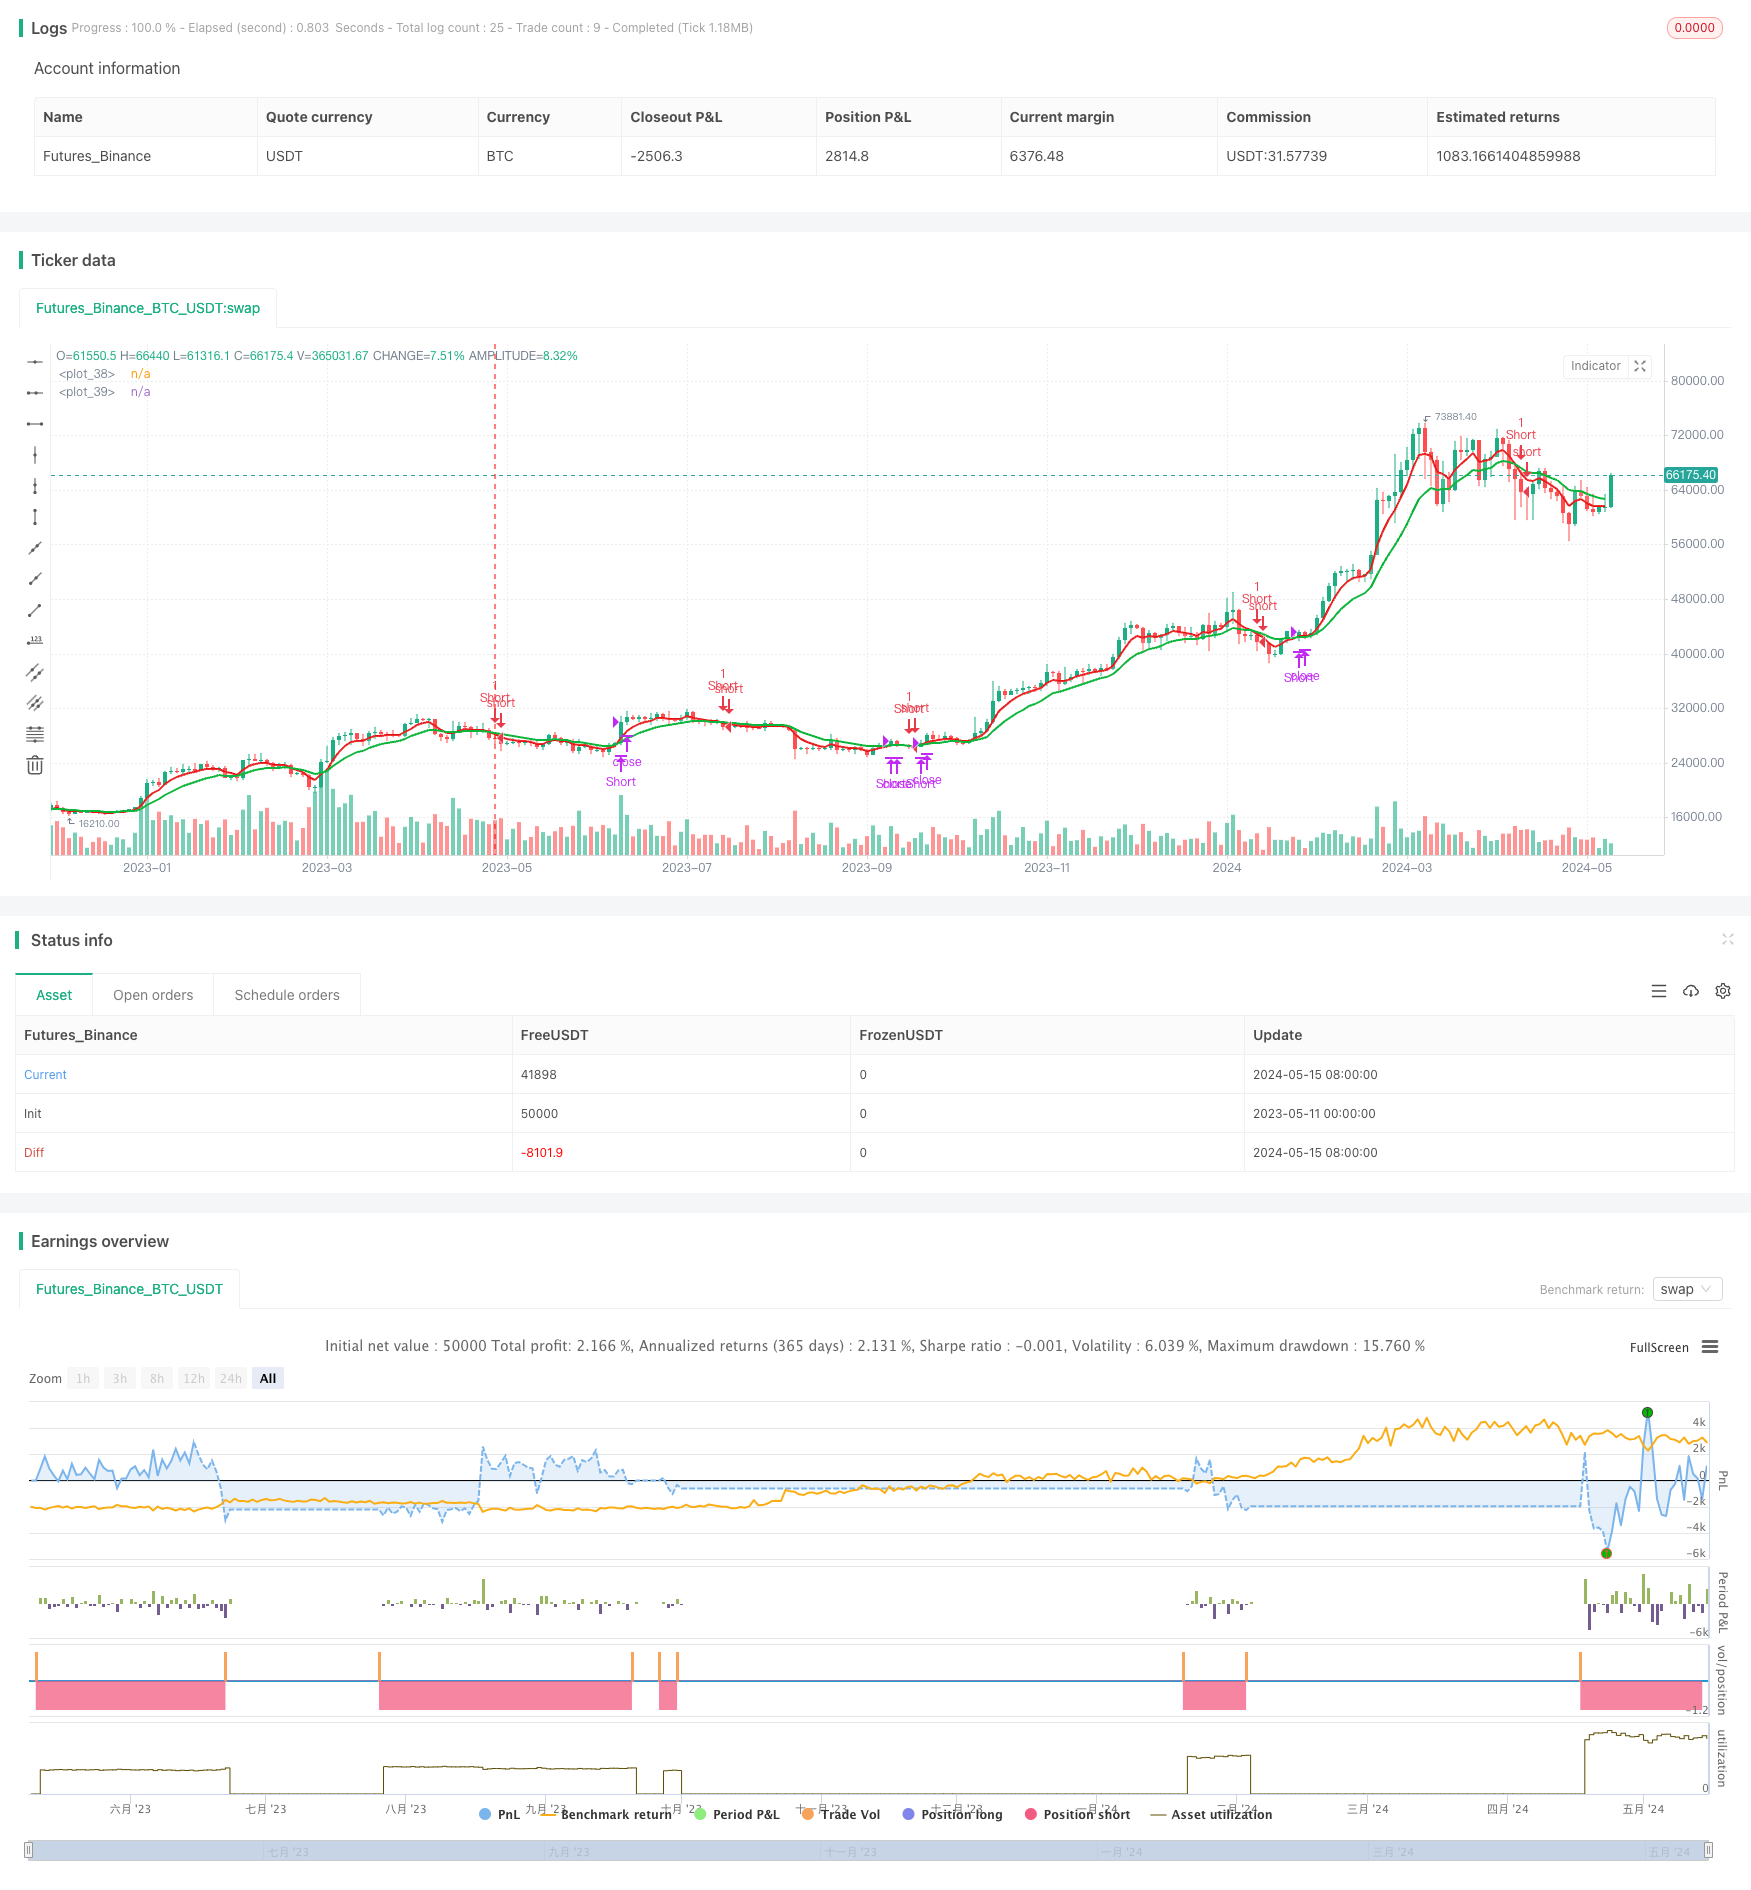
Tổng quan
Chiến lược này sử dụng sự giao thoa của đường trung bình di chuyển chỉ số 5 ngày (EMA5) và đường trung bình di chuyển chỉ số 13 ngày (EMA13) để tạo ra tín hiệu giao dịch. Khi EMA5 đi trên EMA13, nó tạo ra tín hiệu nhiều; khi EMA5 đi dưới EMA13, nó tạo ra tín hiệu trống. Chiến lược này được thiết kế để nắm bắt sự thay đổi trong xu hướng ngắn hạn và sử dụng sự giao thoa của hai đường trung bình di chuyển để xác định điểm vào và điểm ra.
Nguyên tắc chiến lược
Cốt lõi của chiến lược này là sử dụng chéo của chỉ số chuyển động trung bình (EMA) của hai chu kỳ khác nhau để tạo ra tín hiệu giao dịch. EMA là một chỉ số kỹ thuật được sử dụng thường xuyên, nó đặt trọng lượng cao hơn cho dữ liệu giá gần đây nhất, do đó phản ánh sự thay đổi giá một cách kịp thời hơn so với trung bình di chuyển đơn giản (SMA).
Lợi thế chiến lược
- Đơn giản và dễ hiểu: Chiến lược chỉ sử dụng hai chỉ số EMA, nguyên tắc đơn giản, dễ hiểu và thực hiện.
- Khả năng thích ứng: Bằng cách điều chỉnh các tham số chu kỳ của EMA, có thể thích ứng với các môi trường thị trường khác nhau và các loại giao dịch.
- Tính kịp thời cao: EMA phản ứng kịp thời hơn với sự thay đổi giá so với SMA, giúp nắm bắt nhanh chóng các thay đổi xu hướng.
- Khả năng mở rộng: Dựa trên chiến lược này, nó có thể được kết hợp với các chỉ số kỹ thuật hoặc các yếu tố cơ bản khác để tối ưu hóa hơn nữa hiệu suất của chiến lược.
Rủi ro chiến lược
- Tín hiệu giả: Khi thị trường bị chấn động hoặc xu hướng không rõ ràng, giao dịch EMA có thể tạo ra nhiều tín hiệu giả, dẫn đến giao dịch thường xuyên và mất tiền.
- Sự chậm trễ: Mặc dù EMA chậm trễ hơn SMA, nhưng vẫn có một số sự chậm trễ, có thể bỏ lỡ thời gian đầu vào tốt nhất.
- Thiếu dừng lỗ: Chiến lược này không có điều kiện dừng lỗ rõ ràng và có thể chịu tổn thất lớn nếu thị trường đảo ngược.
- Tối ưu hóa tham số: Lựa chọn tham số chu kỳ EMA cần được tối ưu hóa cho các thị trường và giống khác nhau, nếu không có thể ảnh hưởng đến hiệu suất chiến lược.
Hướng tối ưu hóa chiến lược
- Thêm lọc xu hướng: dựa trên tín hiệu chéo EMA, lọc xu hướng kết hợp với chỉ số xu hướng dài hạn (như EMA50) để giảm tín hiệu giả.
- Thiết lập dừng lỗ: Thiết lập dừng động dựa trên các chỉ số như ATR, hoặc sử dụng dừng phần trăm cố định để kiểm soát tổn thất tối đa cho một giao dịch.
- Các tham số tối ưu hóa: Tối ưu hóa các tham số chu kỳ EMA bằng cách kiểm tra lại dữ liệu lịch sử để tìm ra các tham số phù hợp nhất với thị trường và giống hiện tại.
- Kết hợp với các chỉ số khác: được sử dụng kết hợp với các chỉ số kỹ thuật khác (như RSI, MACD, v.v.) để cải thiện độ xác nhận và độ tin cậy của tín hiệu.
Tóm tắt
Chiến lược giao chéo EMA5 và EMA13 là một chiến lược theo dõi xu hướng đơn giản và dễ sử dụng để nắm bắt sự thay đổi của xu hướng giá bằng cách giao chéo hai chu kỳ EMA khác nhau. Ưu điểm của chiến lược này là đơn giản, thích ứng mạnh mẽ và kịp thời, nhưng đồng thời cũng có rủi ro như tín hiệu sai, chậm trễ và thiếu dừng. Để tối ưu hóa hơn nữa hiệu suất của chiến lược, bạn có thể xem xét thêm bộ lọc xu hướng, thiết lập dừng, tham số tối ưu hóa và kết hợp các phương pháp chỉ số kỹ thuật khác.
/*backtest
start: 2023-05-11 00:00:00
end: 2024-05-16 00:00:00
period: 2d
basePeriod: 1d
exchanges: [{"eid":"Futures_Binance","currency":"BTC_USDT"}]
*/

// This source code is subject to the terms of the Mozilla Public License 2.0 at https://mozilla.org/MPL/2.0/
// © Milankacha

//@version=5
strategy('5-13 EMA by Naimesh ver04', overlay=true)

qty = input(1, 'Buy quantity')

testStartYear = input(2021, 'Backtest Start Year')
testStartMonth = input(1, 'Backtest Start Month')
testStartDay = input(1, 'Backtest Start Day')
testStartHour = input(0, 'Backtest Start Hour')
testStartMin = input(0, 'Backtest Start Minute')
testPeriodStart = timestamp(testStartYear, testStartMonth, testStartDay, testStartHour, testStartMin)
testStopYear = input(2099, 'Backtest Stop Year')
testStopMonth = input(1, 'Backtest Stop Month')
testStopDay = input(30, 'Backtest Stop Day')
testPeriodStop = timestamp(testStopYear, testStopMonth, testStopDay, 0, 0)
testPeriodBackground = input(title='Color Background?', defval=true)
testPeriodBackgroundColor = testPeriodBackground and time >= testPeriodStart and time <= testPeriodStop ? #00FF00 : na
testPeriod() => true


ema1 = input(5, title='Select EMA 1')
ema2 = input(13, title='Select EMA 2')
//ema3 = input(50, title='Select EMA 3')
//SL = input(70, title='Stoploss')
//TR = input(250, title='Target')

expo = ta.ema(close, ema1)
ma = ta.ema(close, ema2)
//EMA_50 = ta.ema(close, ema3)

//avg_1 = avg (expo, ma)
//s2 = ta.cross(expo, ma) ? avg_1 : na
//plot(s2, style=plot.style_line, linewidth=3, color=color.red, transp=0)

p1 = plot(expo, color=color.rgb(231, 15, 15), linewidth=2)
p2 = plot(ma, color=#0db63a, linewidth=2)
fill(p1, p2, color=color.new(color.white, 80))

longCondition = ta.crossover(expo, ma)

shortCondition = ta.crossunder(expo, ma)


if testPeriod()
    //strategy.entry('Long', strategy.long, when=longCondition)
    strategy.entry('Short', strategy.short, when=expo<ma)

//strategy.close("Long", expo<ma, comment= 'SL hit')
strategy.close("Short", expo>ma, comment= 'SL hit')


//plotshape(longCondition and close>EMA_50, title='Buy Signal', text='B', textcolor=color.new(#FFFFFF, 0), style=shape.labelup, size=size.normal, location=location.belowbar, color=color.new(#1B8112, 0))
//plotshape(shortCondition and close<EMA_50, title='Sell Signal', text='S', textcolor=color.new(#FFFFFF, 0), style=shape.labeldown, size=size.normal, location=location.abovebar, color=color.new(#FF5733, 0))