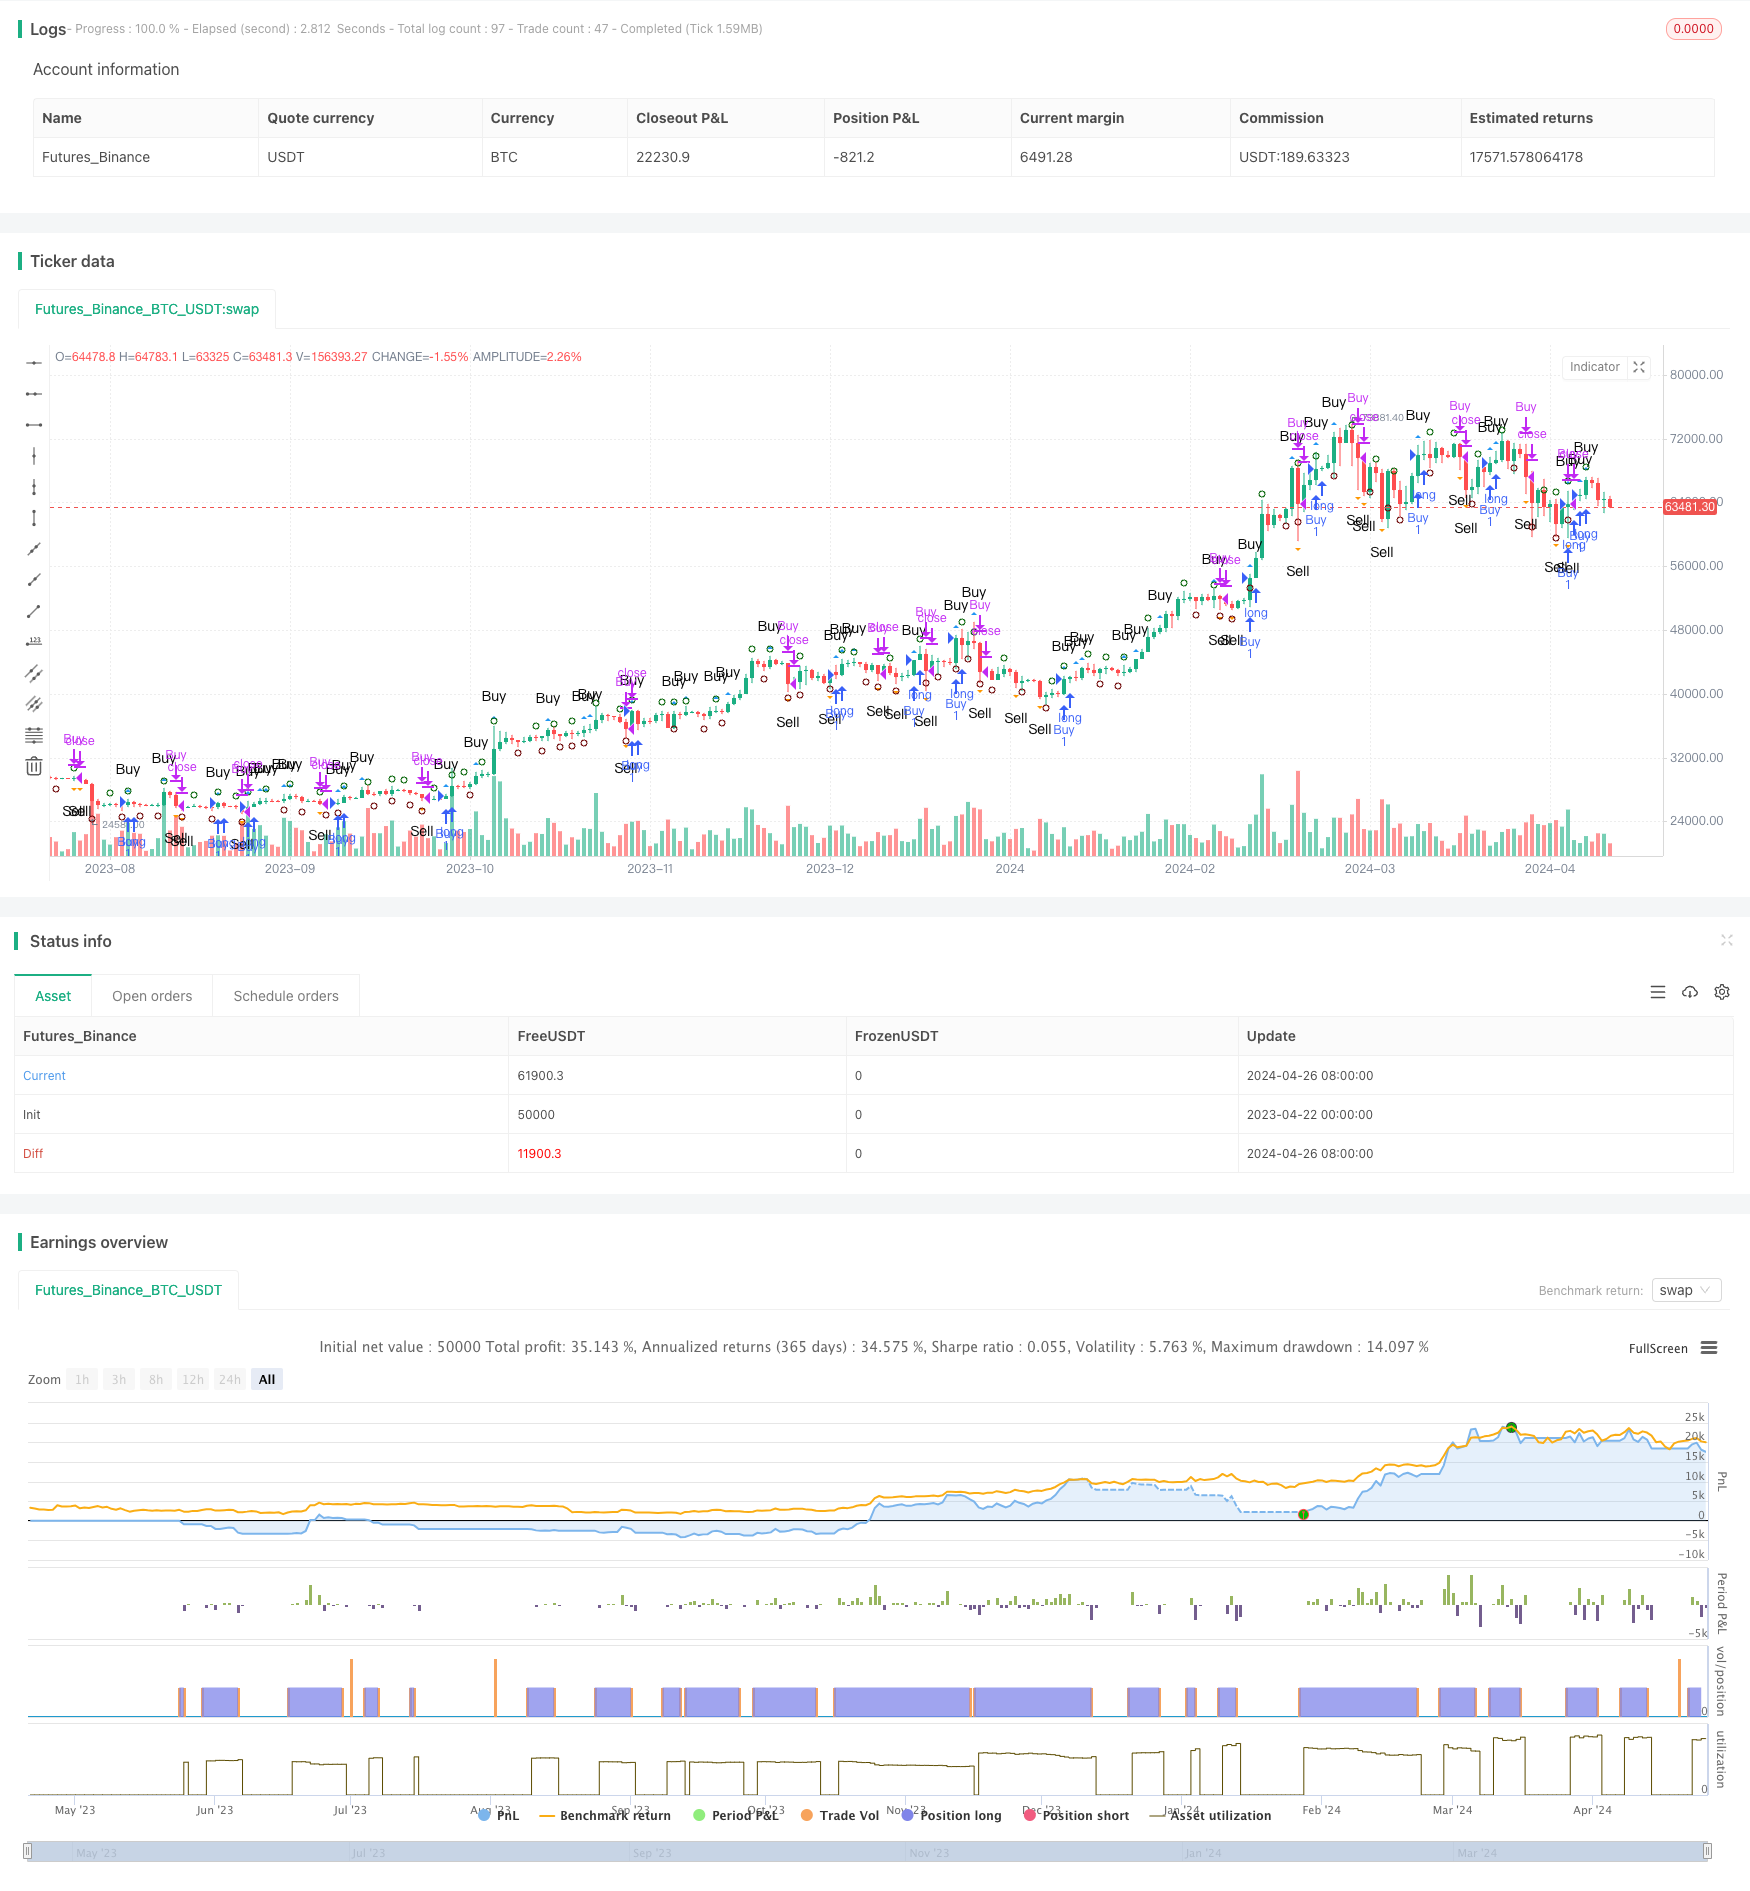
GBS高低点确认策略
Author: ChaoZhang, Date: 2024-04-28 14:42:02Tags: GBS

概述
GBS高低点确认策略是一个基于价格高低点变化来捕捉交易机会的策略。该策略通过识别特定的高点和低点形态,在高点突破时开仓做多,在低点跌破时平仓。该策略的主要思路是利用价格的波动规律,在相对高位开仓,在相对低位平仓,以此来获取价差收益。
策略原理
该策略的核心是识别潜在的进场点和出场点。进场条件是当前高点低于前一个高点,且前一个高点高于前两个高点(high < high[1] and high[1] > high[2])。当该条件满足时,标记进场高点并在该水平画一条绿线。买入条件是存在已记录的进场高点(entryHigh),当前高点突破该水平且开盘价低于进场高点。
出场条件与进场条件类似,是当前低点高于前一个低点,且前一个低点低于前两个低点(low > low[1] and low[1] < low[2])。当该条件满足时,标记出场低点并在该水平画一条红线。卖出条件是存在已记录的出场低点(exitLow),当前低点跌破该水平且开盘价高于出场低点。
策略优势
- 该策略基于简单的价格高低点形态,易于理解和实现。
- 通过在相对高位开仓和相对低位平仓,策略试图捕捉价格波动的中间部分,以获取价差收益。
- 策略使用可视化的绘图工具,如进场和出场条件的小圆点以及买卖信号的三角形,使得策略的执行过程更加直观明了。
策略风险
- 该策略依赖于特定的高低点形态,但并非所有这样的形态都能够带来盈利机会,可能会出现错误信号。
- 策略缺乏明确的止损机制,如果价格在开仓后出现急剧变化,可能会导致较大的损失。
- 该策略未考虑交易成本和滑点,实际应用中这些因素可能会影响策略的整体表现。
策略优化方向
- 加入适当的止损和止盈机制,以控制单笔交易的风险敞口。
- 考虑引入其他技术指标或过滤条件,如成交量、波动率等,以提高信号的可靠性。
- 对策略参数进行优化,如调整确认高低点所需的时间窗口,以适应不同的市场状况。
- 在实际应用前,对策略进行全面的回测和前向测试,并根据结果进行必要的调整。
总结
GBS高低点确认策略是一个基于价格高低点形态的交易策略,通过识别特定的进场和出场条件来捕捉价差机会。该策略的优势在于其简单性和直观性,但同时也存在一些潜在的风险,如错误信号和缺乏风险控制措施。为进一步改进该策略,可以考虑引入止损止盈机制,结合其他技术指标,并对参数进行优化。在实际应用前,全面的回测和前向测试是必要的。
/*backtest
start: 2023-04-22 00:00:00
end: 2024-04-27 00:00:00
period: 1d
basePeriod: 1h
exchanges: [{"eid":"Futures_Binance","currency":"BTC_USDT"}]
*/

//@version=5
strategy("GBS TOP BOTTOM Confirmed", overlay=true)

// Entry condition
var float entryHigh = na
var line entryLine = na
entryCondition = high < high[1] and high[1] > high[2]
if (entryCondition)
    entryHigh := high[1]
    // entryLine := line.new(bar_index - 1, entryHigh, bar_index + 10, entryHigh, color=color.green)

// Buy condition based on nearest entry
buyCondition = not na(entryHigh) and high > entryHigh and open < entryHigh

// Exit condition
var float exitLow = na
var line exitLine = na
exitCondition = low > low[1] and low[1] < low[2]
if (exitCondition)
    exitLow := low[1]
    // exitLine := line.new(bar_index - 1, exitLow, bar_index + 10, exitLow, color=color.red)

// Sell condition based on nearest exit
sellCondition = not na(exitLow) and low < exitLow and open > exitLow

// Strategy logic
strategy.entry("Buy", strategy.long, when = buyCondition)
strategy.close("Buy", when = sellCondition)

// Plot tiny dot above high[1] for entry condition
plotshape(series=entryCondition, title="Entry Dot", color=color.rgb(3, 99, 5), style=shape.circle, size=size.tiny, location=location.abovebar, offset=-1)

// Plot tiny dot below low[1] for exit condition
plotshape(series=exitCondition, title="Exit Dot", color=color.rgb(107, 3, 3), style=shape.circle, size=size.tiny, location=location.belowbar, offset=-1)

// Plot buy and sell signals
plotshape(series=buyCondition, title="Buy Signal", color=color.blue, style=shape.triangleup, size=size.small, location=location.abovebar, text="Buy")
plotshape(series=sellCondition, title="Sell Signal", color=color.orange, style=shape.triangledown, size=size.small, location=location.belowbar, text="Sell")
相关内容
更多内容
- Donchian突破交易策略
- Ichimoku Leading Span B 突破策略
- 基于EMA交叉的风险管理型多头策略
- MACD与RSI结合的长线交易策略
- DCA双均线海龟交易策略
- VWAP交易策略
- 多重指标组合策略(CCI,DMI,MACD,ADX)
- RSI2策略之日内反转胜率回测
- 赫斯特未来分界线策略
- 基于OBV与MA交叉信号的趋势跟踪策略
- 多指标趋势追踪策略
- 挤压回测变形金刚v2.0
- 斐波那契趋势反转策略
- HTF 锯齿形路径策略
- 基于WaveTrend指标的趋势追踪策略
- CCI、DMI和MACD混合多空策略
- AlphaTradingBot 交易策略
- 维加斯超级趋势增强策略
- 基于修正Hull移动平均与一目均衡的量化交易策略
- RSI趋势反转策略