概述
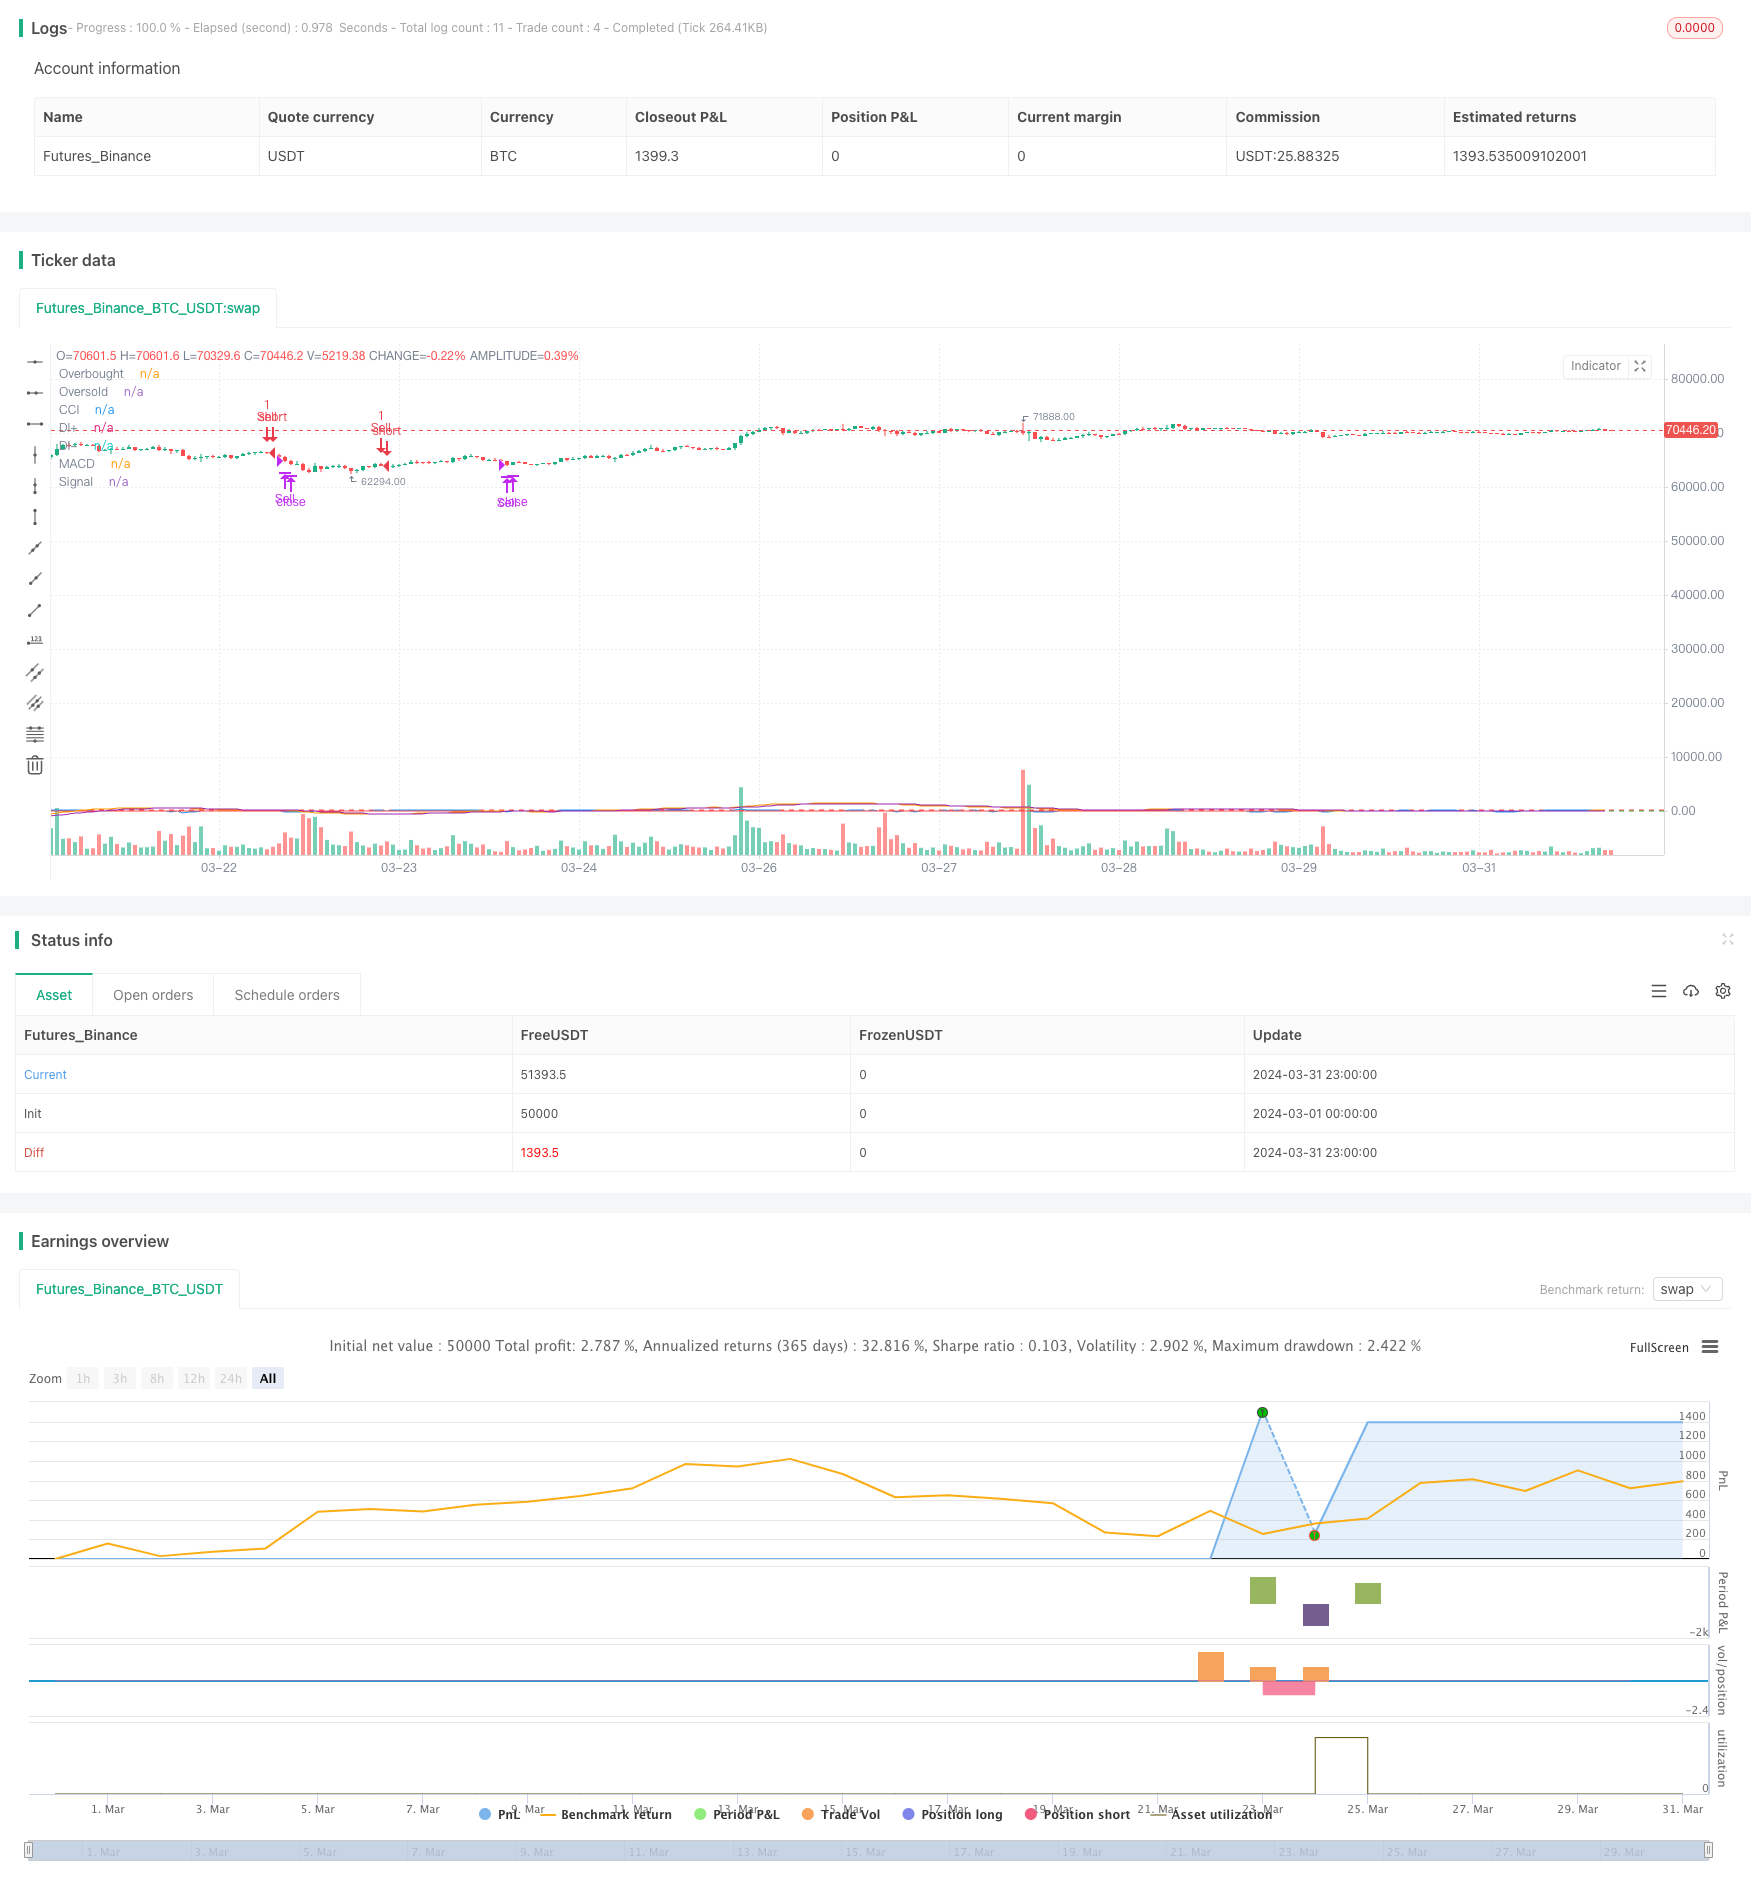
该策略结合了三个技术指标:顺势指标(CCI)、方向运动指数(DMI)和移动平均线聚散指标(MACD),用于判断市场的超买超卖状态以及趋势方向。当CCI从超卖区域向上突破,同时DI+大于DI-且MACD大于信号线时,产生买入信号;当CCI从超买区域向下突破,同时DI-大于DI+且MACD小于信号线时,产生卖出信号。
策略原理
- 计算CCI指标,用于判断市场的超买超卖状态。当CCI从超卖区(-100以下)向上突破时,表明市场由超卖转向,可能出现上涨;当CCI从超买区(100以上)向下突破时,表明市场由超买转向,可能出现下跌。
- 计算DMI指标,用于判断市场的趋势方向。当DI+大于DI-时,表明上升趋势占优;当DI-大于DI+时,表明下降趋势占优。
- 计算MACD指标,用于判断市场的趋势强度。当MACD大于信号线时,表明上升动能较强;当MACD小于信号线时,表明下降动能较强。
- 结合以上三个指标,当CCI从超卖区向上突破,同时DI+大于DI-且MACD大于信号线时,产生买入信号;当CCI从超买区向下突破,同时DI-大于DI+且MACD小于信号线时,产生卖出信号。
策略优势
- 结合了多个技术指标,从不同角度对市场进行分析,提高了信号的可靠性。
- 同时考虑了市场的超买超卖状态、趋势方向和趋势强度,能够捕捉到市场的主要趋势。
- 设置了明确的进场和出场条件,易于实现自动化交易。
策略风险
- 在市场震荡或者趋势不明朗时,该策略可能会产生较多的假信号,导致频繁交易和高昂的交易成本。
- 该策略依赖于历史数据,对于市场突发事件或者重大消息的反应可能较为迟缓。
- 策略参数(如CCI的超买超卖阈值、MACD的快慢线周期等)需要根据不同的市场和品种进行优化,否则可能影响策略表现。
策略优化方向
- 引入更多的技术指标或者市场情绪指标,提高信号的可靠性和稳定性。
- 对策略参数进行优化,可以使用遗传算法等智能优化方法,寻找最优参数组合。
- 加入风险控制模块,如止损止盈、仓位管理等,提高策略的风险收益比。
- 针对不同的市场环境,设置不同的交易规则,提高策略的适应性。
总结
该策略通过将CCI、DMI和MACD三个技术指标结合起来,对市场的超买超卖状态、趋势方向和趋势强度进行综合判断,产生买卖信号。策略思路清晰,易于实现,但在实际应用中需要注意优化策略参数、控制交易频率和风险,以提高策略的稳定性和盈利能力。
策略源码
/*backtest
start: 2024-03-01 00:00:00
end: 2024-03-31 23:59:59
period: 1h
basePeriod: 15m
exchanges: [{"eid":"Futures_Binance","currency":"BTC_USDT"}]
*/

//@version=5
strategy("CCI, DMI, and MACD Strategy", overlay=true)

// Define inputs
cci_length = input(14, title="CCI Length")
overbought_level = input(100, title="Overbought Level")
oversold_level = input(-100, title="Oversold Level")

// Calculate CCI
cci_value = ta.cci(close, cci_length)

// Calculate DMI
[di_plus, di_minus, _] = ta.dmi(14, 14)

// Calculate MACD
[macd_line, signal_line, _] = ta.macd(close, 24, 52, 9)

// Define buy and sell conditions
buy_signal = ta.crossover(cci_value, oversold_level) and di_plus > di_minus and macd_line > signal_line // CCI crosses above -100, Di+ > Di-, and MACD > Signal
sell_signal = ta.crossunder(cci_value, overbought_level) and di_minus > di_plus and macd_line < signal_line // CCI crosses below 100, Di- > Di+, and MACD < Signal

// Define exit conditions
buy_exit_signal = ta.crossover(cci_value, overbought_level) // CCI crosses above 100
sell_exit_signal = ta.crossunder(cci_value, oversold_level) // CCI crosses below -100

// Execute trades based on conditions
strategy.entry("Buy", strategy.long, when=buy_signal)
strategy.close("Buy", when=buy_exit_signal)

strategy.entry("Sell", strategy.short, when=sell_signal)
strategy.close("Sell", when=sell_exit_signal)

// Plot CCI
plot(cci_value, title="CCI", color=color.blue)

// Plot DMI
plot(di_plus, title="DI+", color=color.green)
plot(di_minus, title="DI-", color=color.red)

// Plot MACD and Signal lines
plot(macd_line, title="MACD", color=color.orange)
plot(signal_line, title="Signal", color=color.purple)

// Plot overbought and oversold levels
hline(overbought_level, "Overbought", color=color.red)
hline(oversold_level, "Oversold", color=color.green)
相关推荐