基于WaveTrend指标的趋势追踪策略
Author: ChaoZhang, Date: 2024-04-28 13:56:27Tags: EMASMAHLCC3ESA
概述
WaveTrend Cross LazyBear策略是一个基于WaveTrend指标的交易策略。该策略使用两条不同周期的WaveTrend指标线,当较快周期的WaveTrend指标线上穿较慢周期的WaveTrend指标线时产生买入信号,当较快周期的WaveTrend指标线下穿较慢周期的WaveTrend指标线时产生卖出信号。该策略还设置了超买和超卖区域,用于辅助判断市场状态。
策略原理
该策略的核心是WaveTrend指标,该指标由以下步骤计算得出:
- 计算典型价格(AP),其等于最高价、最低价和收盘价的均值。
- 计算AP的指数移动平均线(ESA),周期为n1。
- 计算AP与ESA的差值的绝对值的指数移动平均值d,周期为n1。
- 计算指标CI,其等于(AP - ESA) / (0.015 * d)。
- 计算CI的指数移动平均线TCI,周期为n2,得到WaveTrend指标。
该策略使用两条不同周期(默认为10和21)的WaveTrend指标线,分别记为WT1和WT2。当WT1上穿WT2时,产生买入信号;当WT1下穿WT2时,产生卖出信号。此外,该策略还设置了4个辅助判断的水平:超买水平1、超买水平2、超卖水平1和超卖水平2,用于辅助判断市场状态。
策略优势
- WaveTrend指标结合了动量和波动率的特点,能够较好地捕捉市场趋势。
- 双重周期的WaveTrend指标能够有效过滤掉一些噪音信号。
- 超买超卖水平的设置可以在一定程度上防止策略在市场波动较大时频繁交易。
- 策略逻辑清晰,易于理解和实现。
策略风险
- 该策略在震荡市中可能会出现较多的假信号。
- 参数的选择对策略表现有较大影响,不同的参数可能导致策略表现差异较大。
- 策略未考虑风险控制,在极端行情下可能出现较大回撤。
策略优化方向
- 可以考虑加入趋势过滤条件,如长期均线的方向,以减少震荡市中的假信号。
- 可以优化超买超卖水平的设置,使其能够更加动态地适应不同的市场状态。
- 可以加入止损和止盈机制,控制单次交易的风险。
- 可以通过参数优化来寻找最佳的参数组合。
总结
WaveTrend Cross LazyBear策略是一个基于WaveTrend指标的趋势追踪策略,通过双重周期的指标设计和超买超卖水平的辅助判断,在捕捉趋势的同时也兼顾了一定的风险控制。但是,该策略在震荡市中可能出现较多假信号,且缺乏严格的风险管理措施,实际应用中还需要进一步的优化和改进。
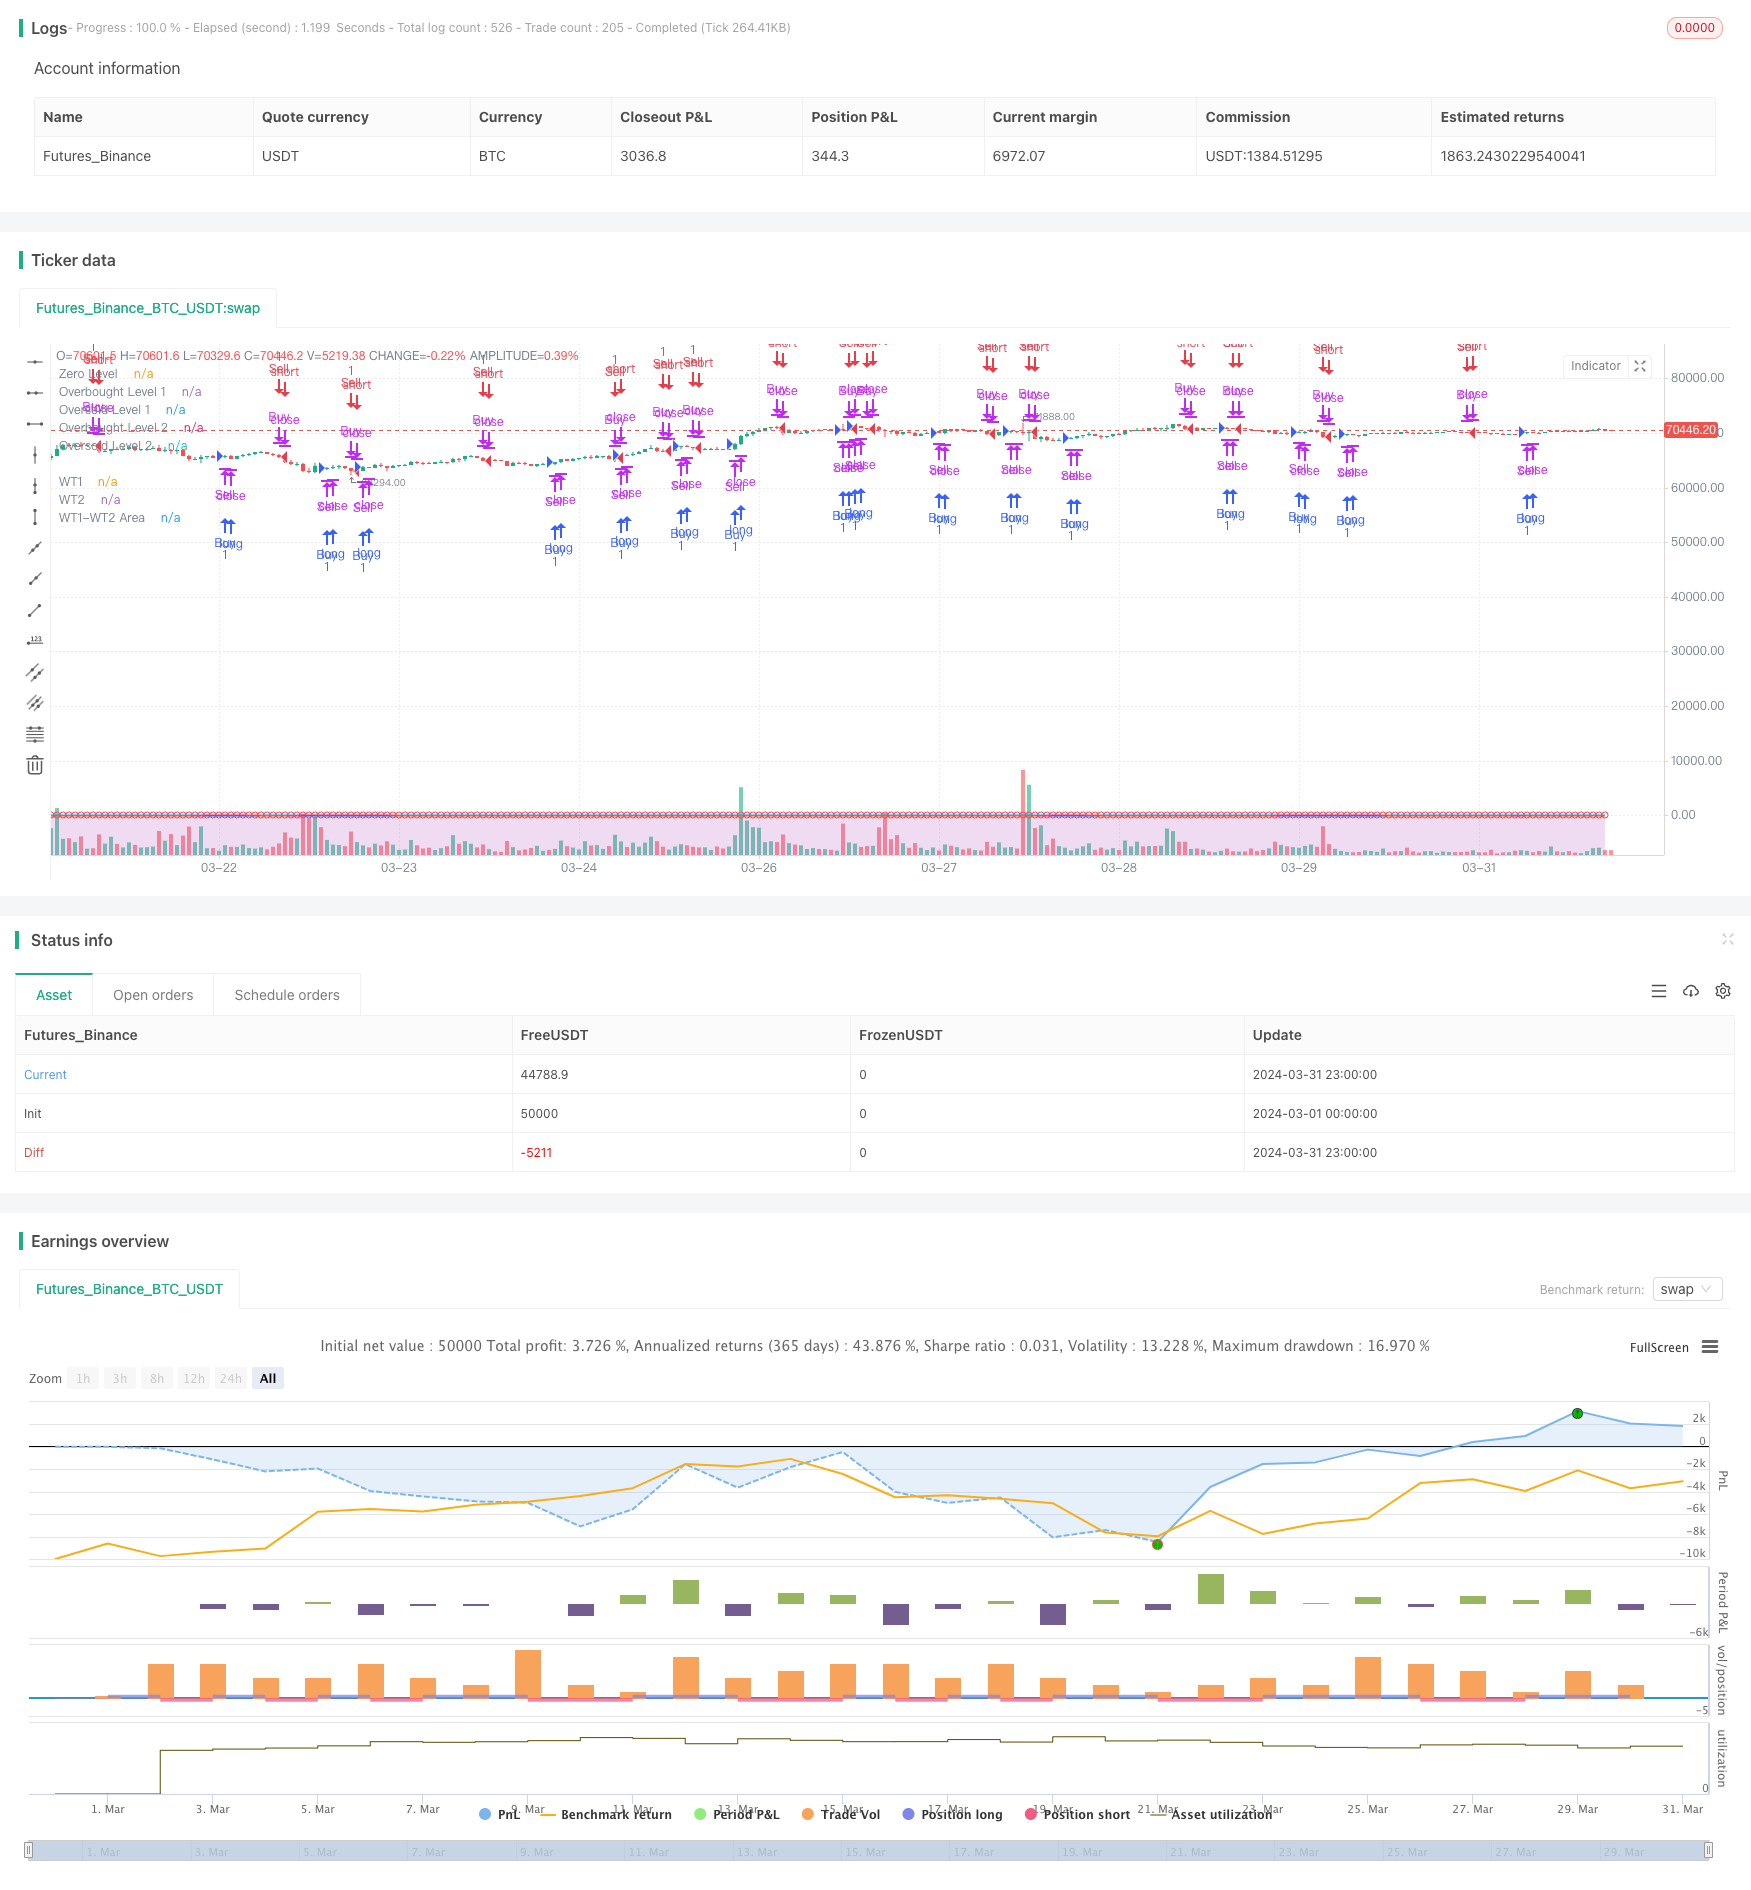
/*backtest
start: 2024-03-01 00:00:00
end: 2024-03-31 23:59:59
period: 1h
basePeriod: 15m
exchanges: [{"eid":"Futures_Binance","currency":"BTC_USDT"}]
*/

// This Pine Script™ code is subject to the terms of the Mozilla Public License 2.0 at https://mozilla.org/MPL/2.0/
// © burakaydingr

//@version=5
strategy("WaveTrend with Crosses [LazyBear]", shorttitle="WT_CROSS_LB", overlay=true)

// Kullanıcı girişleri
n1 = input(10, title="Channel Length")
n2 = input(21, title="Average Length")
obLevel1 = input(60, title="Over Bought Level 1")
obLevel2 = input(53, title="Over Bought Level 2")
osLevel1 = input(-60, title="Over Sold Level 1")
osLevel2 = input(-53, title="Over Sold Level 2")

// Temel hesaplamalar
ap = hlc3
esa = ta.ema(ap, n1)
d = ta.ema(math.abs(ap - esa), n1)
ci = (ap - esa) / (0.015 * d)
tci = ta.ema(ci, n2)

// WaveTrend göstergeleri
wt1 = tci
wt2 = ta.sma(wt1, 4)

// Al ve Sat Sinyalleri
buySignal = ta.crossover(wt1, wt2)
sellSignal = ta.crossunder(wt1, wt2)

// Alım ve Satım pozisyonları
if (buySignal)
    if (strategy.position_size <= 0) // Eğer şu anda açık bir satış pozisyonu varsa, onu kapat
        strategy.close("Sell")
    strategy.entry("Buy", strategy.long, comment="Buy Signal: Price crossed above WT2")

if (sellSignal)
    if (strategy.position_size >= 0) // Eğer şu anda açık bir alım pozisyonu varsa, onu kapat
        strategy.close("Buy")
    strategy.entry("Sell", strategy.short, comment="Sell Signal: Price crossed below WT2")

// Renkler ve diğer görseller
plot(0, color=color.new(color.gray, 0), title="Zero Level")
plot(obLevel1, color=color.new(color.red, 0), title="Overbought Level 1")
plot(osLevel1, color=color.new(color.green, 0), title="Oversold Level 1")
plot(obLevel2, color=color.new(color.purple, 0), title="Overbought Level 2")
plot(osLevel2, color=color.new(color.orange, 0), title="Oversold Level 2")

plot(wt1, color=color.new(color.red, 0), title="WT1")
plot(wt2, color=color.new(color.blue, 0), title="WT2")
plot(wt1-wt2, color=color.new(color.purple, 80), style=plot.style_area, title="WT1-WT2 Area")

// İşaretler
plotshape(buySignal, location=location.absolute, color=color.new(color.yellow, 0), style=shape.circle, size=size.small, title="Buy Signal")
plotshape(sellSignal, location=location.absolute, color=color.new(color.red, 0), style=shape.circle, size=size.small, title="Sell Signal")
相关内容
- 基于波浪趋势与分散投资的智能循环交易策略
- 多重均线趋势动量识别与止损交易系统
- EMA5与EMA13交叉策略
- 多重指数移动平均线交叉动量策略
- 双均线成交量趋势确认量化交易策略
- EMA交叉动量短线交易策略
- Trading ABC
- 超级均线与Upperband交叉策略
- SMA双均线交叉策略
- EMA, SMA, 均线交叉, 动量指标
更多内容
- VWAP交易策略
- 多重指标组合策略(CCI,DMI,MACD,ADX)
- RSI2策略之日内反转胜率回测
- 赫斯特未来分界线策略
- 基于OBV与MA交叉信号的趋势跟踪策略
- GBS高低点确认策略
- 多指标趋势追踪策略
- 挤压回测变形金刚v2.0
- 斐波那契趋势反转策略
- HTF 锯齿形路径策略
- CCI、DMI和MACD混合多空策略
- AlphaTradingBot 交易策略
- 维加斯超级趋势增强策略
- 基于修正Hull移动平均与一目均衡的量化交易策略
- RSI趋势反转策略
- 随机交叉指标动量交易策略
- RSI与双EMA交叉信号量化策略
- 艾略特波浪理论4-9脉冲波自动检测交易策略
- 随机震荡指标与均线交叉策略结合止损与随机震荡过滤器
- 日内可扩展波动率交易策略