概述
该策略结合了简单移动平均线(SMA)、支撑阻力位和交易量增加这三个技术指标,构建了一个全面的交易策略。策略的主要思路是在价格突破SMA均线、支撑阻力位且伴随交易量放大的情况下进行交易,同时设置了止损条件以控制风险。
策略原理
- 计算指定周期的SMA均线、支撑位和阻力位。
- 判断当前交易量是否较前一周期有所增加。
- 多头入场条件:当前收盘价大于前一周期收盘价,且大于SMA均线和支撑位,同时价格距离阻力位一定距离,并伴随交易量增加。
- 空头入场条件:当前收盘价小于前一周期收盘价,且小于SMA均线和支撑位,同时价格距离阻力位一定距离,并伴随交易量增加。
- 止损条件:多头止损价格为入场价格乘以(1-止损百分比),空头止损价格为入场价格乘以(1+止损百分比)。
优势分析
- 结合多个技术指标,提高了策略的可靠性和稳定性。
- 同时考虑价格突破SMA均线和支撑阻力位,能够更好地捕捉趋势性机会。
- 引入交易量指标,确保价格突破伴随足够的市场参与度,提高了信号的有效性。
- 设置止损条件,有效控制了交易风险。
风险分析
- 支撑阻力位的计算依赖于历史数据,在市场出现大幅波动时,可能失去有效性。
- 交易量指标可能出现异常波动,导致产生错误信号。
- 止损条件的设置可能无法完全避免市场极端情况下的损失。
优化方向
- 考虑引入其他技术指标,如相对强弱指数(RSI)或移动平均线收敛发散(MACD),以进一步验证交易信号的可靠性。
- 对支撑阻力位的计算方法进行优化,如采用更加动态的方法,以适应不同的市场状况。
- 对交易量指标进行平滑处理,减少异常波动对策略的影响。
- 优化止损条件的设置,如采用移动止损或根据市场波动情况动态调整止损百分比。
总结
该策略通过结合SMA均线、支撑阻力位和交易量指标,构建了一个全面的交易策略。策略的优势在于能够捕捉趋势性机会,同时控制交易风险。然而,策略也存在一定的局限性,如对市场极端情况的适应能力有待提高。未来可以通过引入其他技术指标、优化支撑阻力位计算方法、平滑交易量指标以及优化止损条件等方面对策略进行改进,以提高其稳定性和盈利能力。
策略源码
/*backtest
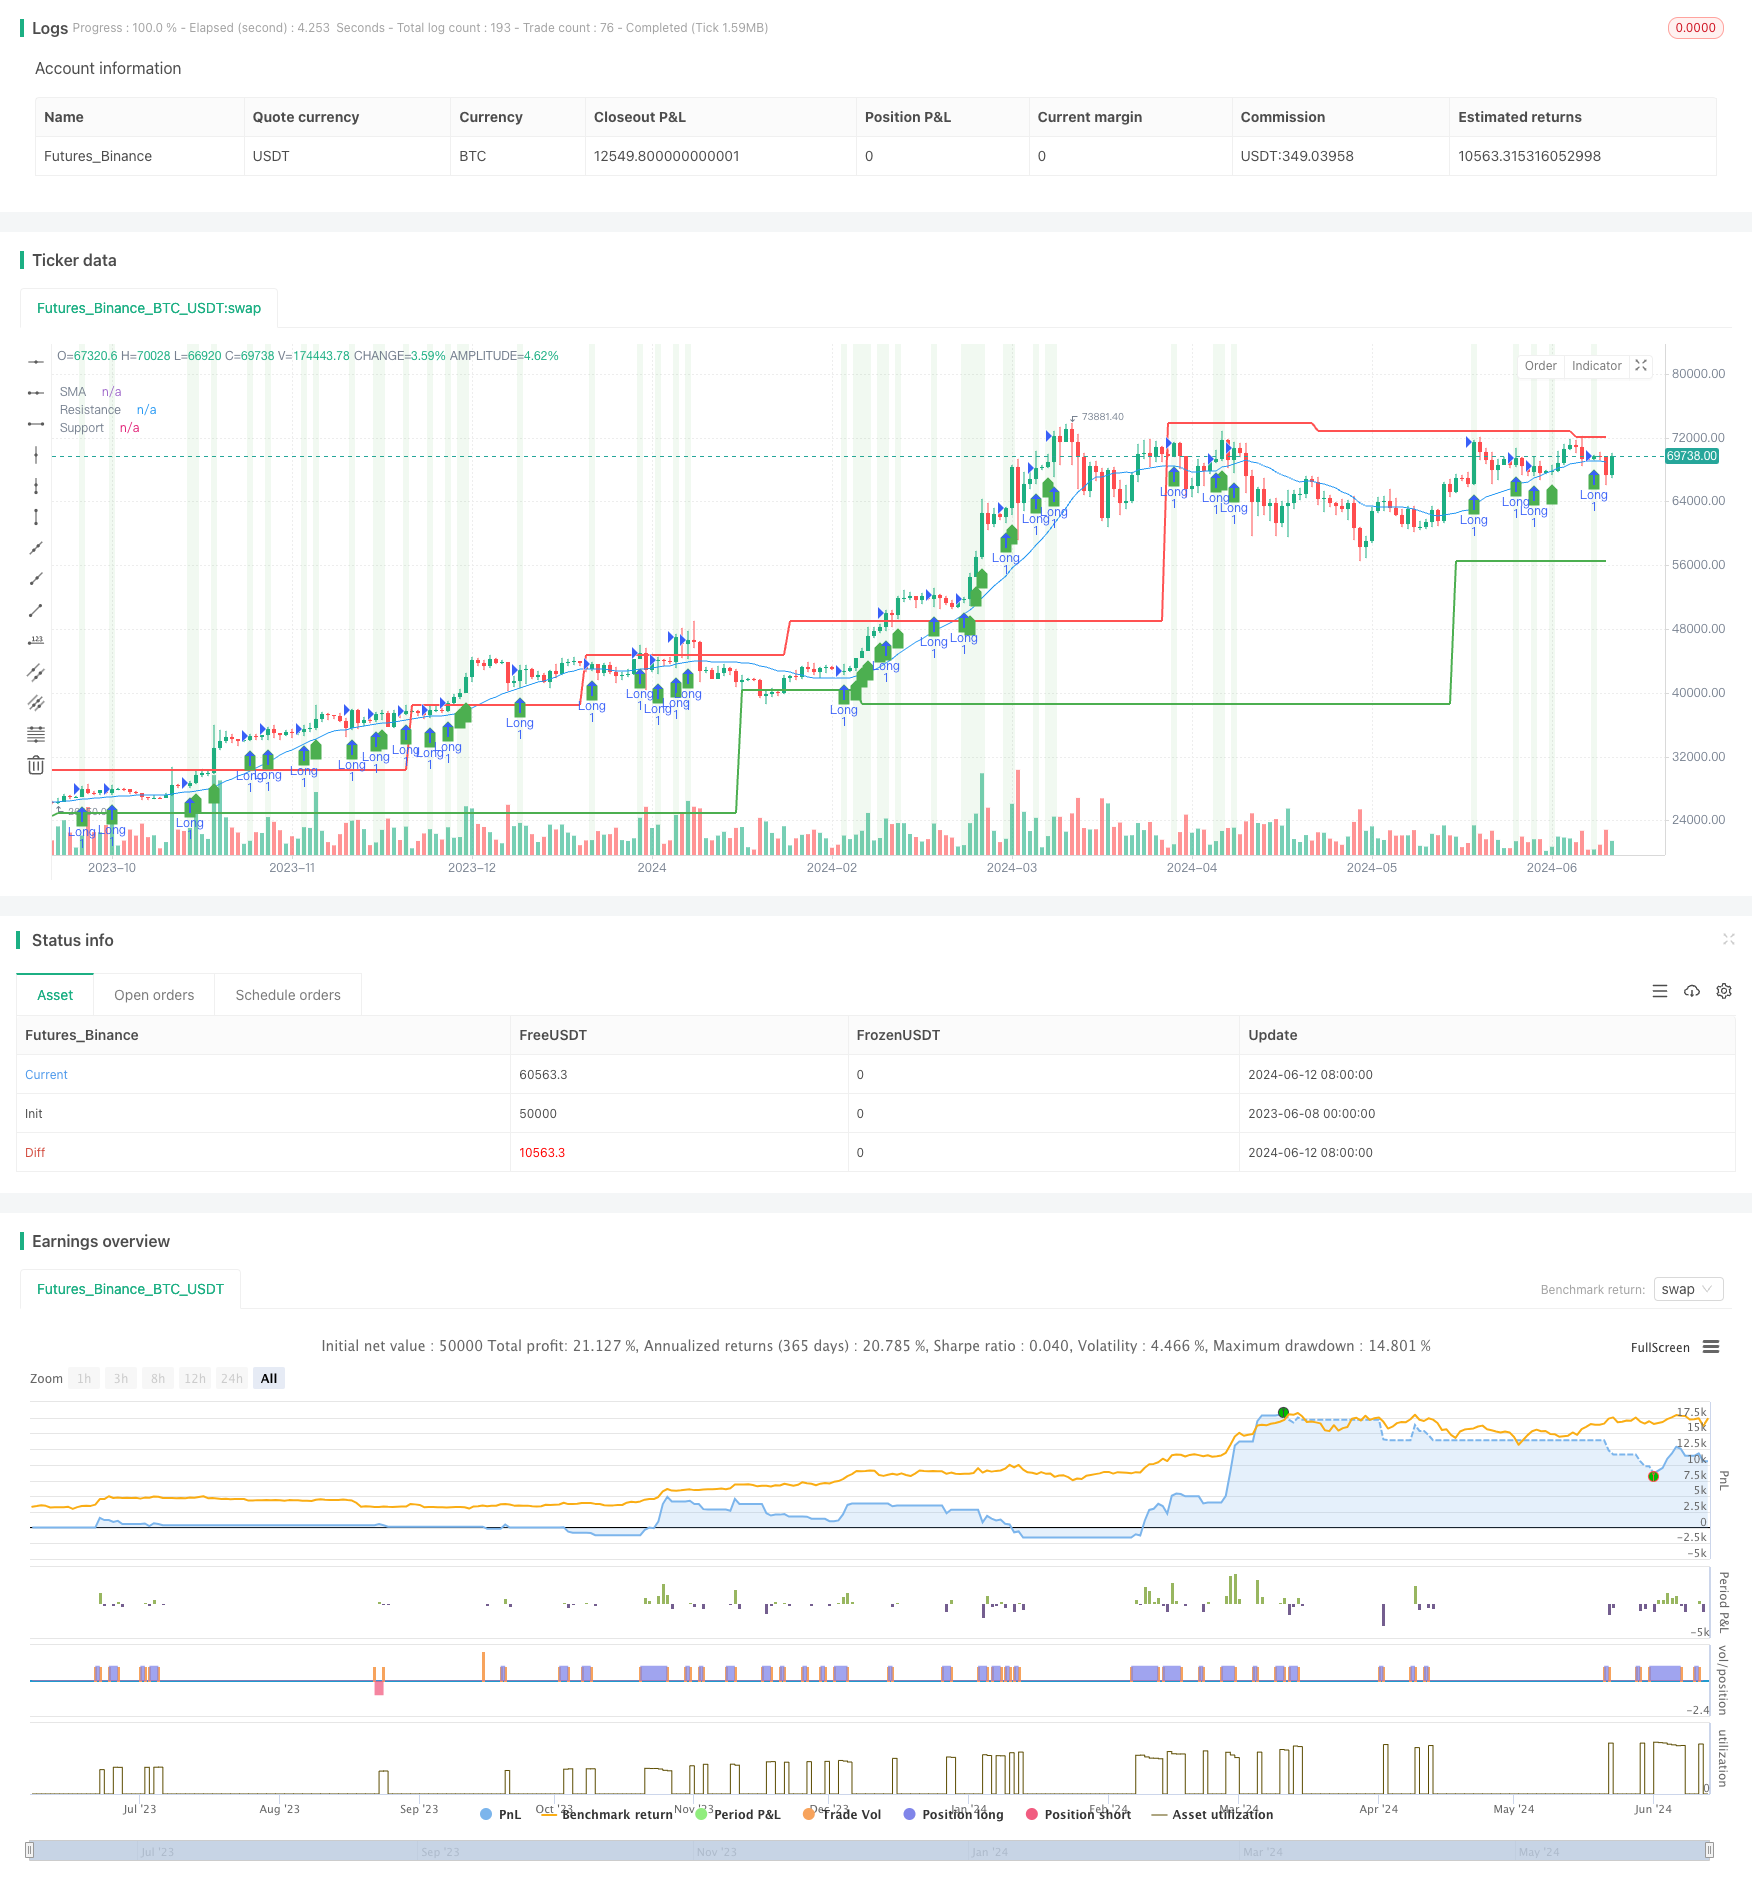
start: 2023-06-08 00:00:00
end: 2024-06-13 00:00:00
period: 1d
basePeriod: 1h
exchanges: [{"eid":"Futures_Binance","currency":"BTC_USDT"}]
*/
//@version=4
strategy("Advanced Entry Conditions with Support/Resistance, SMA, and Volume", overlay=true)
// Inputs
length = input(20, title="SMA Length")
stopLossPerc = input(1, title="Stop Loss Percentage", type=input.float) / 100
leftBars = input(15, title="Left Bars")
rightBars = input(15, title="Right Bars")
distanceThresh = input(1, title="Distance Threshold from Support/Resistance", type=input.float) / 100
// Calculations
smaValue = sma(close, length)
highUsePivot = fixnan(pivothigh(leftBars, rightBars)[1])
lowUsePivot = fixnan(pivotlow(leftBars, rightBars)[1])
// Volume Calculation
volumeIncrease = volume > volume[1]
// Entry Conditions
longEntryCondition = close[0] > close[1] and close[1] > smaValue and close[0] > smaValue and close[0] > lowUsePivot and close[1] > lowUsePivot and abs(close[0] - highUsePivot) > distanceThresh and volumeIncrease
shortEntryCondition = close[0] < close[1] and close[1] < smaValue and close[0] < smaValue and close[0] < lowUsePivot and close[1] < lowUsePivot and abs(close[0] - highUsePivot) > distanceThresh and volumeIncrease
// Calculate stop loss levels
longStopLoss = close * (1 - stopLossPerc)
shortStopLoss = close * (1 + stopLossPerc)
// Strategy Logic
strategy.entry("Long", strategy.long, when=longEntryCondition)
strategy.exit("Exit Long", "Long", stop=longStopLoss)
strategy.entry("Short", strategy.short, when=shortEntryCondition)
strategy.exit("Exit Short", "Short", stop=shortStopLoss)
// Plotting
plot(smaValue, color=color.blue, title="SMA")
plot(highUsePivot, color=color.red, linewidth=2, title="Resistance")
plot(lowUsePivot, color=color.green, linewidth=2, title="Support")
plotshape(series=longEntryCondition, location=location.belowbar, color=color.green, style=shape.labelup, title="Long Entry")
plotshape(series=shortEntryCondition, location=location.abovebar, color=color.red, style=shape.labeldown, title="Short Entry")
// Background Color
bgcolor(longEntryCondition ? color.new(color.green, 90) : shortEntryCondition ? color.new(color.red, 90) : na)
更多内容
- 基于双均线交叉、RSI和随机指标的短线量化交易策略
- RSI低点反转策略
- Fisher变换动态阈值趋势跟踪策略
- 均值回归策略
- EMA100与NUPL相对未实现利润量化交易策略
- 基于随机振荡指标的波动区间交易策略
- 简单组合策略:枢轴点超级趋势和双重指数移动平均线
- EMA趋势过滤策略
- 移动平均线交叉策略
- 基于三分钟K线高低点的日内突破策略
- EMA RSI MACD动态止盈止损交易策略
- G趋势EMA ATR智能交易策略
- 基于200日均线和随机振子的趋势追踪策略
- RSI趋势策略
- EMA交叉动量短线交易策略
- BB均线突破策略
- VWAP与RSI动态布林带止盈止损策略
- Chande-Kroll止损动态ATR趋势跟踪策略
- 基于Chaikin资金流量(CMF)指标策略
- 趋势过滤Pin Bar反转策略