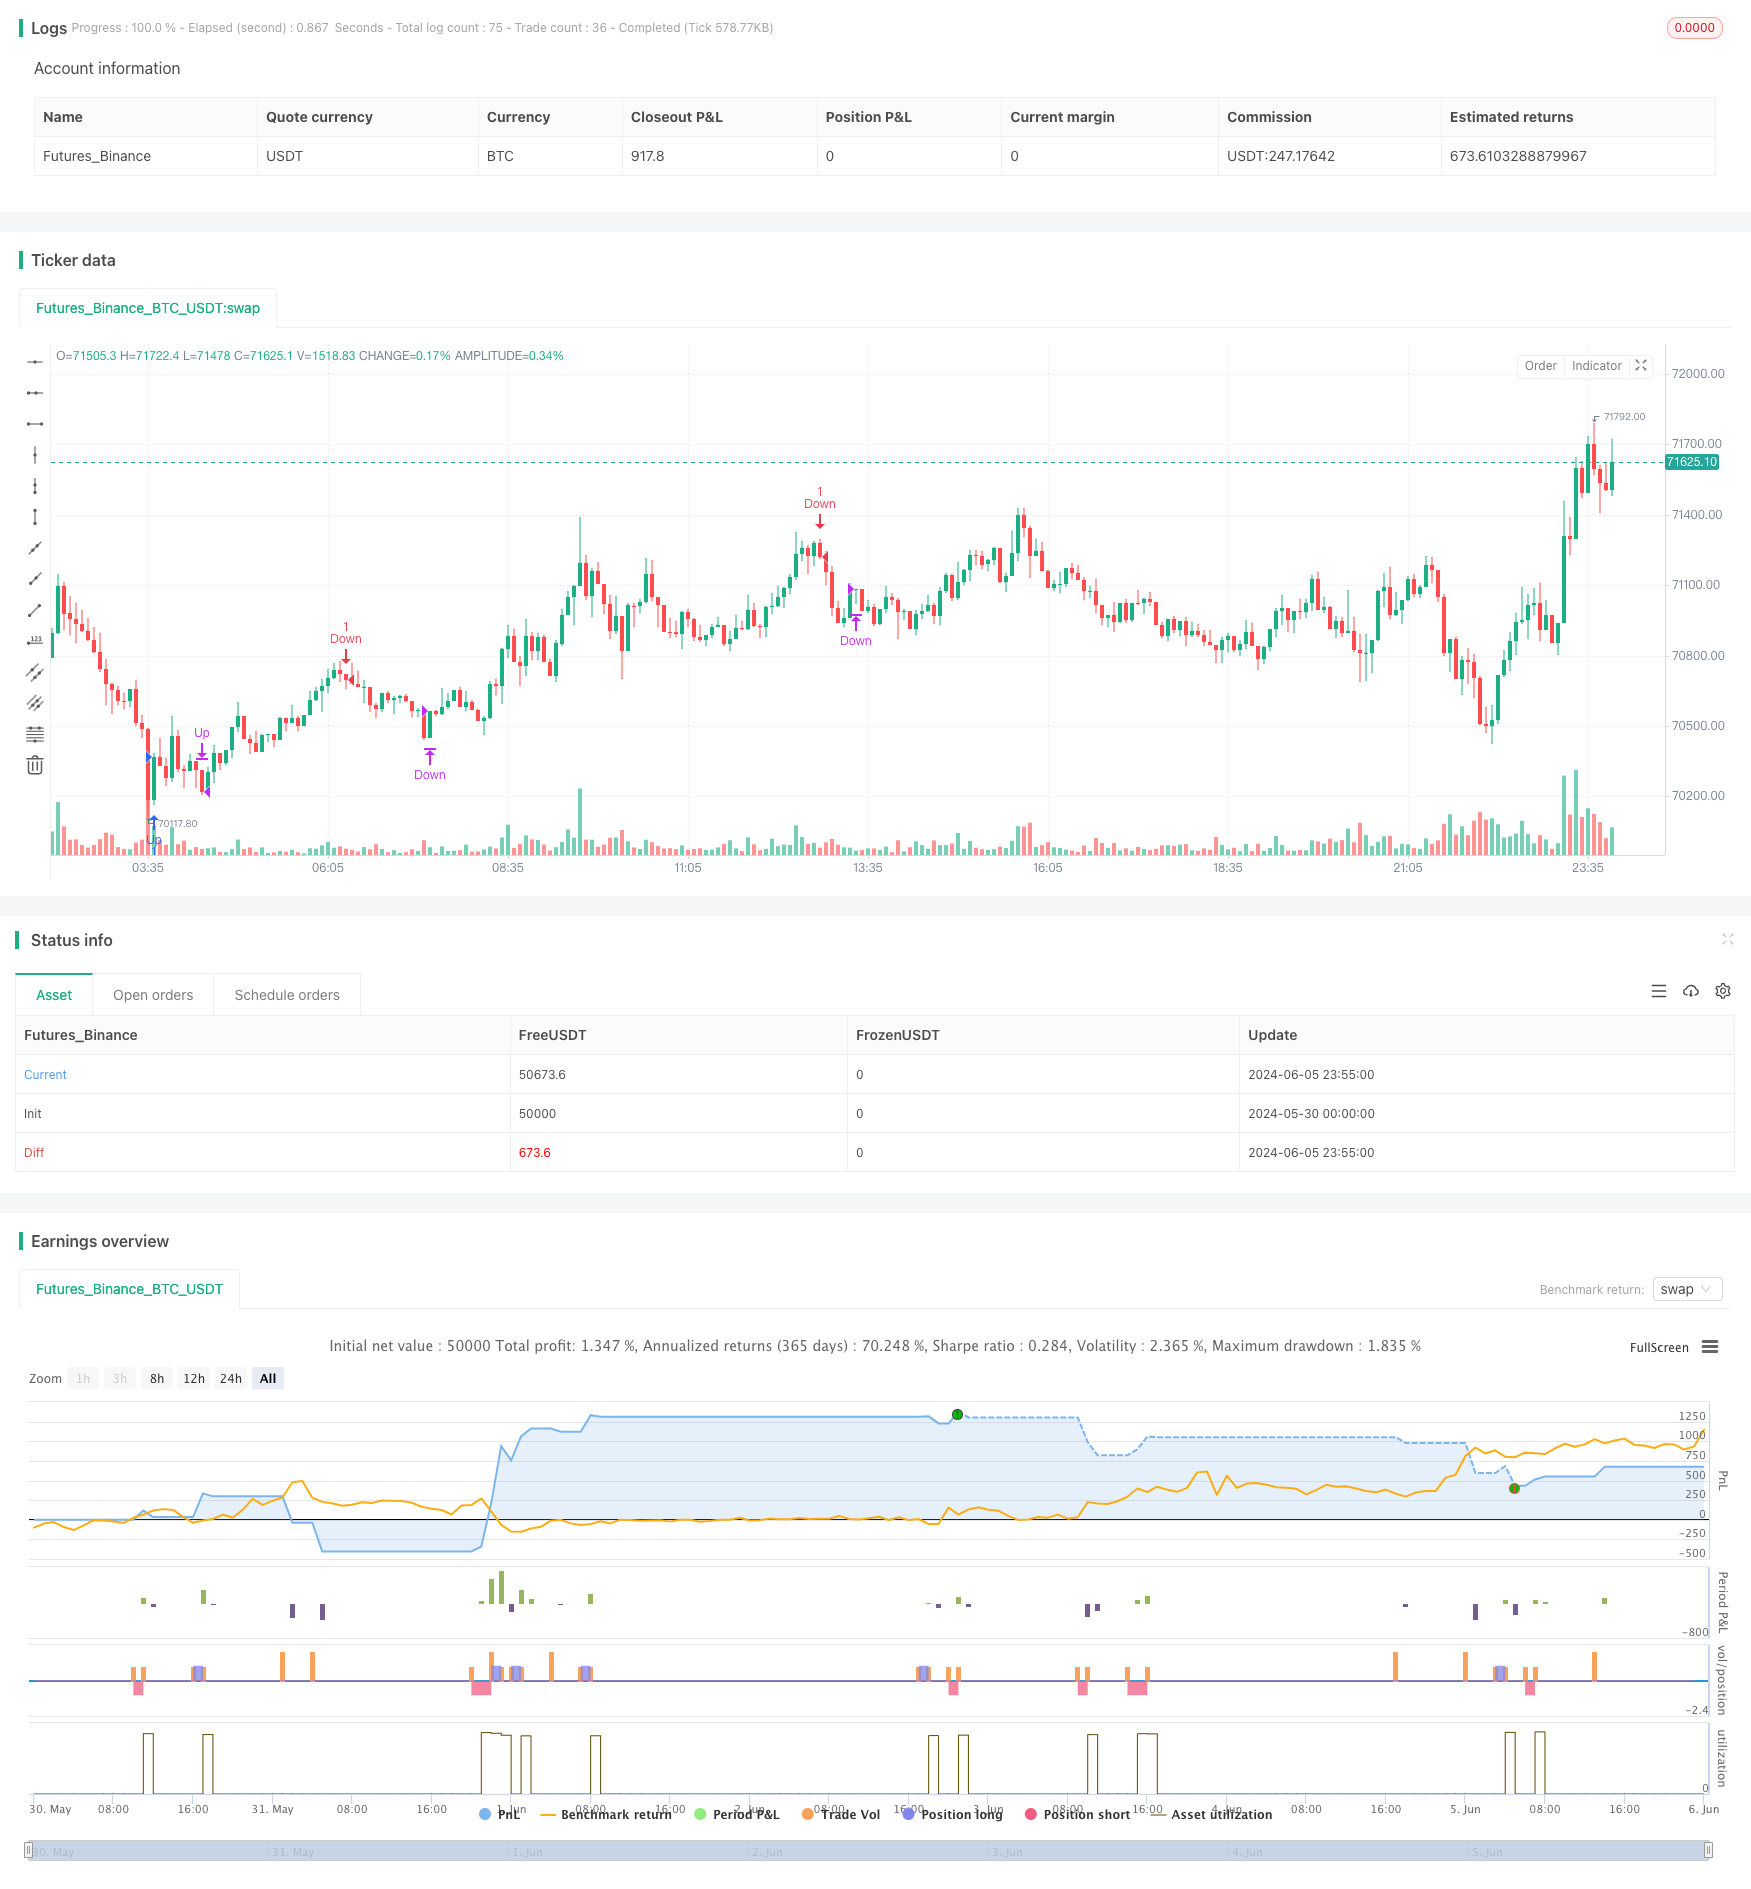
概述
该策略使用TSI指标作为主要的交易信号。当TSI指标与其信号线发生交叉,且TSI指标低于下限或高于上限时,策略就会产生开仓信号。同时该策略还使用了EMA和ATR等指标来优化策略表现。策略只在特定的交易时段内运行,并设置了最小交易频率来控制过度交易。
策略原理
- 计算TSI指标值和信号线值。
- 判断当前是否在允许交易的时间范围内,并且当前bar距离上次交易至少间隔了指定的最小bar数。
- 如果TSI指标从下向上穿过信号线,且此时信号线低于指定的下限,则产生做多信号。
- 如果TSI指标从上向下穿过信号线,且此时信号线高于指定的上限,则产生做空信号。
- 如果当前持有多头仓位,一旦TSI指标从上向下穿过信号线,则平掉所有多头仓位。
- 如果当前持有空头仓位,一旦TSI指标从下向上穿过信号线,则平掉所有空头仓位。
优势分析
- 策略逻辑清晰,使用TSI指标的交叉作为唯一的开平仓条件,简单易懂。
- 通过限制交易时段和交易频率,有效控制了过度交易的风险。
- 及时止损止盈,一旦出现相反信号就果断平仓,控制了单笔交易的风险敞口。
- 使用了多个指标来辅助判断,如EMA, ATR等,增强了策略的稳健性。
风险分析
- 策略对TSI指标参数的选择比较敏感,不同参数会带来很大的性能差异,需要谨慎选择。
- 开仓和平仓条件都比较简单,缺乏趋势判断和波动率约束,在震荡行情中可能出现亏损。
- 缺乏仓位管理和资金管理,难以控制回撤,一旦连续亏损就会导致大幅回撤。
- 只做多空反转,而不做趋势跟踪,会错失很多趋势行情的机会。
优化方向
- 对TSI指标的参数进行优化,找到更稳健的参数组合。可以使用遗传算法等方法自动寻优。
- 加入趋势判断指标,如MA或MACD,在开仓时选择顺势方向,提高成功率。
- 加入波动率指标,如ATR,在高波动率市场环境中减少交易次数。
- 引入仓位管理模型,根据近期市场表现和账户净值等动态调整每笔交易的仓位大小。
- 可以增加趋势追踪的逻辑,在趋势行情中继续持仓,提高策略捕捉大行情的能力。
总结
该策略以TSI指标为核心,通过TSI与信号线的交叉来产生交易信号。同时限定了交易时间和交易频率来控制风险。策略优点是逻辑简单清晰,及时止损止盈。但是缺点是缺乏趋势判断和仓位管理,对TSI参数敏感,只能捕捉反转行情而错失趋势行情。未来可以从趋势和波动率判断、仓位管理、参数优化等方面对策略进行完善。
策略源码
/*backtest
start: 2024-05-30 00:00:00
end: 2024-06-06 00:00:00
period: 5m
basePeriod: 1m
exchanges: [{"eid":"Futures_Binance","currency":"BTC_USDT"}]
*/

// This Pine Script™ code is subject to the terms of the Mozilla Public License 2.0 at https://mozilla.org/MPL/2.0/
// © nikgavalas

//@version=5
strategy("TSI Entries", overlay=true, margin_long=100, margin_short=100)

//
// INPUTS
//

// Define the start and end hours for trading
string sessionInput = input("1000-1530", "Session")

// Day of the week.
string daysInput = input.string("23456", tooltip = "1 = Sunday, 7 = Saturday")

// Minimum number of bar's between entries
requiredBarsBetweenEntries = input.int(12, "Required Bars Between Entries")

// Show debug labels
bool showDebugLabels = input.bool(false, "Show Debug Labels")

//
// FUNCTIONS
//

//@function Define the triple exponential moving average function
tema(src, len) => tema = 3 * ta.ema(src, len) - 3 * ta.ema(ta.ema(src, len), len) + ta.ema(ta.ema(ta.ema(src, len), len), len)

//@function Atr with EMA
atr_ema(length) =>
    trueRange = na(high[1])? high-low : math.max(math.max(high - low, math.abs(high - close[1])), math.abs(low - close[1]))
    //true range can be also calculated with ta.tr(true)
    ta.ema(trueRange, length)

//@function Check if time is in range
timeinrange() =>
    sessionString = sessionInput + ":" + daysInput
    inSession = not na(time(timeframe.period, sessionString, "America/New_York"))

//@function Displays text passed to `txt` when called.
debugLabel(txt, color, y, style) =>
    if (showDebugLabels)
        label.new(bar_index, y, text = txt, color = color, style = style, textcolor = color.black, size = size.small)


//
// INDICATOR CODE
//

long = input(title="TSI Long Length", defval=8)
short = input(title="TSI Short Length", defval=8)
signal = input(title="TSI Signal Length", defval=3)
lowerLine = input(title="TSI Lower Line", defval=-50)
upperLine = input(title="TSI Upper Line", defval=50)

price = close
double_smooth(src, long, short) =>
	fist_smooth = ta.ema(src, long)
	ta.ema(fist_smooth, short)

pc = ta.change(price)
double_smoothed_pc = double_smooth(pc, long, short)
double_smoothed_abs_pc = double_smooth(math.abs(pc), long, short)
tsiValue = 100 * (double_smoothed_pc / double_smoothed_abs_pc)
signalValue = ta.ema(tsiValue, signal)

//
// COMMON VARIABLES
//

var color trendColor = na
var int lastEntryBar = na

bool tradeAllowed = timeinrange() == true and (na(lastEntryBar) or bar_index - lastEntryBar > requiredBarsBetweenEntries)

//
// CROSSOVER
//

bool crossOver = ta.crossover(tsiValue, signalValue)
bool crossUnder = ta.crossunder(tsiValue,signalValue)

if (tradeAllowed)
	if (signalValue < lowerLine and crossOver == true)
		strategy.entry("Up", strategy.long)
		lastEntryBar := bar_index

	else if (signalValue > upperLine and crossUnder == true)

		strategy.entry("Down", strategy.short)
		lastEntryBar := bar_index

//
// EXITS
//

if (strategy.position_size > 0 and crossUnder == true)
	strategy.close("Up", qty_percent = 100)

else if (strategy.position_size < 0 and crossOver == true)
	strategy.close("Down", qty_percent = 100)
相关推荐