基于机器学习的移动平均线交叉量化交易策略
Author: ChaoZhang, Date: 2024-06-21 17:59:06Tags: MASMAML
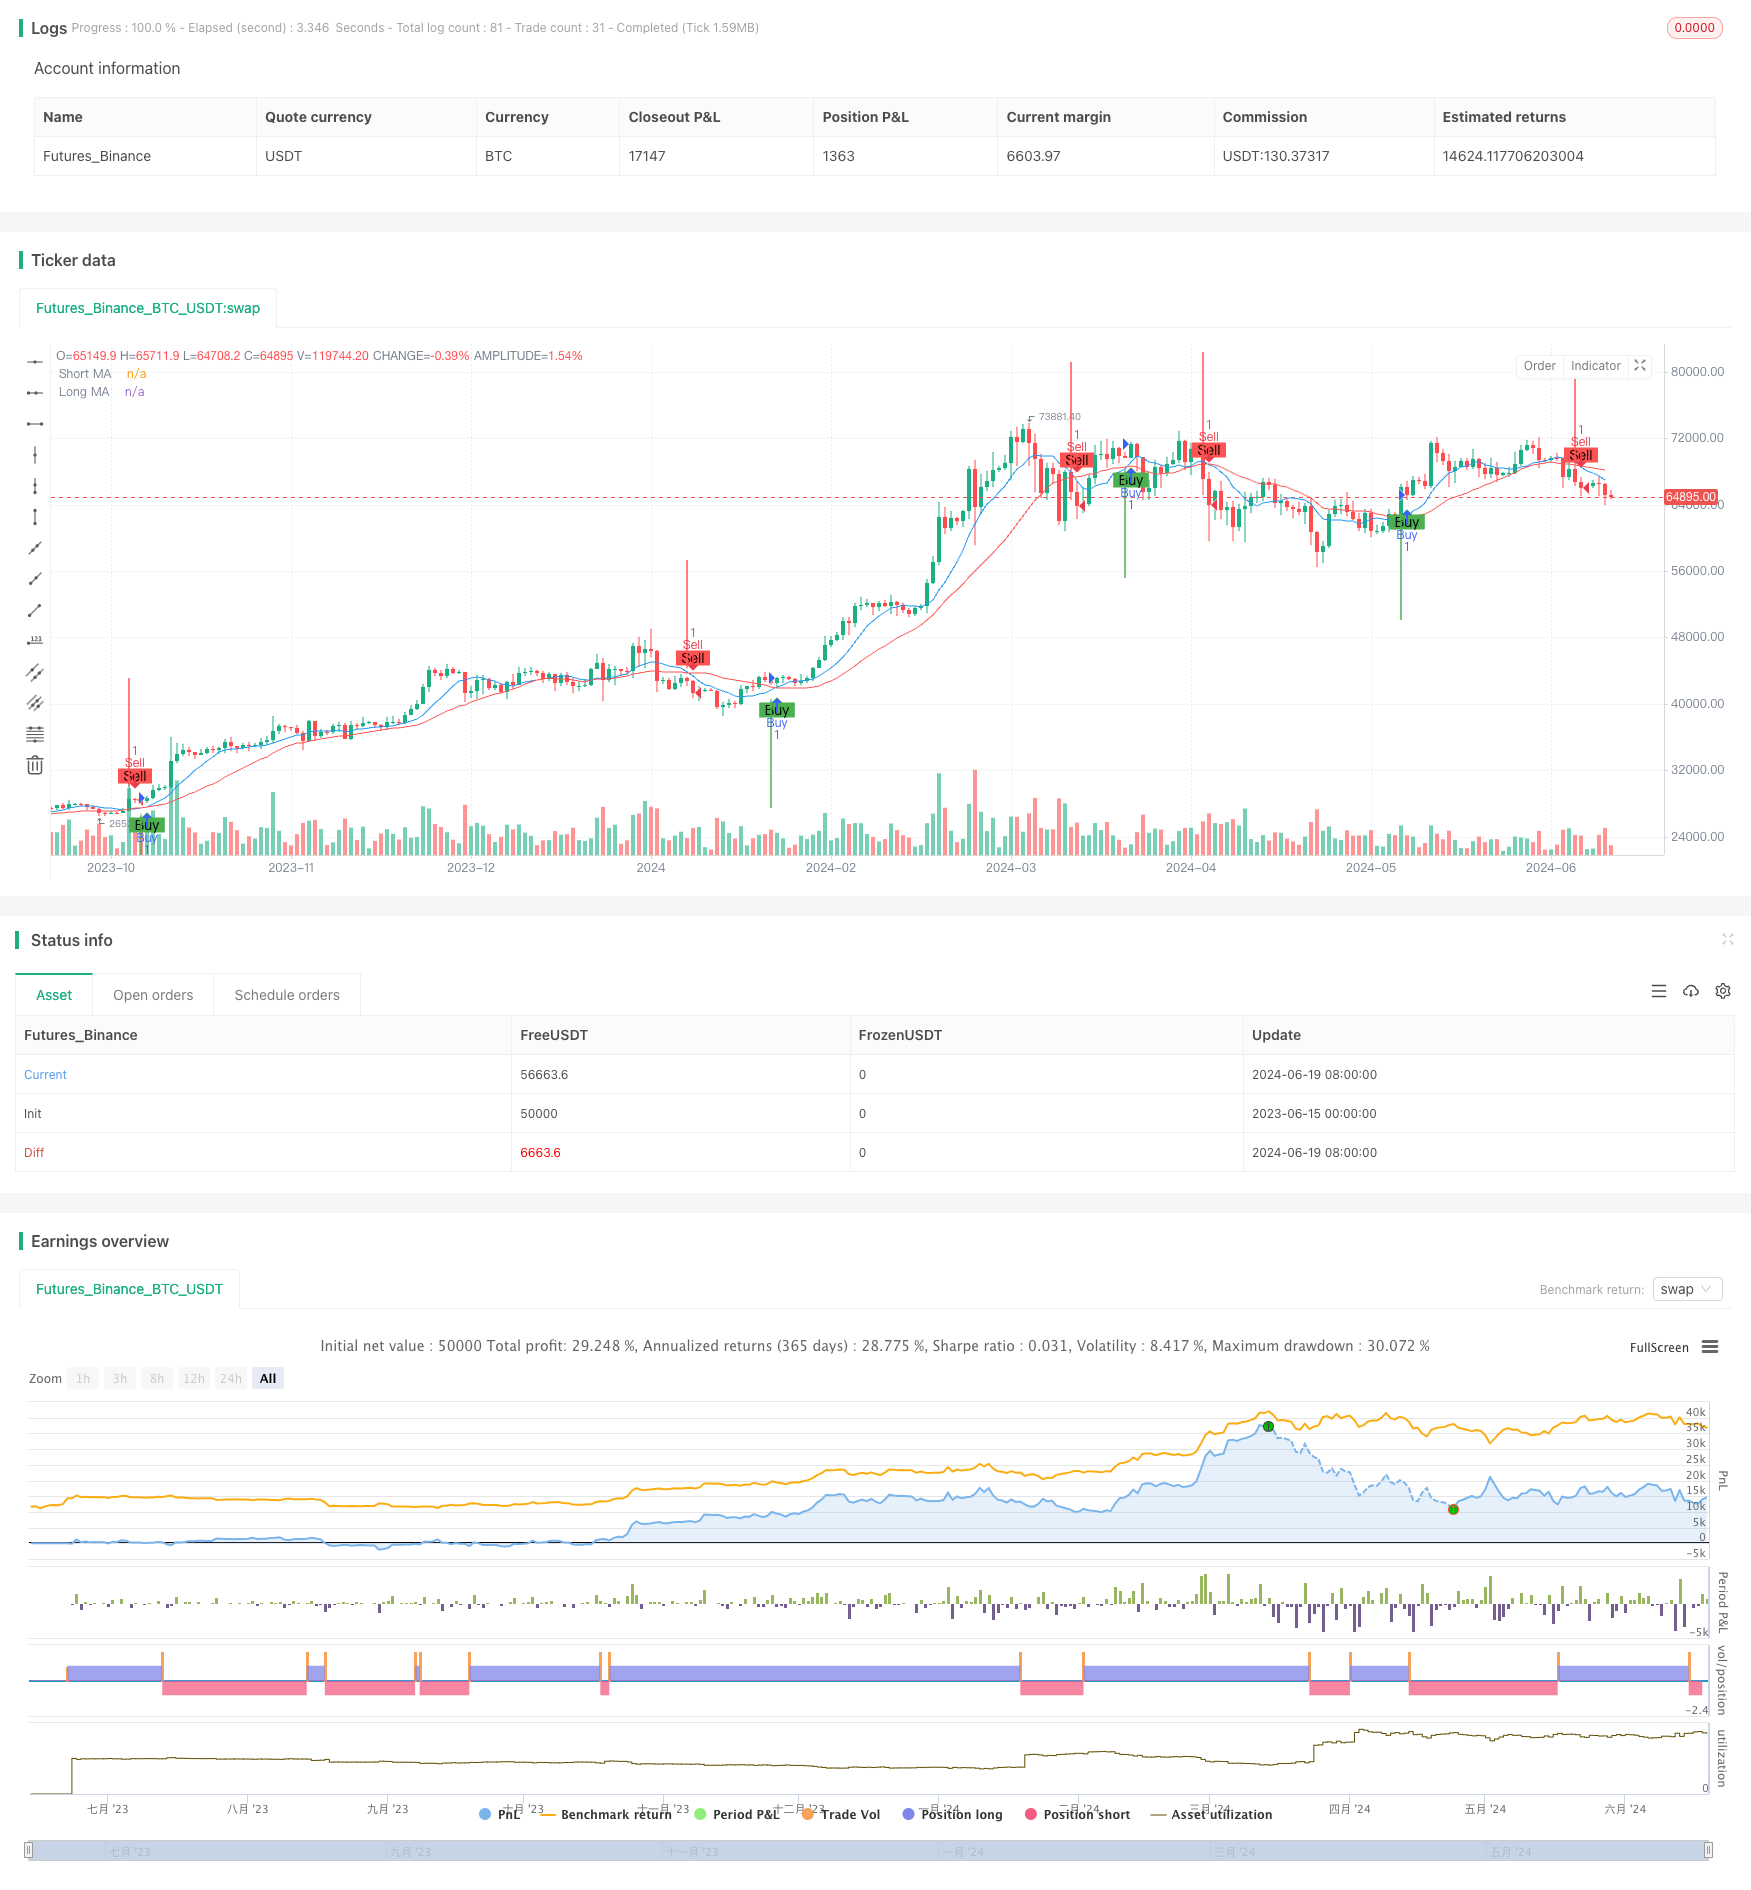
概述
本文介绍了一种基于机器学习的移动平均线交叉量化交易策略。该策略利用短期和长期简单移动平均线(SMA)的交叉来模拟机器学习的交易决策过程。通过对短期和长期移动平均线的交叉进行分析,策略生成买入和卖出信号,并在交易平台上执行相应的交易操作。这种方法结合了传统技术分析和现代机器学习概念,为交易者提供了一种简单而有效的量化交易工具。
策略原理
该策略的核心原理基于两条移动平均线的交叉: 1. 短期移动平均线(Short MA):默认使用9个周期的简单移动平均线。 2. 长期移动平均线(Long MA):默认使用21个周期的简单移动平均线。
交易信号生成逻辑如下: - 买入信号:当短期移动平均线从下方穿过长期移动平均线时触发。 - 卖出信号:当短期移动平均线从上方穿过长期移动平均线时触发。
策略在TradingView平台上实现,使用Pine Script语言编写。主要功能包括: 1. 计算并绘制短期和长期移动平均线。 2. 根据移动平均线交叉生成买入和卖出信号。 3. 在图表上标记买入和卖出点,使用绿色向上箭头表示买入,红色向下箭头表示卖出。 4. 设置交易提醒,当出现买入或卖出信号时通知用户。
策略优势
简单易懂:移动平均线交叉策略是一种经典的技术分析方法,容易理解和实施。
趋势跟踪:该策略能够有效捕捉市场趋势,在趋势明确的市场中表现良好。
自动化执行:策略可以在TradingView平台上自动执行,减少了人为干预和情绪化交易的影响。
视觉化反馈:通过在图表上标记买卖点和绘制移动平均线,交易者可以直观地了解策略的运作。
灵活性:用户可以根据个人偏好和市场特征调整短期和长期移动平均线的周期。
实时提醒:设置的交易提醒功能可以帮助交易者及时把握市场机会。
模拟机器学习:虽然是一个简单的策略,但它模拟了机器学习的决策过程,为更复杂的算法交易奠定了基础。
适用性广:该策略可以应用于多种金融工具和时间框架,具有广泛的适用性。
策略风险
滞后性:移动平均线本质上是滞后指标,可能导致在市场转折点附近出现假信号。
震荡市表现不佳:在横盘震荡的市场中,该策略可能频繁产生错误信号,导致过度交易和亏损。
没有止损机制:策略中未包含止损设置,可能在市场剧烈波动时承受较大损失。
过度依赖历史数据:策略假设历史模式会在未来重复,但市场条件可能发生变化。
参数敏感性:策略性能对移动平均线周期的选择较为敏感,不同的参数可能导致显著不同的结果。
忽略基本面因素:纯技术分析方法可能忽视重要的基本面和宏观经济因素。
交易成本:频繁的交易可能导致较高的交易成本,影响策略的整体收益。
过拟合风险:在优化参数时可能出现过拟合,导致策略在实盘交易中表现不佳。
策略优化方向
引入止损和止盈:设置合理的止损和止盈水平,以控制风险和锁定利润。
增加过滤器:结合其他技术指标(如RSI、MACD等)作为过滤器,减少假信号。
动态参数调整:根据市场波动性动态调整移动平均线周期,以适应不同的市场环境。
加入波动率指标:使用ATR等波动率指标来调整仓位大小和止损水平。
多时间框架分析:结合更长期的时间框架分析,提高交易决策的准确性。
加入基本面分析:结合基本面因素,如经济数据发布、公司财报等,优化交易决策。
机器学习优化:使用真正的机器学习算法(如支持向量机、随机森林等)来优化参数选择和信号生成。
回测和优化:进行广泛的历史数据回测,使用蒙特卡洛模拟等方法评估策略的稳健性。
资金管理:实现更复杂的资金管理策略,如凯利公式或固定比例风险模型。
情绪分析:整合市场情绪数据,如社交媒体情绪分析,以增强交易决策。
总结
基于机器学习的移动平均线交叉量化交易策略为交易者提供了一种简单而有效的自动化交易方法。通过模拟机器学习的决策过程,该策略能够捕捉市场趋势并自动执行交易。虽然存在一些固有的风险,如滞后性和在震荡市中的表现不佳,但通过适当的风险管理和持续优化,可以显著提高策略的性能。
未来的优化方向应该focus on提高策略的适应性和鲁棒性,包括引入更多的技术指标、动态参数调整、多时间框架分析以及真正的机器学习算法。同时,加入基本面分析和市场情绪因素也可以帮助策略更全面地评估市场状况。
总的来说,这种基于机器学习概念的量化交易策略为交易者提供了一个良好的起点,可以在此基础上不断改进和发展,最终达到更加智能和高效的交易系统。
/*backtest
start: 2023-06-15 00:00:00
end: 2024-06-20 00:00:00
period: 1d
basePeriod: 1h
exchanges: [{"eid":"Futures_Binance","currency":"BTC_USDT"}]
*/

// This Pine Script™ code is subject to the terms of the Mozilla Public License 2.0 at https://mozilla.org/MPL/2.0/
// © yashumani
//@version=5
strategy("ML Based Trading Strategy", overlay=true)

// Define input parameters
shortPeriod = input.int(9, title="Short MA Period")
longPeriod = input.int(21, title="Long MA Period")

// Calculate moving averages
shortMA = ta.sma(close, shortPeriod)
longMA = ta.sma(close, longPeriod)

// Simulated "machine learning" decision based on moving averages crossover
longCondition = ta.crossover(shortMA, longMA)
shortCondition = ta.crossunder(shortMA, longMA)

// Plot moving averages
plot(shortMA, color=color.blue, title="Short MA")
plot(longMA, color=color.red, title="Long MA")

// Buy signal
if (longCondition)
    strategy.entry("Buy", strategy.long)

// Sell signal
if (shortCondition)
    strategy.entry("Sell", strategy.short)

// Plot buy/sell indicators on chart
plotshape(series=longCondition, location=location.belowbar, color=color.green, style=shape.labelup, text="Buy")
plotshape(series=shortCondition, location=location.abovebar, color=color.red, style=shape.labeldown, text="Sell")

// Define and plot order indicators
plotarrow(series=longCondition ? 1 : shortCondition ? -1 : na, colorup=color.green, colordown=color.red, offset=-1)

// Alerts
if (longCondition)
    alert("Buy signal triggered", alert.freq_once_per_bar)

if (shortCondition)
    alert("Sell signal triggered", alert.freq_once_per_bar)
- 均线,简单移动平均线,均线斜率,追踪止损,重新进场
- 机器学习启发的双均线RSI交易策略
- 动态均线交叉趋势跟踪策略结合ATR风险管理系统
- 双均线交叉自适应参数择时交易策略
- 移动平均交叉策略
- SMA双均线交易策略
- 移动平均线交叉策略
- 基于多均线的趋势交易策略
- 趋势捕捉策略
- 基于双均线交叉的移动平均线策略
- 基于布林带和分形突破的动态转折点策略
- 高级RSI背离与均线组合的量化交易策略
- EMA/SMA多指标综合趋势跟踪策略
- 测试策略交互控件
- 测试策略界面参数
- 布林带均值回归交易策略与成交量过滤
- 多指标高杠杆短线交易策略
- 多指标组合趋势跟踪策略
- 多周期斐波那契RSI黄金交叉趋势跟踪量化交易策略
- 动态止损止盈的双均线趋势跟踪与蜡烛图反应策略
- RSI与随机指标融合交叉策略
- 多重指数移动平均线交叉趋势跟踪策略
- 动态波动趋势捕捉策略
- VAWSI和趋势持续性反转策略结合动态长度计算的多指标综合分析系统
- 动态通道百分比包络策略
- SuperTrend策略优化:动态波动率跟踪与交易信号增强系统
- 机器学习启发的双均线RSI交易策略
- 多指标组合的高频交易策略:指数均线与动量指标相结合的短线交易系统
- 三标准差动量反转交易策略
- 多周期指数移动平均交叉策略与期权交易建议系统