概述
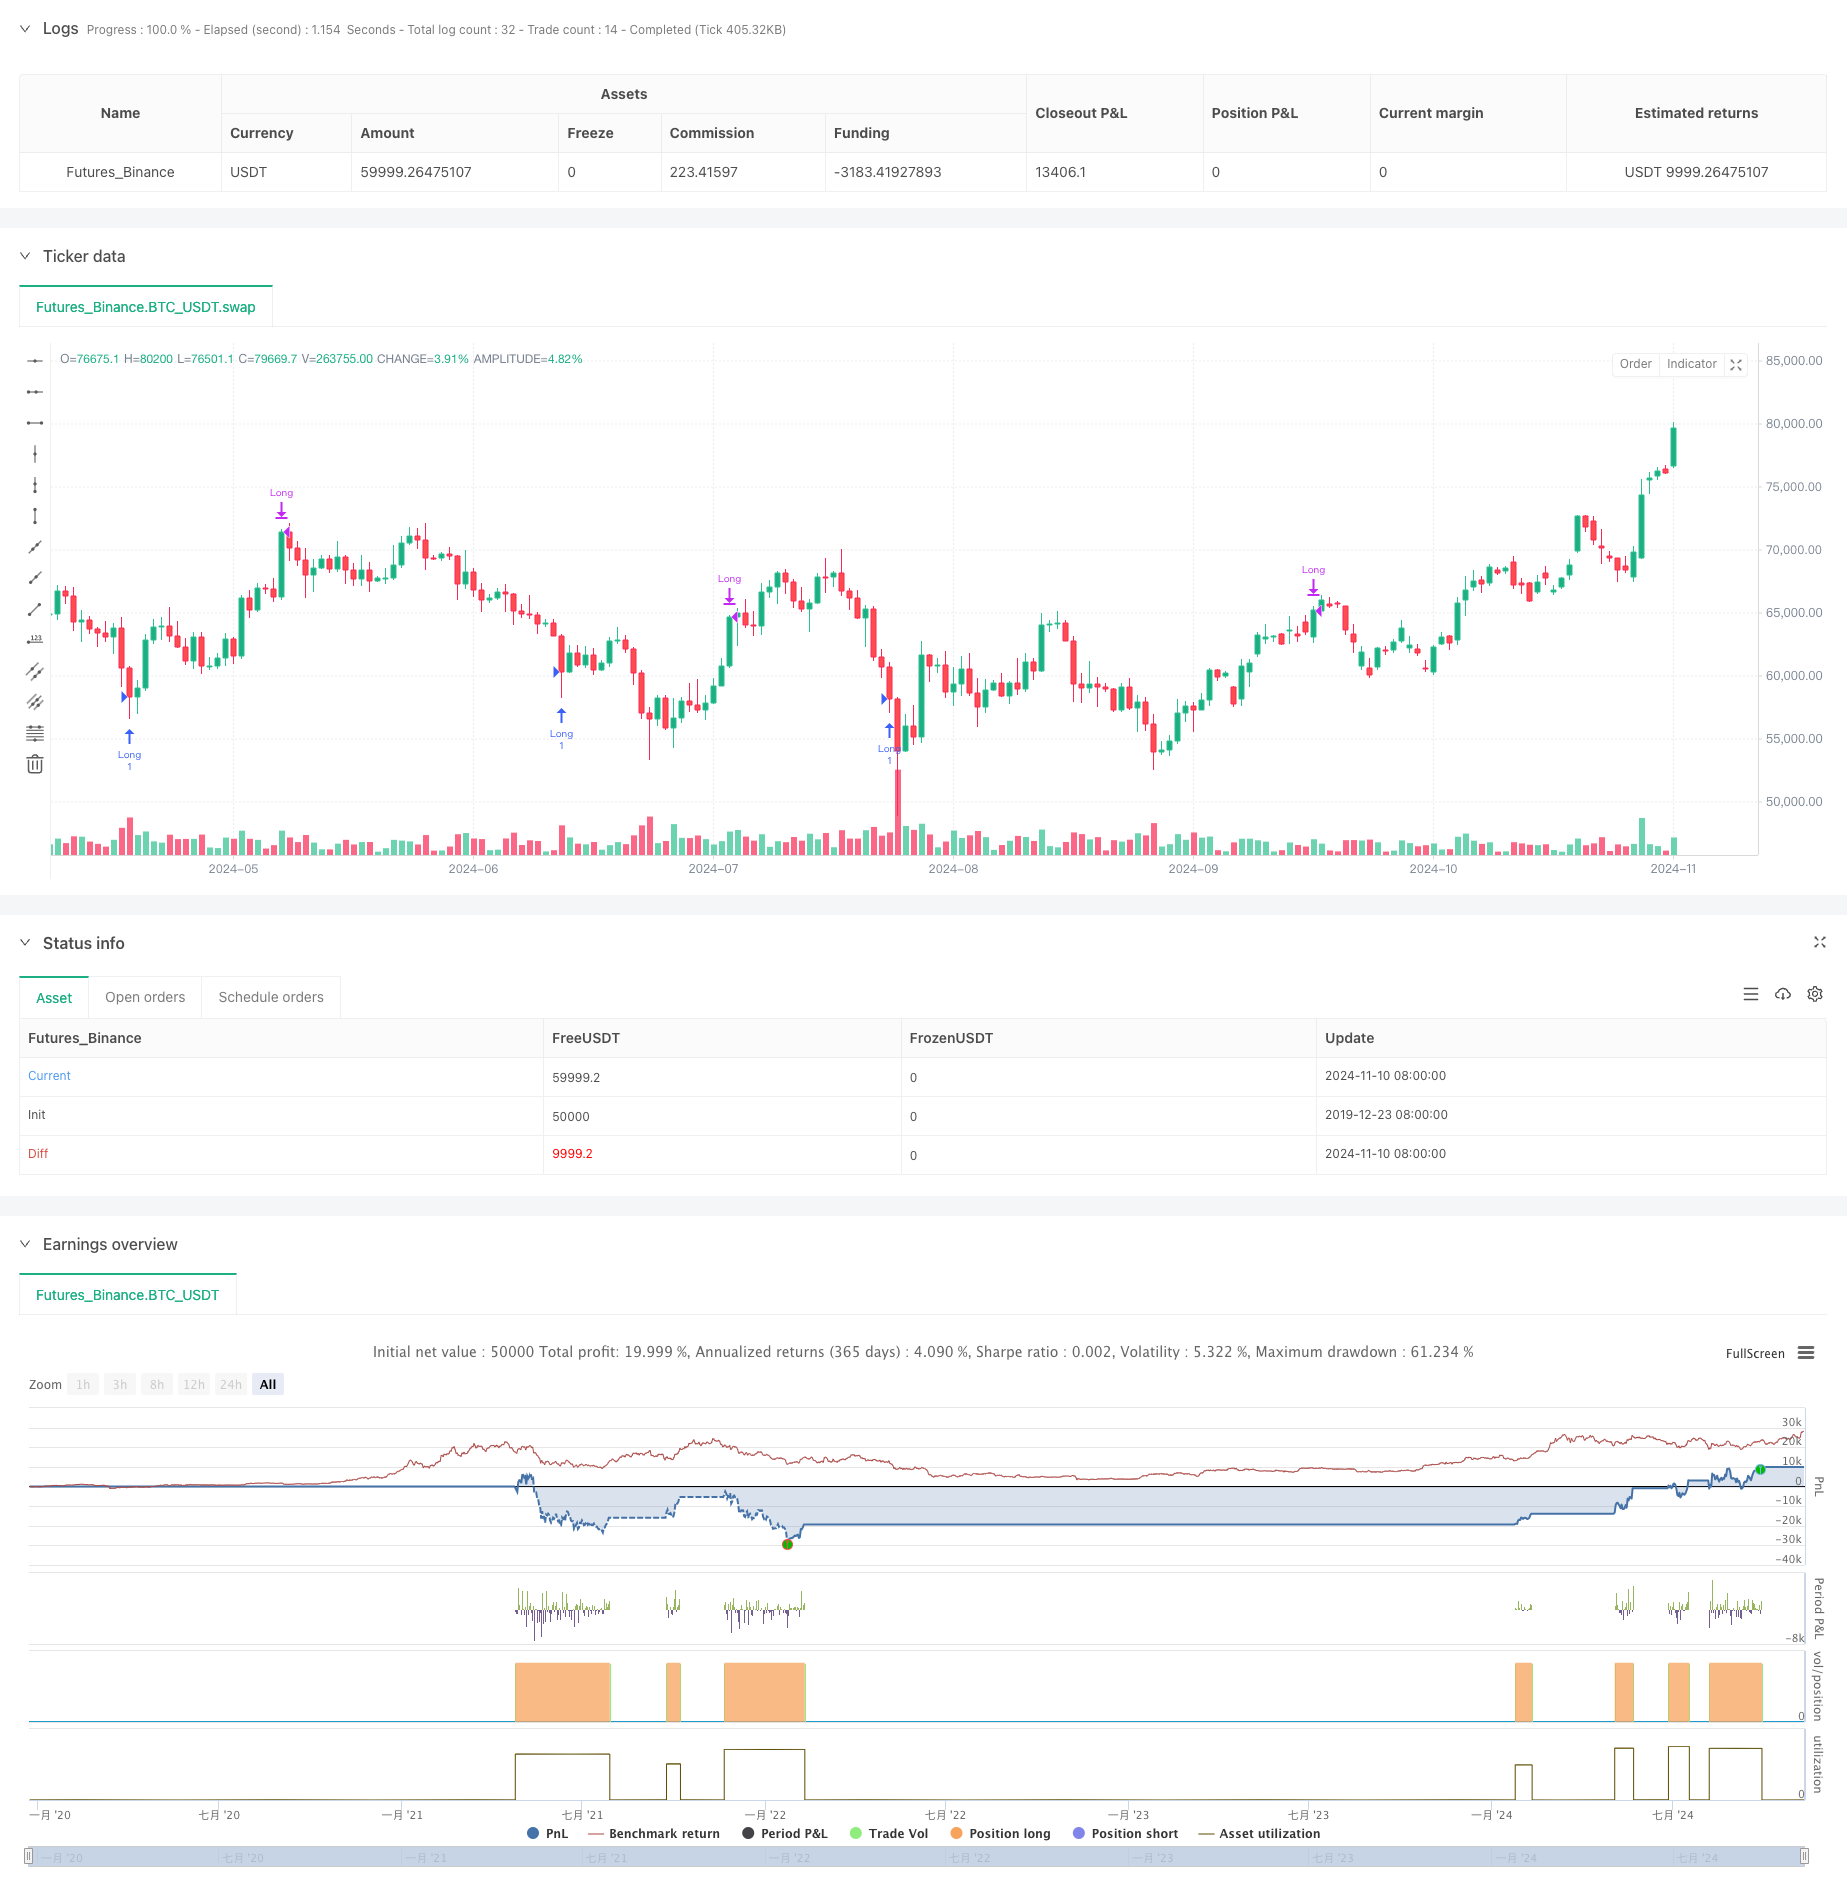
本策略是一个基于布林带、RSI指标和移动平均线的综合交易系统。策略通过布林带的价格波动范围、RSI超买超卖水平以及EMA趋势过滤来识别潜在的交易机会。系统支持做多和做空交易,并提供了多种退出机制来保护资金安全。
策略原理
策略主要基于以下几个核心组件: 1. 使用1.8倍标准差的布林带来确定价格波动区间 2. 采用7周期RSI指标判断超买超卖 3. 可选的500周期EMA作为趋势过滤器 4. 入场条件: - 做多:RSI低于25且价格突破布林带下轨 - 做空:RSI高于75且价格突破布林带上轨 5. 退出方式支持RSI阈值或布林带反向突破 6. 可选的百分比止损保护
策略优势
- 多重技术指标的协同配合提高了信号可靠性
- 灵活的参数设置允许根据不同市场情况进行调整
- 支持双向交易,充分把握市场机会
- 提供多种退出机制以适应不同交易风格
- 趋势过滤功能有效降低假信号
- 止损机制提供了良好的风险控制
策略风险
- 在震荡市场中可能产生频繁的假信号
- 多重指标可能导致信号滞后
- 固定的RSI阈值在不同市场环境下可能不够灵活
- 布林带参数需要根据市场波动率调整
- 止损设置可能在剧烈波动时被轻易触发
策略优化方向
- 引入自适应的布林带乘数,根据市场波动率动态调整
- 增加成交量指标作为辅助确认
- 考虑添加时间过滤,避免特定时段的交易
- 开发动态的RSI阈值系统
- 整合更多的趋势确认指标
- 优化止损机制,考虑使用动态止损
总结
这是一个设计完善的量化交易策略,通过多重技术指标的配合来捕捉市场机会。策略的可配置性强,能够适应不同的交易需求。虽然存在一些固有风险,但通过参数优化和增加辅助指标可以进一步提升其稳定性和可靠性。对于寻求系统化交易方法的投资者来说,这是一个值得参考的策略框架。
策略源码
/*backtest
start: 2019-12-23 08:00:00
end: 2024-11-11 00:00:00
period: 1d
basePeriod: 1d
exchanges: [{"eid":"Futures_Binance","currency":"BTC_USDT"}]
*/

//@version=5
strategy("Bollinger Bands Scalp Pro", overlay=true)

// Inputs for the strategy
length = input(20, title="Bollinger Band Length")
src = input(close, title="Source")
mult = input(1.8, title="Bollinger Band Multiplier")
rsiLength = input(7, title="RSI Length")
rsiOverbought = input(75, title="RSI Overbought Level")
rsiOversold = input(25, title="RSI Oversold Level")

// Custom RSI exit points
rsiExitLong = input(75, title="RSI Exit for Long (Overbought)")
rsiExitShort = input(25, title="RSI Exit for Short (Oversold)")

// Moving Average Inputs
emaLength = input(500, title="EMA Length")
enableEMAFilter = input.bool(true, title="Enable EMA Filter")

// Exit method: Choose between 'RSI' and 'Bollinger Bands'
exitMethod = input.string("RSI", title="Exit Method", options=["RSI", "Bollinger Bands"])

// Enable/Disable Long and Short trades
enableLong = input.bool(true, title="Enable Long Trades")
enableShort = input.bool(false, title="Enable Short Trades")

// Enable/Disable Stop Loss
enableStopLoss = input.bool(false, title="Enable Stop Loss")
stopLossPercent = input.float(1.0, title="Stop Loss Percentage (%)", minval=0.1) / 100

// Bollinger Bands calculation
basis = ta.sma(src, length)
dev = mult * ta.stdev(src, length)
upperBB = basis + dev
lowerBB = basis - dev

// RSI calculation
rsi = ta.rsi(src, rsiLength)

// 200 EMA to filter trades (calculated but only used if enabled)
ema200 = ta.ema(src, emaLength)

// Long condition: RSI below oversold, price closes below the lower Bollinger Band, and optionally price is above the 200 EMA
longCondition = enableLong and (rsi < rsiOversold) and (close < lowerBB) and (not enableEMAFilter or close > ema200)
if (longCondition)
    strategy.entry("Long", strategy.long)

// Short condition: RSI above overbought, price closes above the upper Bollinger Band, and optionally price is below the 200 EMA
shortCondition = enableShort and (rsi > rsiOverbought) and (close > upperBB) and (not enableEMAFilter or close < ema200)
if (shortCondition)
    strategy.entry("Short", strategy.short)

// Stop Loss setup
if (enableStopLoss)
    strategy.exit("Long Exit", "Long", stop = strategy.position_avg_price * (1 - stopLossPercent))
    strategy.exit("Short Exit", "Short", stop = strategy.position_avg_price * (1 + stopLossPercent))

// Exit conditions based on the user's choice of exit method
if (exitMethod == "RSI")
    // Exit based on RSI
    exitLongCondition = rsi >= rsiExitLong
    if (exitLongCondition)
        strategy.close("Long")

    exitShortCondition = rsi <= rsiExitShort
    if (exitShortCondition)
        strategy.close("Short")
else if (exitMethod == "Bollinger Bands")
    // Exit based on Bollinger Bands
    exitLongConditionBB = close >= upperBB
    if (exitLongConditionBB)
        strategy.close("Long")

    exitShortConditionBB = close <= lowerBB
    if (exitShortConditionBB)
        strategy.close("Short")
相关推荐