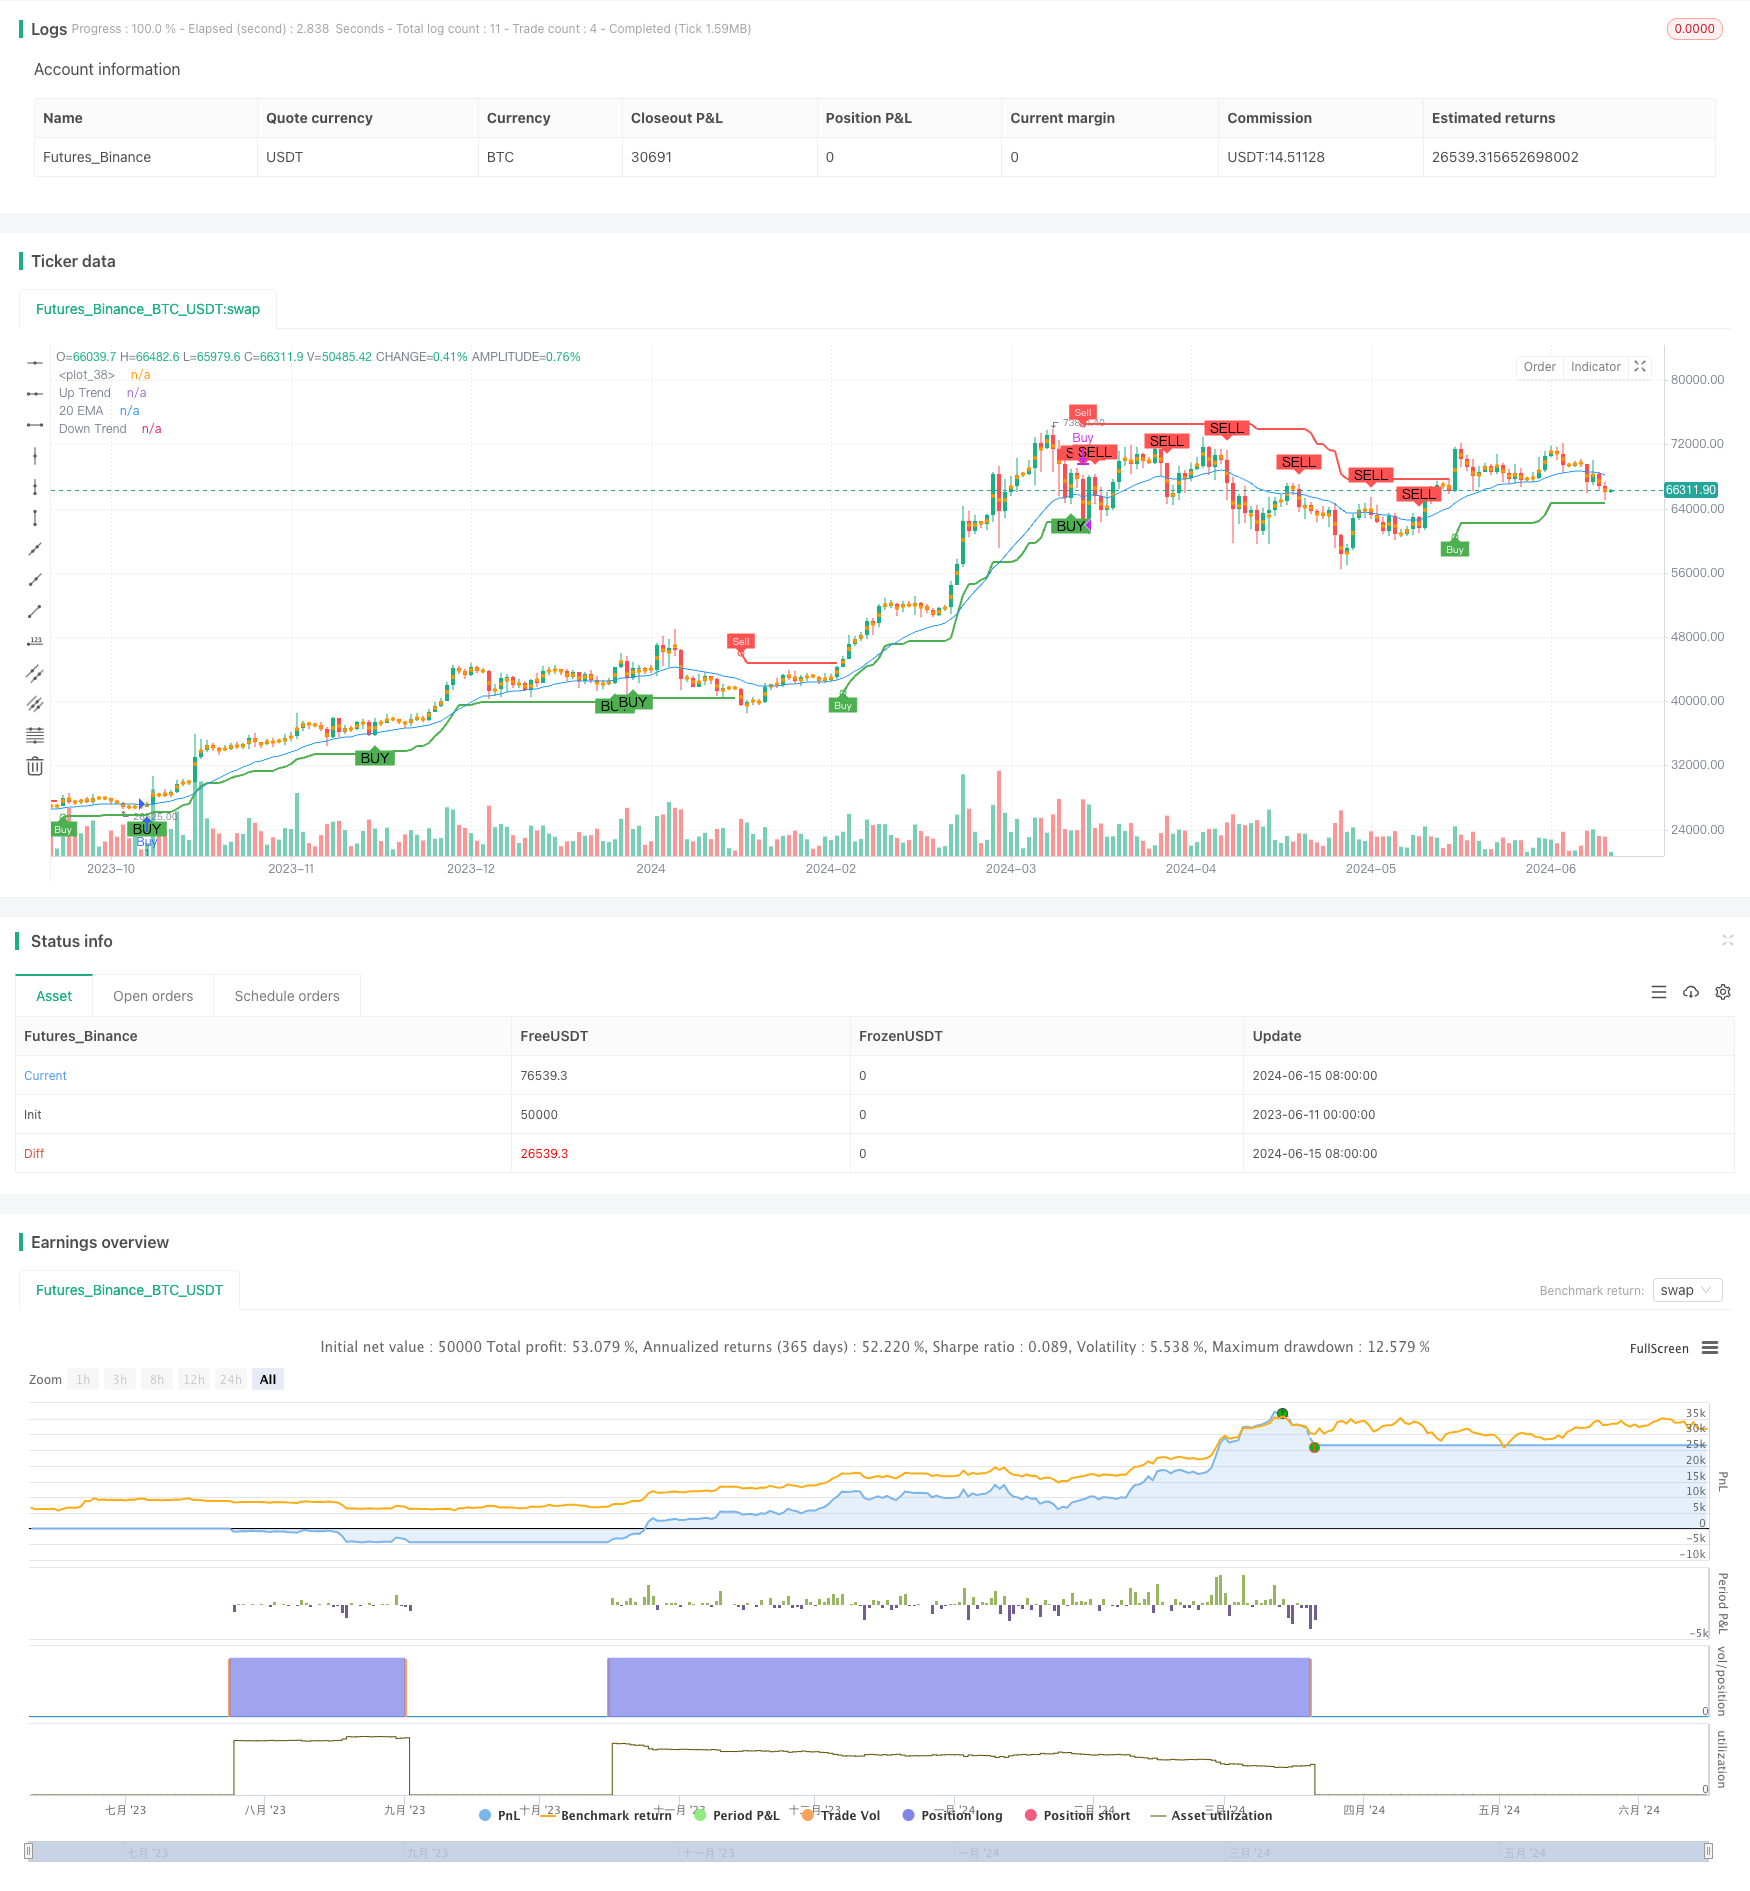
EMA এবং সুপার ট্রেন্ডের সমন্বয়ে পরিমাণগত ট্রেডিং কৌশল
EMA
ওভারভিউ
এই কৌশলটি সূচকীয় মুভিং এভারেজ (ইএমএ) এবং সুপারট্রেন্ড সূচক (সুপারট্রেন্ড) সংযুক্ত করে একটি ক্রয়-বিক্রয় সংকেত উত্পন্ন করে। যখন দাম 20 দিনের ইএমএ অতিক্রম করে এবং সুপারট্রেন্ড সূচকটি বিউটি ট্রেন্ডে থাকে, তখন একটি ক্রয়-বিক্রয় সংকেত উত্পন্ন হয়। যখন দাম 20 দিনের ইএমএ অতিক্রম করে এবং সুপারট্রেন্ড সূচকটি বিউটি ট্রেন্ডে থাকে, তখন একটি বিক্রয়-বিক্রয় সংকেত উত্পন্ন হয়। এই কৌশলটি প্রবণতাবাদী পরিস্থিতি ক্যাপচার করার জন্য তৈরি করা হয়েছে, একই সাথে মিথ্যা সংকেত হ্রাস করার জন্য ফিল্টার শর্ত হিসাবে ইএমএ ব্যবহার করে।
কৌশল নীতি
- ২০ দিনের ইএমএ প্রবণতা নির্ধারণের জন্য ফিল্টার করা হয়েছে।
- সুপার ট্রেন্ডিং সূচক গণনা করা হয়, যা গড় বাস্তব পরিসীমা (ATR) এবং বহুমুখী প্রবণতার উপর ভিত্তি করে ট্রেল আপ এবং ডাউন ম্যাপ করে।
- সুপারট্রেন্ডিং সূচকের প্রবণতা দিক এবং দামের 20 তম ইএমএর সাথে সম্পর্কিত অবস্থানের উপর ভিত্তি করে একটি বিক্রয়-বিক্রয় সংকেত তৈরি করুনঃ
- যখন দাম 20 দিনের ইএমএ অতিক্রম করে এবং সুপার ট্রেন্ড সূচকটি মুদ্রাস্ফীতির প্রবণতায় থাকে তখন একটি ক্রয় সংকেত দেওয়া হয়।
- যখন দাম 20 দিনের ইএমএর নিচে থেকে পড়ে এবং সুপার ট্রেন্ড সূচকটি বিপরীতমুখী হয়, তখন একটি বিক্রয় সংকেত দেওয়া হয়।
- কৌশলটি হল ক্রয় সংকেত অনুসারে পজিশন খোলা এবং বিক্রয় সংকেত অনুসারে পজিশন বন্ধ করা।
কৌশলগত সুবিধা
- ইএমএ এবং সুপার ট্রেন্ডিং সূচকগুলির সাথে মিলিত, এটি কার্যকরভাবে প্রবণতা ক্যাপচার করে এবং মিথ্যা সংকেত হ্রাস করে।
- সুপার ট্রেন্ডিং সূচকটি এটিআর-ভিত্তিক, যা বিভিন্ন বাজারের ওঠানামার সাথে সামঞ্জস্য রেখে গতিশীলভাবে আপ-ডাউন ট্র্যাকের দূরত্ব সামঞ্জস্য করতে পারে।
- EMA ট্রেন্ডের জন্য একটি ফিল্টার হিসেবে কাজ করে, যা ট্রেন্ডের দিকনির্দেশনা অনুযায়ী পজিশনে প্রবেশের নিশ্চয়তা দেয় এবং কৌশলটির সাফল্যের হার বাড়ায়।
- এই কৌশলটি সহজ, সহজে বোঝা যায় এবং বাস্তবায়িত হয়।
কৌশলগত ঝুঁকি
- বাজারের অস্থিরতার মধ্যে, এই কৌশলটি প্রায়শই ক্রয়-বিক্রয় সংকেত তৈরি করতে পারে, যার ফলে প্রচুর লেনদেন হয় এবং কমিশন ক্ষতি হয়।
- কৌশলটি ইএমএ এবং সুপারট্রেন্ড সূচকগুলির উপর নির্ভর করে, যা কিছু বাজার অবস্থার অধীনে অকার্যকর বা পিছিয়ে থাকতে পারে।
- কৌশলটি ঝুঁকি ব্যবস্থাপনা যেমন স্টপ লস এবং পজিশন ম্যানেজমেন্টকে বিবেচনা করে না, যা বাজারের তীব্র অস্থিরতার সময় বৃহত্তর প্রত্যাহারের কারণ হতে পারে।
কৌশল অপ্টিমাইজেশনের দিকনির্দেশনা
- একটি স্টপ-অফ ব্যবস্থা যোগ করুন, যেমন একটি একক লেনদেনের সর্বাধিক ক্ষতি নিয়ন্ত্রণের জন্য এটিআর-এর অধীনে গতিশীল স্টপ-অফ সেট করুন।
- প্যারামিটার অপ্টিমাইজেশান ইএমএ এবং সুপার ট্রেন্ডিং সূচক, যেমন প্যারামিটার অপ্টিমাইজেশান পদ্ধতি ব্যবহার করে সর্বোত্তম প্যারামিটার সমন্বয় খুঁজে বের করা, কৌশলটির অভিযোজনযোগ্যতা এবং স্থায়িত্ব বাড়ানো।
- পজিশন ম্যানেজমেন্ট চালু করুন, সামগ্রিক ঝুঁকি নিয়ন্ত্রণের জন্য পজিশনের আকারটি বাজারের ওঠানামা বা অ্যাকাউন্টের ক্ষতির উপর নির্ভর করে গতিশীলভাবে সামঞ্জস্য করুন।
- অন্যান্য ফিল্টারিং শর্ত যেমন লেনদেনের পরিমাণ, ওঠানামা ইত্যাদি যোগ করার বিষয়টি বিবেচনা করুন যাতে ভুয়া সংকেত আরও কমিয়ে আনা যায়।
সারসংক্ষেপ
এই কৌশলটি 20 দিনের ইএমএ এবং সুপার ট্রেন্ডিং সূচকগুলির সাথে মিলিত হয়ে একটি বিক্রয়-বিক্রয় সংকেত তৈরি করে, যা প্রবণতাযুক্ত আচরণগুলি ধরার জন্য তৈরি করা হয়েছে। কৌশলটির সুবিধা হল যে এটি যুক্তিযুক্তভাবে সহজ, ইএমএ এবং সুপার ট্রেন্ডিং সূচকগুলির সাথে মিলিত হওয়া কার্যকরভাবে মিথ্যা সংকেতগুলি হ্রাস করতে পারে। তবে বাজারের ঝড়ের সময় কৌশলটি ঘন ঘন ট্রেড করতে পারে এবং ঝুঁকি ব্যবস্থাপনার অভাব রয়েছে। ভবিষ্যতে কৌশলটি উন্নত করার জন্য স্টপ লস, পজিশন ম্যানেজমেন্ট এবং প্যারামিটার অপ্টিমাইজেশনের মতো পদ্ধতিগুলি বিবেচনা করা যেতে পারে। সামগ্রিকভাবে, কৌশলটি প্রবণতা ট্রেডিংয়ের জন্য একটি সহজ এবং কার্যকর চিন্তাভাবনা সরবরাহ করে, তবে বাস্তব প্রয়োগে আরও অপ্টিমাইজেশন এবং পরিমার্জনের প্রয়োজন রয়েছে।
/*backtest
start: 2023-06-11 00:00:00
end: 2024-06-16 00:00:00
period: 1d
basePeriod: 1h
exchanges: [{"eid":"Futures_Binance","currency":"BTC_USDT"}]
*/

//@version=5
strategy("20 EMA and Supertrend Strategy", overlay=true)

// Inputs
emaLength = input(20, title="EMA Length")
supertrendMultiplier = input.float(3.0, title="Supertrend Multiplier")
supertrendPeriod = input(10, title="Supertrend Period")

// EMA Calculation
ema = ta.ema(close, emaLength)

// Supertrend Calculation
Periods = supertrendPeriod
src = hl2
Multiplier = supertrendMultiplier
changeATR= input.bool(true, title="Change ATR Calculation Method?")
showsignals = input.bool(true, title="Show Buy/Sell Signals?")
highlighting = input.bool(true, title="Highlighter On/Off?")
atr2 = ta.sma(ta.tr, Periods)
atr = changeATR ? ta.atr(Periods) : atr2
up = src - (Multiplier * atr)
up1 = na(up[1]) ? up : up[1]
up := close[1] > up1 ? math.max(up, up1) : up
dn = src + (Multiplier * atr)
dn1 = na(dn[1]) ? dn : dn[1]
dn := close[1] < dn1 ? math.min(dn, dn1) : dn
trend = 1
trend := na(trend[1]) ? trend : trend[1]
trend := trend == -1 and close > dn1 ? 1 : trend == 1 and close < up1 ? -1 : trend
upPlot = plot(trend == 1 ? up : na, title="Up Trend", style=plot.style_linebr, linewidth=2, color=color.green)
buySignal = trend == 1 and trend[1] == -1
plotshape(series=buySignal ? up : na, title="UpTrend Begins", location=location.absolute, style=shape.circle, size=size.tiny, color=color.new(color.green, 0))
plotshape(series=buySignal and showsignals ? up : na, title="Buy", text="Buy", location=location.absolute, style=shape.labelup, size=size.tiny, color=color.new(color.green, 0), textcolor=color.white)
dnPlot = plot(trend == 1 ? na : dn, title="Down Trend", style=plot.style_linebr, linewidth=2, color=color.red)
sellSignal = trend == -1 and trend[1] == 1
plotshape(series=sellSignal ? dn : na, title="DownTrend Begins", location=location.absolute, style=shape.circle, size=size.tiny, color=color.new(color.red, 0))
plotshape(series=sellSignal and showsignals ? dn : na, title="Sell", text="Sell", location=location.absolute, style=shape.labeldown, size=size.tiny, color=color.new(color.red, 0), textcolor=color.white)
mPlot = plot(ohlc4, title="", style=plot.style_circles, linewidth=1)
longFillColor = highlighting ? (trend == 1 ? color.new(color.green, 90) : color.new(color.white, 0)) : color.new(color.white, 0)
shortFillColor = highlighting ? (trend == -1 ? color.new(color.red, 90) : color.new(color.white, 0)) : color.new(color.white, 0)
fill(mPlot, upPlot, title="UpTrend Highlighter", color=longFillColor)
fill(mPlot, dnPlot, title="DownTrend Highlighter", color=shortFillColor)
alertcondition(buySignal, title="SuperTrend Buy", message="SuperTrend Buy!")
alertcondition(sellSignal, title="SuperTrend Sell", message="SuperTrend Sell!")
changeCond = trend != trend[1]
alertcondition(changeCond, title="SuperTrend Direction Change", message="SuperTrend has changed direction!")

// Buy and Sell Signals based on EMA and Supertrend
buySignalEMA = ta.crossover(close, ema) and trend == 1
sellSignalEMA = ta.crossunder(close, ema) and trend == -1

// Plot EMA
plot(ema, color=color.blue, title="20 EMA")

// Plot Buy and Sell Signals
plotshape(series=buySignalEMA, location=location.belowbar, color=color.green, style=shape.labelup, title="Buy Signal", text="BUY")
plotshape(series=sellSignalEMA, location=location.abovebar, color=color.red, style=shape.labeldown, title="Sell Signal", text="SELL")

// Strategy Entries and Exits
if (buySignalEMA)
    strategy.entry("Buy", strategy.long)

if (sellSignalEMA)
    strategy.close("Buy")