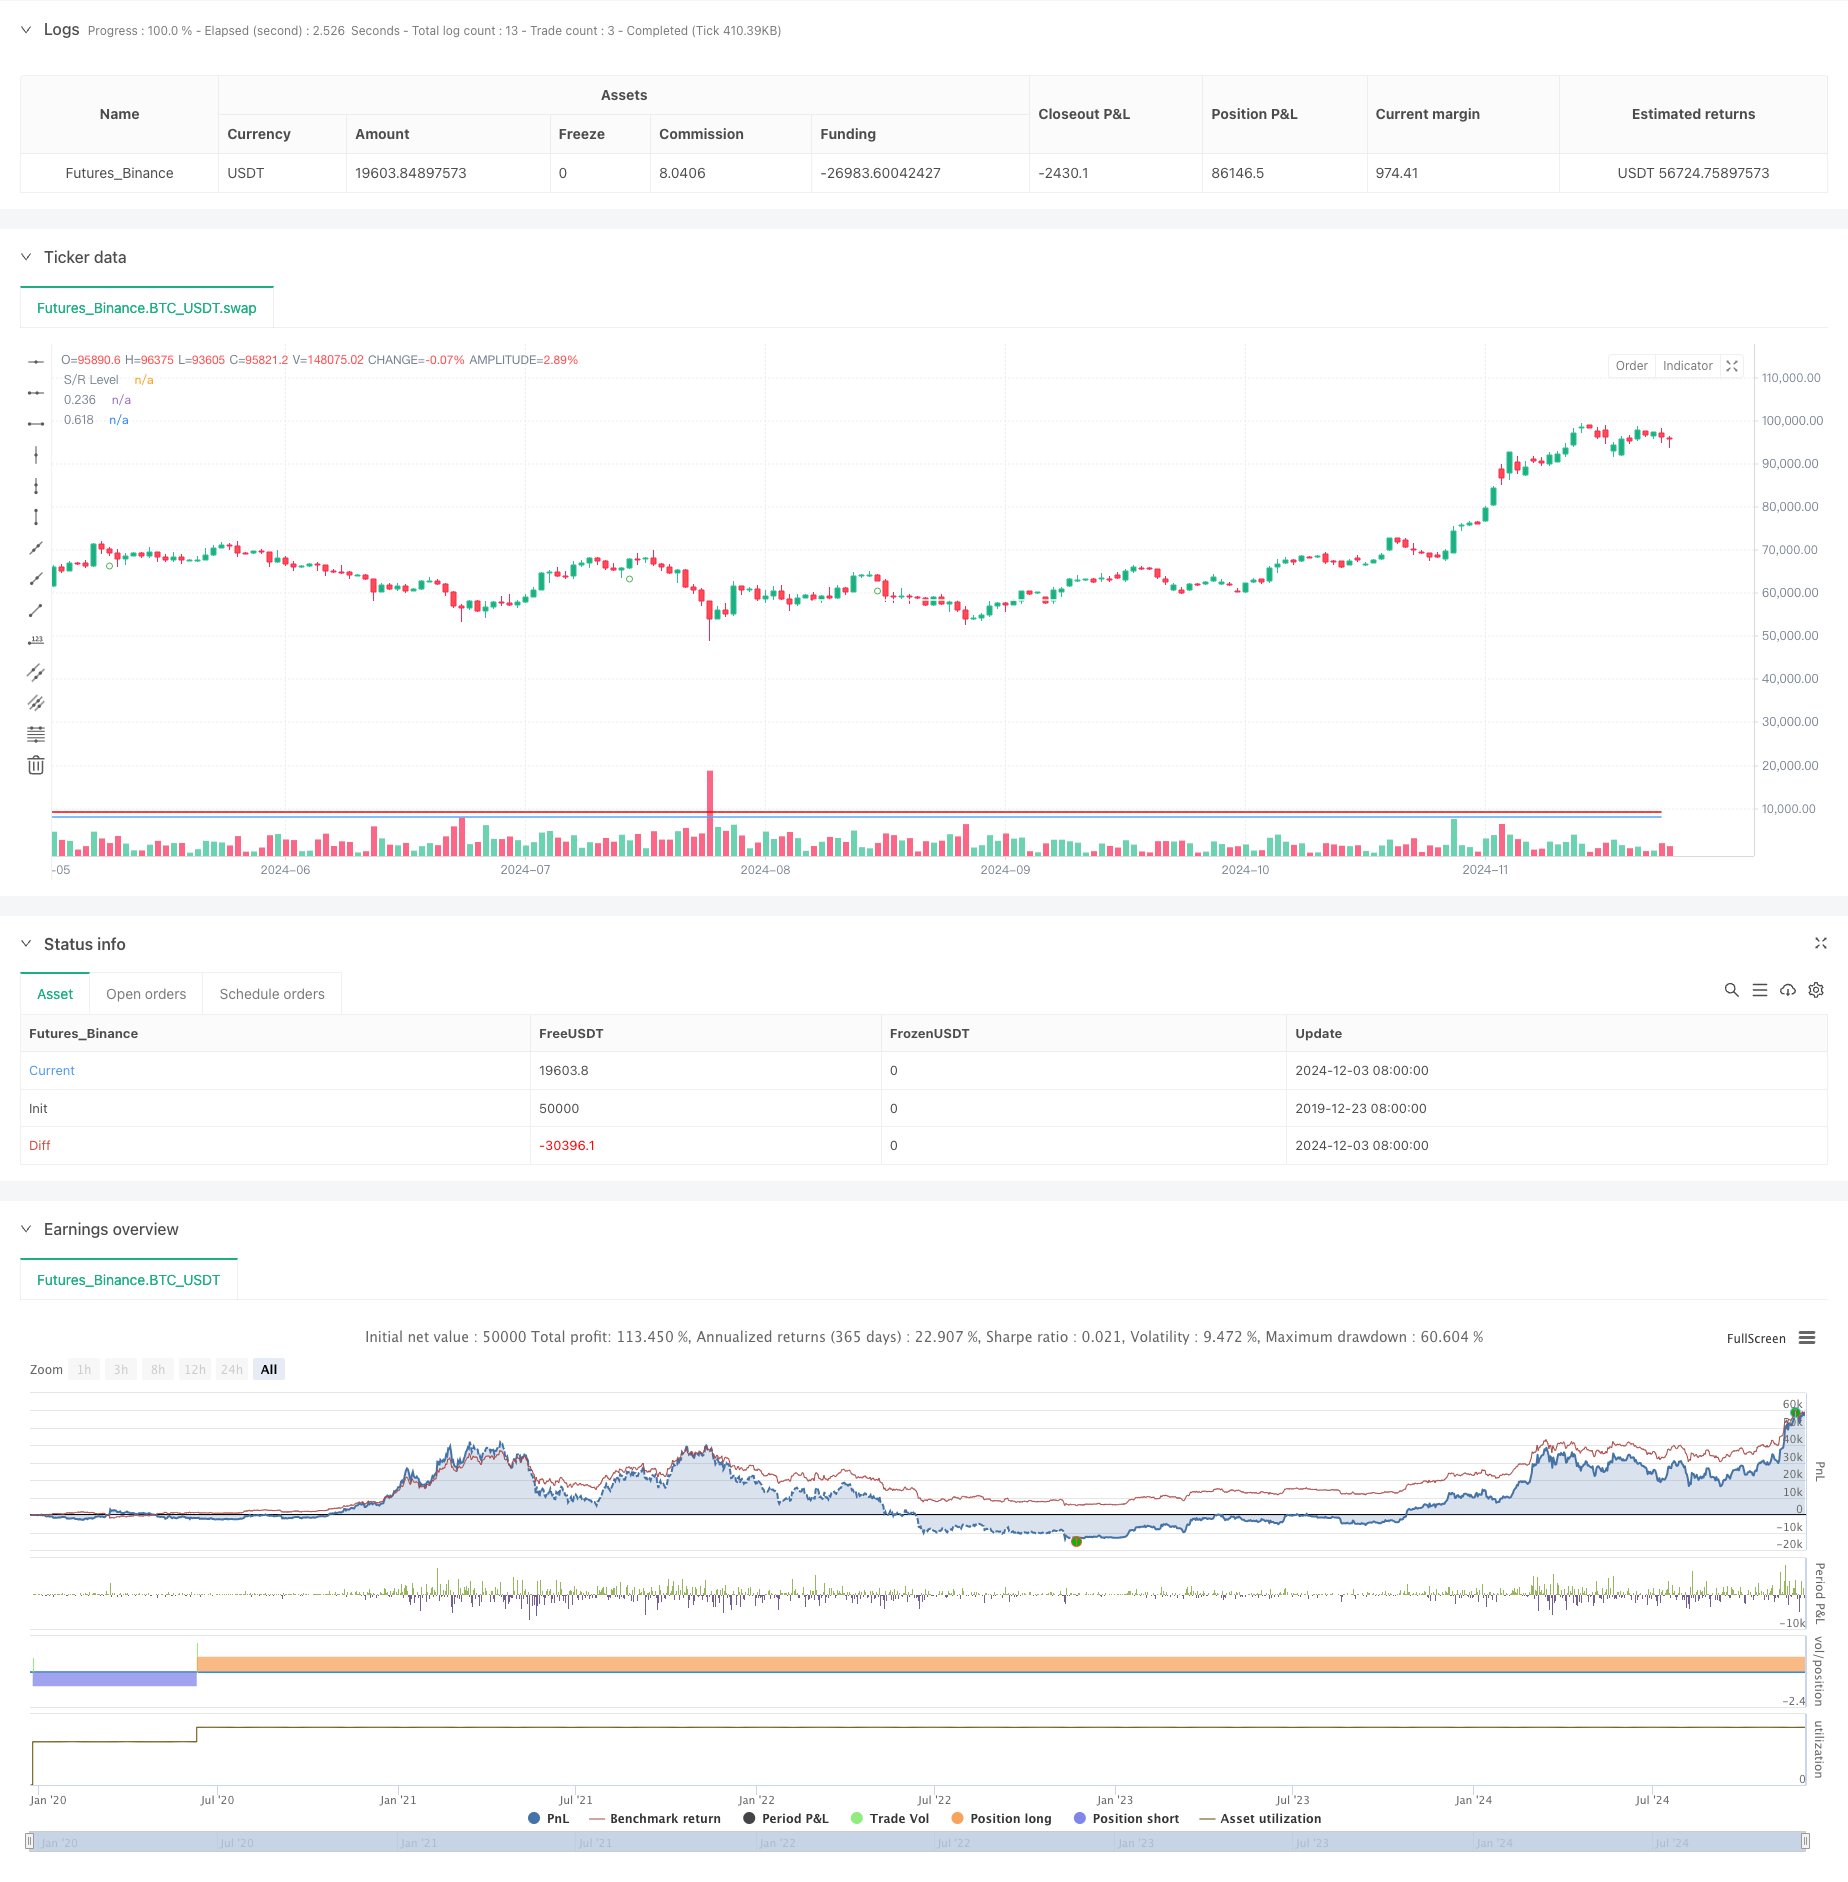
Überblick
Es ist ein Strategiesystem, das die Identifizierung von Multi-Technik-Analysemodellen und die Unterstützung von Widerstandsebenen kombiniert. Die Strategie wird hauptsächlich durch die Identifizierung von Doppel-Boden-Modellen (Adam und Eva-Boden-Modellen) in Verbindung mit den Fibonacci-Rückschlägen und der Unterstützung von Widerstandslinien für Handelsentscheidungen getroffen. Im Mittelpunkt der Strategie steht die Verbesserung der Reliabilität von Handelssignalen durch die Validierung von mehrdimensionalen technischen Kennzahlen, während die Unterstützung von Widerstandsebenen als wichtige Referenz für die Risikokontrolle verwendet wird.
Strategieprinzip
Die Strategie nutzt eine Dreifach-Verifizierungs-Mechanismus für die Transaktionsentscheidung: Zuerst identifizieren Sie die doppelte Bodenform, einschließlich der schärferen “Adam-Boden” und der runderen “Eva-Boden” durch einen bestimmten Algorithmus; zweitens identifizieren Sie die Zielregion mit den Fibonacci-Rückschlagsebenen ((0.618 und 1.618); und schließlich bestätigen Sie den Handel durch die Verifizierung der Widerstandsstufe des Supports. Die Erzeugung des Handelssignals erfordert die gleichzeitige Erfüllung der Bedingungen für die Formidentifizierung, den Fibonacci-Niveau und den Supportspannstand.
Strategische Vorteile
- Multiple-Verifizierungsmechanismen erhöhen die Zuverlässigkeit von Handelssignalen erheblich
- Marktwendepunkte durch Formalerkennungs-Algorithmen präzise erfassen
- In Kombination mit der Fibonacci-Ebene erhält man eine genaue Zielregion
- Verifizierung von Resistenzniveaus erhöht die Sicherheit von Transaktionen
- Die Strategieparameter sind äußerst anpassungsfähig und können an unterschiedliche Marktumgebungen angepasst werden.
- Hohe Automatisierungsgrade, reduzieren die Abweichung von subjektiven Beurteilungen
Strategisches Risiko
- Formerkennung könnte nachlässig sein, was die Eintrittszeit beeinträchtigt
- Falsche Signale bei hoher Volatilität
- Die Wirksamkeit von Resistenzwerten wird durch die Marktumstände beeinflusst
- Fehlgelegte Parameter können zu übermäßigen Transaktionen führen
- Es wird eine größere Beobachtungsdauer benötigt, und es könnten schnelle Chancen verpasst werden.
Richtung der Strategieoptimierung
- Einführung von Volatilitätsindikatoren zur Filterung von Marktbedingungen
- Hinzufügung von Trendfiltern, um die Genauigkeit der Formenerkennung zu verbessern
- Berechnungsmethode zur Optimierung der Widerstandsstufe
- Hinzufügung der Transaktionsmenge als zusätzliche Bestätigung
- Entwicklung flexiblerer Schadenshemmungsmechanismen
- Die Einführung von Machine-Learning-Algorithmen erhöht die Genauigkeit der Gestalterkennung
Zusammenfassen
Die Strategie baut ein vergleichsweise vollständiges Handelssystem auf, indem sie mehrere technische Analysemethoden wie Formenerkennung, Fibonacci-Levels und Unterstützungswiderstandslinien kombiniert. Der Vorteil der Strategie besteht darin, dass ihre mehrfache Verifizierungsmechanismen eine hohe Zuverlässigkeit bieten, während ihre Anpassbarkeit sie in die Lage versetzt, sich an unterschiedliche Marktumgebungen anzupassen. Obwohl einige inhärente Risiken bestehen, ist die Strategie durch kontinuierliche Optimierung und Verbesserung in Aussicht, eine stabile Leistung im realen Handel zu erzielen.
/*backtest
start: 2019-12-23 08:00:00
end: 2024-12-04 00:00:00
period: 1d
basePeriod: 1d
exchanges: [{"eid":"Futures_Binance","currency":"BTC_USDT"}]
*/

//@version=5
strategy("Double Bottom with Support/Resistance Strategy - Aynet", overlay=true)

// Inputs
lookbackPeriod = input(21, "Lookback Period")
swingLowThreshold = input(1.5, "Swing Low Threshold")
fibLevel1 = input(0.618, "Fibonacci Level 1")
fibLevel3 = input(1.618, "Fibonacci Level 2")
srPeriod = input(21, "Support/Resistance Period")
srThreshold = input(3, "Support/Resistance Touch Points")

// Support/Resistance Function
get_sr_level(idx) =>
    var level = 0.0
    var count = 0

    if bar_index % srPeriod == 0
        highCount = 0
        lowCount = 0
        for i = 0 to srPeriod - 1
            if math.abs(high[i] - high) < (high * 0.001)
                highCount += 1
            if math.abs(low[i] - low) < (low * 0.001)
                lowCount += 1

        if highCount >= srThreshold
            level := high
            count := highCount
        if lowCount >= srThreshold
            level := low
            count := lowCount

    [level, count]

// Pattern Detection Functions
isSwingLow(src, left, right) =>
    isLow = true
    for i = 0 to left + right
        if src[i] < src[right]
            isLow := false
    isLow

getSpikeSharpness(index) =>
    priceRange = high[index] - low[index]
    bodyRange = math.abs(close[index] - open[index])
    sharpness = priceRange / bodyRange
    sharpness

// Pattern Variables
var float firstBottom = na
var float secondBottom = na
var bool isAdam = false
var bool isEve = false
var float level1Value = na
var float level3Value = na

// Pattern Detection
bottom = isSwingLow(low, lookbackPeriod, lookbackPeriod)
if bottom
    sharpness = getSpikeSharpness(0)
    if na(firstBottom)
        firstBottom := low
        isAdam := sharpness > swingLowThreshold
    else if low <= firstBottom * 1.02 and low >= firstBottom * 0.98
        secondBottom := low
        isEve := sharpness <= swingLowThreshold

// Calculate Fibonacci
if not na(secondBottom)
    highPoint = ta.highest(high, lookbackPeriod)
    fibDistance = highPoint - math.min(firstBottom, secondBottom)
    level1Value := math.min(firstBottom, secondBottom) + fibDistance * fibLevel1
    level3Value := math.min(firstBottom, secondBottom) + fibDistance * fibLevel3

// Get S/R Level
[srLevel, srCount] = get_sr_level(0)

// Trading Logic
longCondition = srLevel > level3Value
shortCondition = srLevel < level1Value

if longCondition
    strategy.entry("Long", strategy.long)

if shortCondition
    strategy.entry("Short", strategy.short)

// Reset Pattern
if high > ta.highest(high[1], lookbackPeriod)
    firstBottom := na
    secondBottom := na
    isAdam := false
    isEve := false
var table logo = table.new(position.top_right, 1, 1)
table.cell(logo, 0, 0, 'Double Bottom with Support/Resistance Strategy - Aynet', text_size=size.large, text_color=color.white)
// Plots
plot(level1Value, "0.236", color=color.rgb(245, 0, 0), style=plot.style_line)
plot(level3Value, "0.618", color=color.rgb(82, 166, 255), style=plot.style_line)
plot(srLevel, "S/R Level", color=color.white)

plotshape(bottom and not na(firstBottom) and na(secondBottom), "Adam Bottom", shape.circle, location.belowbar, color.green)
plotshape(bottom and not na(secondBottom), "Eve Bottom", shape.circle, location.belowbar, color.yellow)