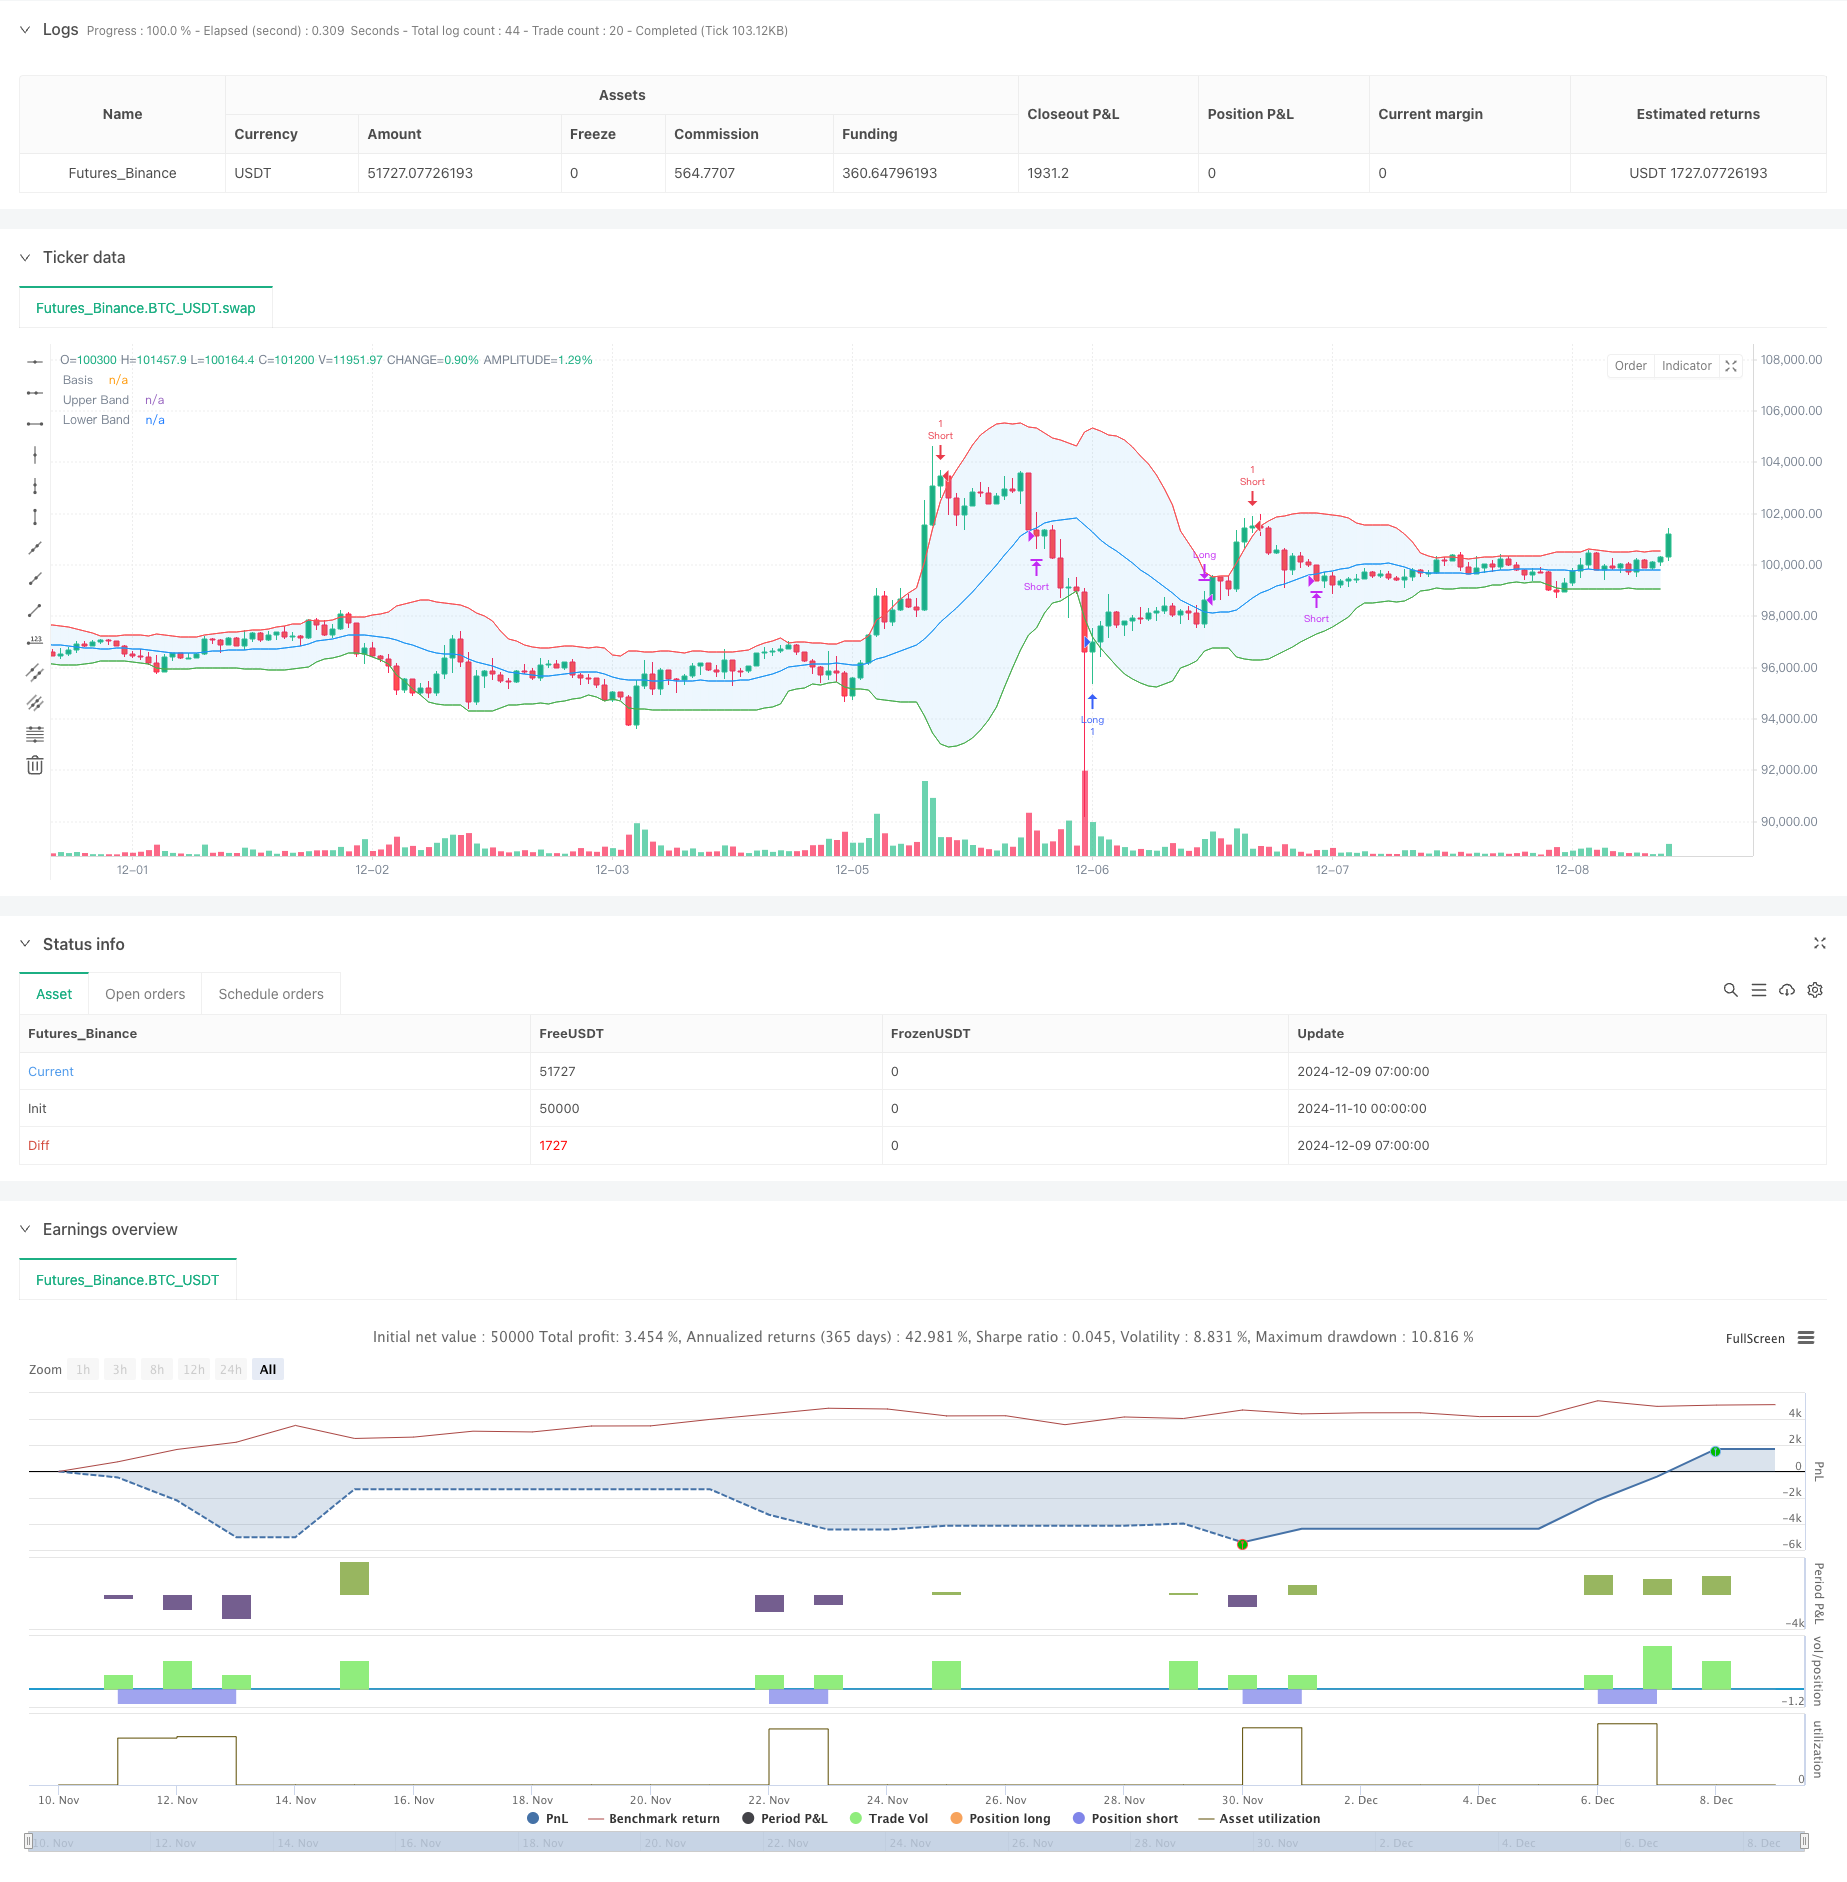
概述
本策略是一个基于布林带指标的改进版趋势跟踪策略。它通过监控价格与布林带的连续三次触及来确认趋势的可靠性,从而在更高的胜率下进行交易。策略采用20周期的移动平均线作为中轨,并以2倍标准差作为上下轨的计算基准。通过对价格与布林带边界的关系进行深入分析,实现了一个具有独特优势的交易系统。
策略原理
策略的核心逻辑在于通过计数机制识别价格对布林带边界的持续触及。当价格连续三次突破下轨时,系统会发出做多信号;当价格连续三次突破上轨时,系统会发出做空信号。这种机制有效地过滤掉了虚假突破,提高了交易的可靠性。策略使用布林带中轨(20期移动平均线)作为平仓信号,当价格回归中轨时完成交易。这种设计既保证了对趋势的把握,又能及时锁定利润。
策略优势
- 高可靠性:通过要求连续三次触及布林带边界来确认交易信号,大大降低了虚假突破的影响。
- 风险控制:使用移动平均线作为平仓点,能够在趋势逆转时及时止损。
- 适应性强:策略参数可根据不同市场条件进行调整,具有良好的普适性。
- 交易频率适中:由于设置了较严格的入场条件,避免了过度交易。
- 资金管理合理:采用账户总值的百分比进行仓位管理,风险可控。
策略风险
- 震荡市场风险:在横盘震荡市场中可能产生频繁的假信号。
- 滑点风险:在市场剧烈波动时,可能面临较大的滑点损失。
- 参数敏感性:布林带参数的设置对策略表现影响较大。
- 趋势反转风险:在强趋势突然反转时可能承受较大损失。
策略优化方向
- 引入成交量指标:结合成交量分析可以提高信号的可靠性。
- 动态调整参数:根据市场波动率自适应调整布林带参数。
- 增加趋势确认指标:可以添加其他技术指标来确认趋势方向。
- 优化止损方案:设计更灵活的止损机制以应对不同市场环境。
- 完善仓位管理:根据信号强度动态调整持仓比例。
总结
该策略通过改进传统布林带交易系统,实现了一个具有较高可靠性的趋势跟踪策略。其独特的三重触及确认机制有效提高了交易胜率,而基于移动平均线的平仓机制则提供了合理的获利了结方案。虽然策略仍存在一些固有风险,但通过提供的优化方向,可以进一步提升策略的稳定性和盈利能力。
策略源码
/*backtest
start: 2024-11-10 00:00:00
end: 2024-12-09 08:00:00
period: 1h
basePeriod: 1h
exchanges: [{"eid":"Futures_Binance","currency":"BTC_USDT"}]
*/

//@version=6
strategy("Bollinger Bands Strategy - 3 Crossings", overlay=true)

// Input Parameters
length = input.int(20, title="Bollinger Bands Length", minval=1)
src = input(close, title="Source")
mult = input.float(2.0, title="Multiplier", step=0.1)

// Calculate Bollinger Bands
basis = ta.sma(src, length)
dev = mult * ta.stdev(src, length)
upper = basis + dev
lower = basis - dev

// Plot Bollinger Bands
plotBasis = plot(basis, color=color.blue, title="Basis")
plotUpper = plot(upper, color=color.red, title="Upper Band")
plotLower = plot(lower, color=color.green, title="Lower Band")
fill(plot1=plotUpper, plot2=plotLower, color=color.new(color.blue, 90), title="Band Fill")

// Counter Variables
var int longCrossCount = 0
var int shortCrossCount = 0

// Detect Crossings
longCondition = close < lower  // Price closes below the lower band
shortCondition = close > upper  // Price closes above the upper band

if longCondition
    longCrossCount += 1  // Increment the counter for long
    shortCrossCount := 0  // Reset the short counter

if shortCondition
    shortCrossCount += 1  // Increment the counter for short
    longCrossCount := 0  // Reset the long counter

if not longCondition and not shortCondition
    longCrossCount := 0  // Reset if no crossing
    shortCrossCount := 0

// Entry and Exit Rules
if longCrossCount >= 3 and strategy.position_size <= 0
    strategy.entry("Long", strategy.long)
    longCrossCount := 0  // Reset the counter after entering

if shortCrossCount >= 3 and strategy.position_size >= 0
    strategy.entry("Short", strategy.short)
    shortCrossCount := 0  // Reset the counter after entering

// Exit Condition (When Price Returns to the Middle Band)
exitCondition = ta.crossover(src, basis) or ta.crossunder(src, basis)

if exitCondition and strategy.position_size > 0
    strategy.close("Long")
if exitCondition and strategy.position_size < 0
    strategy.close("Short")
相关推荐