Multi Moving Average Trading System mit Momentum- und Volumenbestätigung
Schriftsteller:ChaoZhang, Datum: 2024-12-12 14:27:59Tags:- Nein.VWMAWMARSIADX

Übersicht
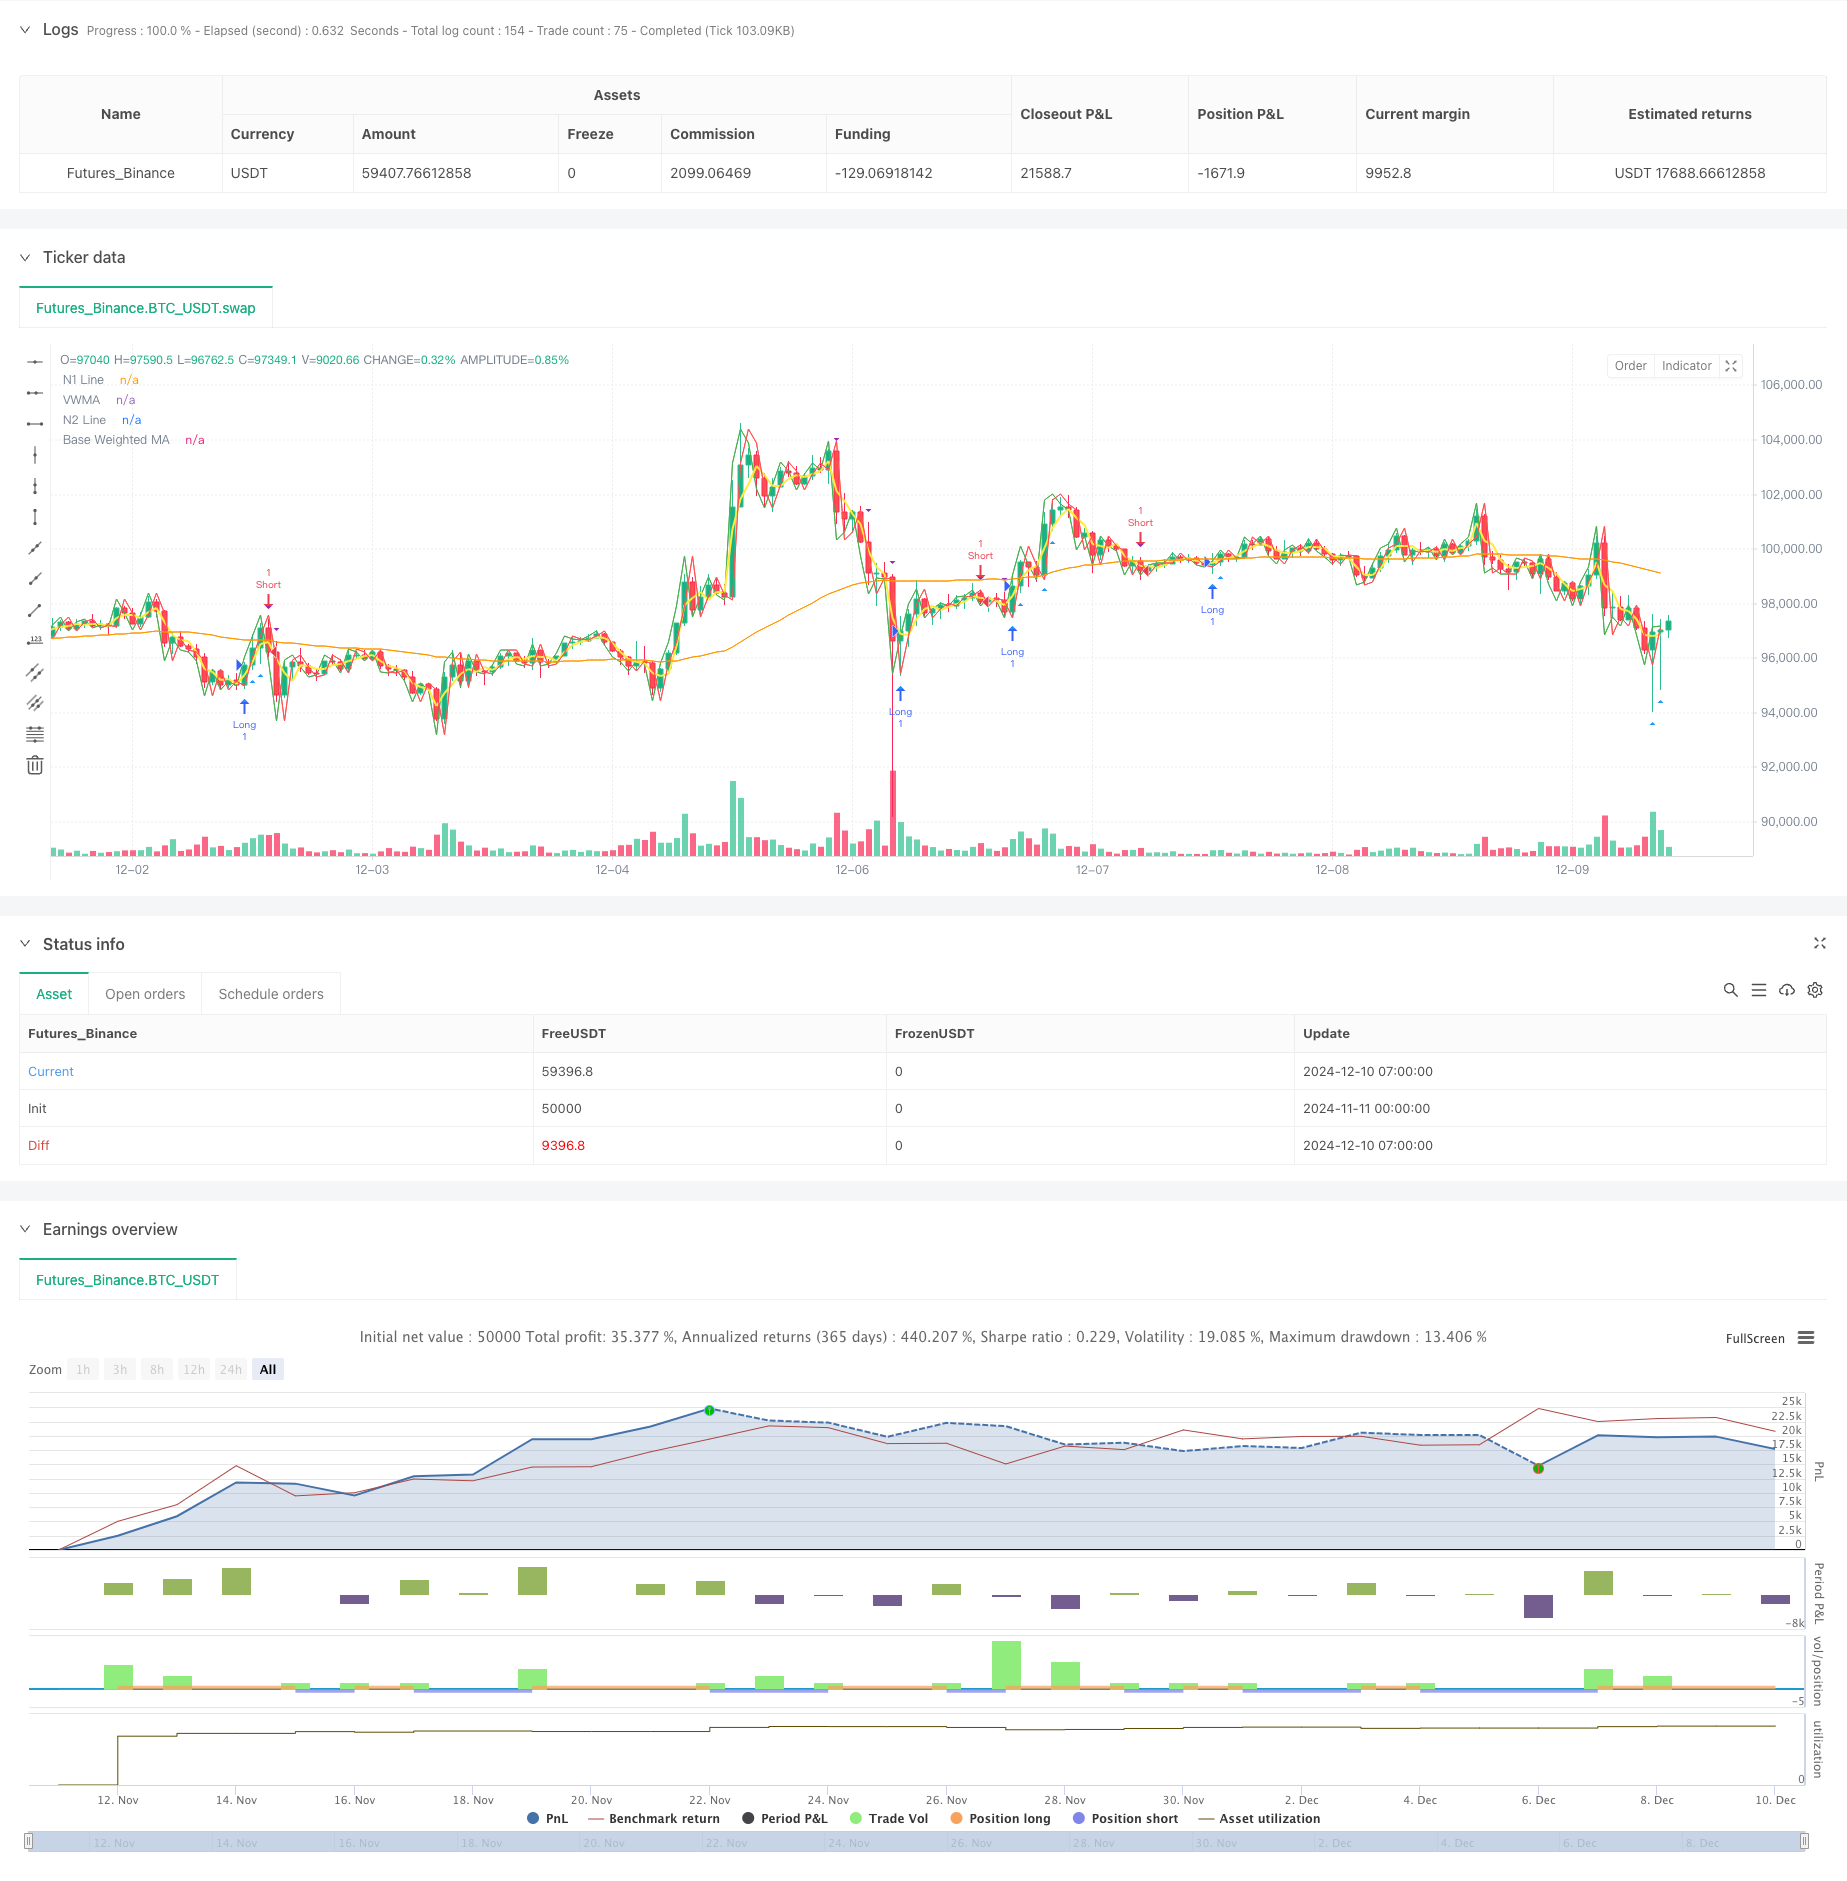
Diese Strategie ist ein umfassendes quantitatives Handelssystem, das mehrere gleitende Durchschnitte, Relative Strength Index (RSI), Average Directional Index (ADX) und Volumenanalyse kombiniert.
Strategieprinzipien
Die Kernlogik basiert auf mehreren Schlüsselkomponenten: 1. Mehrfaches gleitendes Durchschnittssystem unter Verwendung von Double HullMA, Volumengewichtetem gleitendem Durchschnitt (VWMA) und Basisgewichtetem gleitendem Durchschnitt (WMA) 2. Beurteilung der Trendstärke unter Verwendung des ADX-Indikators, Handel nur mit starken Trends 3. RSI-Filterung zur Vermeidung extremer Marktbedingungen 4. Volumenanalyse, bei der für Handelssignale ein Volumen über dem Schwellenwert erforderlich ist 5. Bestimmung der Handelsrichtung durch Kreuzungen der Linien n1 und n2
Das Multiple Moving Average-System liefert grundlegende Trendbeurteilungen, der ADX sorgt dafür, dass nur starke Trends gehandelt werden, der RSI hilft, Extreme zu vermeiden und die Volumenanalyse sorgt dafür, dass der Handel in Zeiten hoher Marktaktivität stattfindet.
Strategische Vorteile
- Mehrere Bestätigungsmechanismen verringern die Risiken eines falschen Ausbruchs
- Integration technischer Indikatoren und Volumenanalyse verbessert die Handelssicherheit
- RSI-Filterung verhindert den Eintritt bei ungünstigen Marktbedingungen
- Die Verwendung von ADX sorgt dafür, dass nur in klaren Trends gehandelt wird, was die Gewinnrate verbessert.
- Volumenanforderungen helfen, den Konsens auf dem Markt zu bestätigen
- Klare Strategielogik mit verstellbaren Parametern
Strategische Risiken
- Mehrere Filter können zu verpassten Handelsmöglichkeiten führen
- Kann in verschiedenen Märkten unterdurchschnittlich sein
- Parameteroptimierung mit Risiken einer Überanpassung
- Das gleitende Durchschnittssystem kann bei schnellen Umkehrungen zurückbleiben
- Volumenfilterung kann die Möglichkeiten auf Märkten mit geringer Liquidität einschränken
Empfehlungen für das Risikomanagement: - Anpassung der Parameter anhand der Merkmale des Marktes - Festlegung geeigneter Stop-Loss- und Take-Profit-Niveaus - Größenordnung der Kontrollposition - Regelmäßige Strategie-Backtesting
Optimierung der Strategie
- Einführung von anpassungsfähigen Parametern auf der Grundlage der Marktbedingungen
- Hinzufügen von Volatilitätsfiltern zur Anpassung von Positionen in Zeiten hoher Volatilität
- Verbesserte Ausfahrtmechanismen mit Rückhaltstationen
- Optimieren Sie Volumenfilter mit relativen und nicht mit absoluten Werten
- Hinzufügen von Zeitfiltern, um wichtige Pressemitteilungen zu vermeiden
- Erwägen Sie die Hinzufügung von Indikatoren für die Preisvolatilität zur besseren Risikobewertung
Zusammenfassung
Die Strategie baut ein relativ vollständiges Trendfolgensystem durch mehrere technische Indikatoren auf, die zusammenarbeiten. Sein Hauptmerkmal ist die Verwendung mehrerer Bestätigungen, um die Handelszuverlässigkeit zu verbessern und gleichzeitig das Risiko durch verschiedene Filter zu kontrollieren. Obwohl es einige Chancen verpassen kann, hilft es im Allgemeinen, die Handelsstabilität zu verbessern. Die vorgeschlagenen Optimierungsrichtungen bieten Raum für weitere Strategieverbesserungen.
/*backtest
start: 2024-11-11 00:00:00
end: 2024-12-10 08:00:00
period: 1h
basePeriod: 1h
exchanges: [{"eid":"Futures_Binance","currency":"BTC_USDT"}]
*/

//@version=5
strategy("Optimized Multi-MA Strategy with Volume, ADX and RSI", overlay=true)

// Kullanıcı Parametreleri
keh = input.int(3, title="Double HullMA", minval=1)
teh = input.int(3, title="Volume-Weighted MA", minval=1)
yeh = input.int(75, title="Base Weighted MA", minval=1)
rsiPeriod = input.int(14, title="RSI Period", minval=1)
adxPeriod = input.int(14, title="ADX Period", minval=1)
volumeLookback = input.int(10, title="Volume Lookback Period", minval=1)  // Son X mumun hacmi
adxThreshold = input.int(20, title="ADX Trend Strength Threshold", minval=1) // ADX için trend gücü eşiği

// Hareketli Ortalamalar
rvwma = ta.vwma(close, teh)
yma = ta.wma(close, yeh)
n2ma = 2 * ta.wma(close, math.round(keh / 2))
nma = ta.wma(close, keh)
diff = n2ma - nma
sqrtKeh = math.round(math.sqrt(keh))
n1 = ta.wma(diff, sqrtKeh)
n2 = ta.wma(diff[1], sqrtKeh)

// ADX Hesaplaması
trueRange = ta.rma(ta.tr, adxPeriod)
plusDM = ta.rma(math.max(high - high[1], 0), adxPeriod)
minusDM = ta.rma(math.max(low[1] - low, 0), adxPeriod)
plusDI = (plusDM / trueRange) * 100
minusDI = (minusDM / trueRange) * 100
dx = math.abs(plusDI - minusDI) / (plusDI + minusDI) * 100
adx = ta.rma(dx, adxPeriod)
trendIsStrong = adx > adxThreshold

// RSI Filtreleme
rsiValue = ta.rsi(close, rsiPeriod)
rsiFilter = rsiValue > 30 and rsiValue < 70  // Aşırı alım ve aşırı satım bölgelerinin dışında olmak

// Hacim Filtresi
volumeThreshold = ta.sma(volume, volumeLookback)  // Ortalama hacim seviyesi
highVolume = volume > volumeThreshold

// Sinyal Şartları (Sadece güçlü trendler ve rsi'nın aşırı bölgelerde olmaması)
longCondition = n1 > n2 and close > rvwma and trendIsStrong and rsiFilter and highVolume
shortCondition = n1 < n2 and close < rvwma and trendIsStrong and rsiFilter and highVolume

// Hacim Filtresi ile İşaretler
plotshape(series=longCondition and highVolume ? close : na, style=shape.triangleup, location=location.belowbar, color=color.blue, size=size.small, title="High Volume Long Signal")
plotshape(series=shortCondition and highVolume ? close : na, style=shape.triangledown, location=location.abovebar, color=color.purple, size=size.small, title="High Volume Short Signal")

// Strateji Giriş ve Çıkış Şartları
if (longCondition)
    strategy.entry("Long", strategy.long)

if (shortCondition)
    strategy.entry("Short", strategy.short)

// Görsel Göstergeler
plot(n1, color=color.green, title="N1 Line")
plot(n2, color=color.red, title="N2 Line")
plot(rvwma, color=color.yellow, linewidth=2, title="VWMA")
plot(yma, color=color.orange, title="Base Weighted MA")
- Erweiterte quantitative Handelsstrategie, die RSI-Divergenz und gleitende Durchschnitte kombiniert
- MACD und RSI kombinierte natürliche Handelsstrategie
- MA-Ablehnungsstrategie mit ADX-Filter
- Multi-Technical Indicator Crossover Momentum Quantitative Trading Strategy - Integrationsanalyse auf der Grundlage von EMA, RSI und ADX
- Historische Breakout-Trend-System mit gleitendem Durchschnittsfilter (HBTS)
- Quantitative Trend-Erfassung-Strategie auf der Grundlage von Candlestick Wick Length Analysis
- Dynamischer Trend nach Strategie - Multi-Indikator-Integriertes Impulsanalyse-System
- Einrichtungsgeschäftsstrategie für den täglichen Range-Breakout
- Scalping EMA ADX RSI mit Kauf/Verkauf
- Bollinger Bands Breakout Momentum Handelsstrategie
- EMA-MACD-Kompositionsstrategie für Trend-Scalping
- Trendverfolgung und Dynamikstrategie auf der Grundlage mehrerer technischer Indikatoren
- Handelsstrategie für hochfrequente quantitative Sitzungen: Adaptives dynamisches Positionsmanagementsystem auf Basis von Ausbruchssignalen
- Erweiterte Bollinger-Breakout-Quantitative Strategie mit Momentumfilterintegrationssystem
- Multi-EMA Crossover-Trend nach der Strategie
- Multi-Target-intelligente Handelsstrategie für Volumenmomentum
- Mehrjährige Bollinger-Bänder Berührung Trendumkehrung Quantitative Handelsstrategie
- High-Frequency Breakout-Handelsstrategie auf der Grundlage der Candlestick-Schließrichtung
- Erweiterte dynamische Fibonacci-Retracement-Trend-Quantitative Handelsstrategie
- Variabler Index Dynamischer Durchschnitt Mehrstufige Gewinnentwicklung nach Strategie
- Anpassungsfähige, nachträgliche und ausgewogene Handelsstrategie mit Take-Profit und Stop-Loss
- Verstärktes Trendverfolgungssystem: Dynamische Trendbestimmung auf Basis von ADX und Parabol SAR
- Handelsstrategie mit doppeltem Zeitrahmen
- Anpassungsfähige Bollinger-Bänder Dynamische Positionsmanagementstrategie
- Dynamische RSI-Smart Timing Swing-Handelsstrategie
- Zwei-Wege-Handelsstrategie auf der Grundlage der Candlestick Absorption Pattern Analysis
- Bollinger-Breakout mit mittlerer Umkehrung 4H Quantitative Handelsstrategie
- Trend nach der Strategie zur Dynamischen Grid-Positionsgrößerung
- Zweifelhafte BBI-Strategie
- Dynamische Long/Short-Swing-Handelsstrategie mit gleitendem Durchschnitts-Crossover-Signalsystem