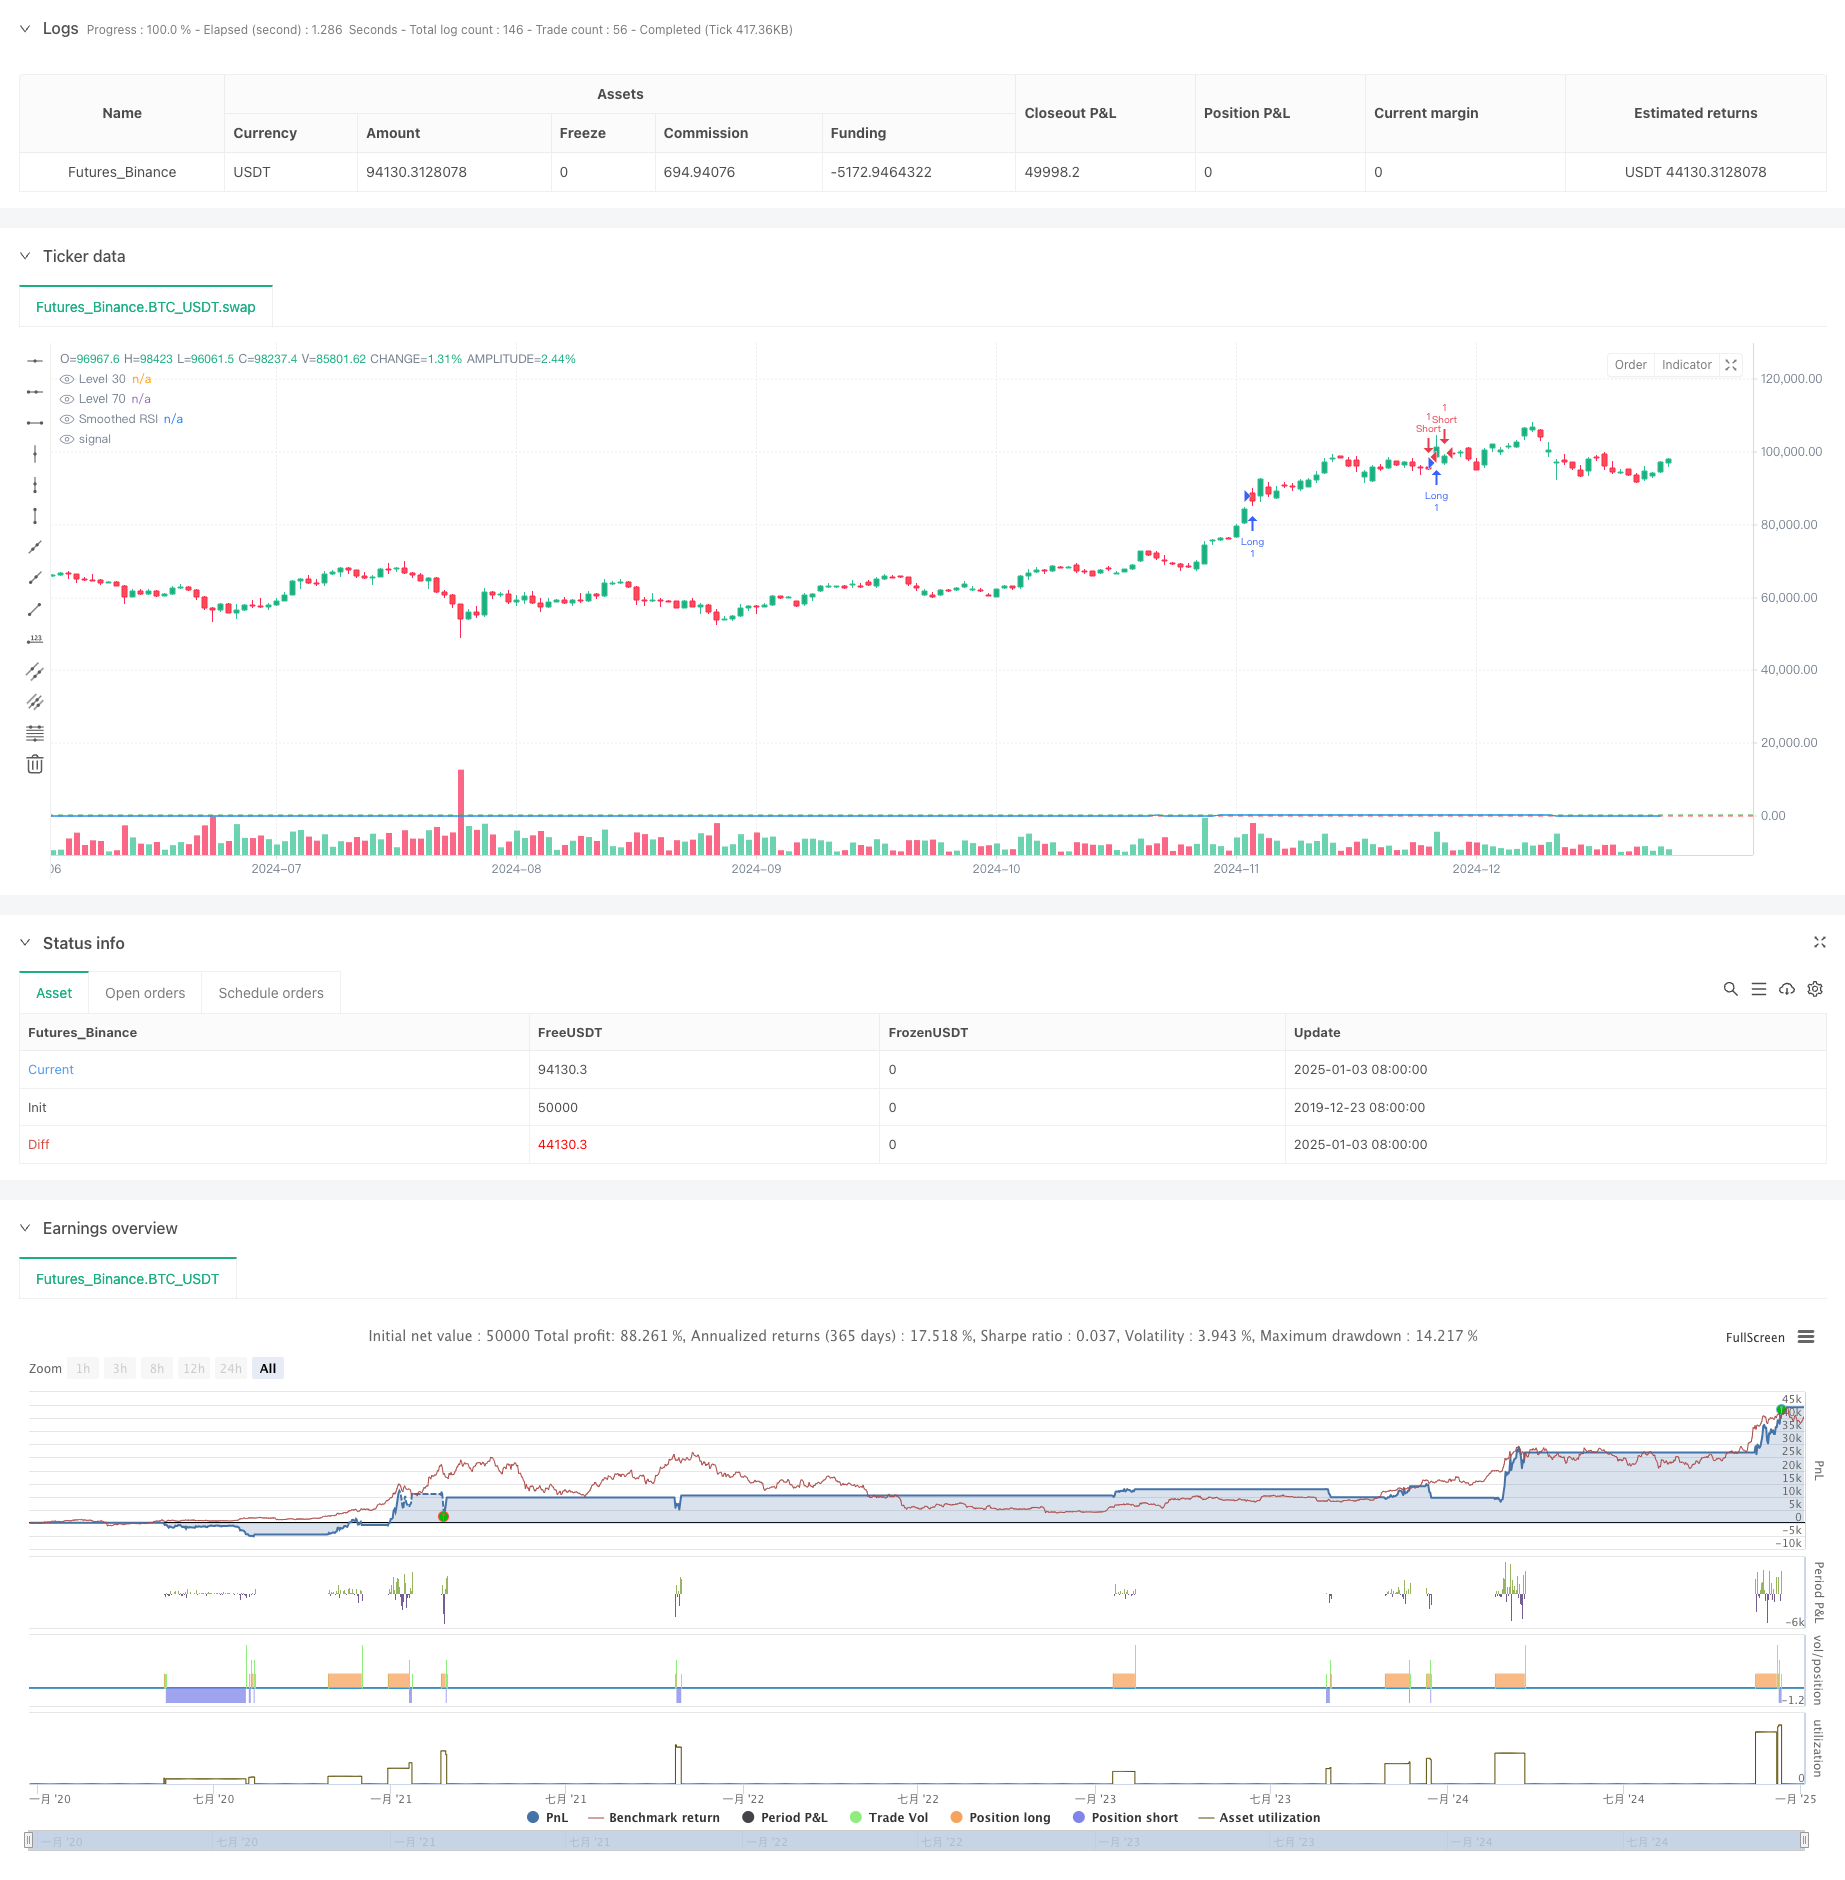
Mehrzeitrahmen-quantitative Handelsstrategie auf der Grundlage von EMA-glätteten RSI und ATR Dynamic Stop-Loss/Take-Profit
Schriftsteller:ChaoZhang, Datum: 2025-01-06 16: 43:14Tags:RSIEMAATR

Übersicht
Diese Strategie ist ein umfassendes quantitatives Handelssystem, das auf dem Relative Strength Index (RSI), dem Exponential Moving Average (EMA) und dem Average True Range (ATR) basiert. Die Strategie glättet den RSI mithilfe der EMA, löst Trades durch RSI-Ausbrüche auf Schlüsselniveaus aus und nutzt den ATR für dynamische Stop-Loss- und Take-Profit-Niveaus, um eine effektive Risikokontrolle zu erzielen. Darüber hinaus umfasst die Strategie Handelssignalzähl- und Aufzeichnungsfunktionen, um Händler beim Backtesting und der Optimierung zu unterstützen.
Strategieprinzip
Die Kernlogik umfasst folgende Schlüsselelemente:
- Verwendet den 14-Perioden-RSI zur Berechnung von Marktüberkauf/Überverkauf
- Der RSI wird durch die EMA ausgeglichen, um falsche Signale zu reduzieren.
- Erzeugt Handelssignale, wenn der RSI die Schlüsselniveaus von 70 und 30 durchbricht
- Verwendet ATR für die dynamische Berechnung von Stop-Loss- und Take-Profit-Levels
- Einrichtet eine Handelssignalzähltabelle zur Erfassung von Preisinformationen für jeden Handel
Strategische Vorteile
- Starke Signal-Gleichung: RSI-Gleichung durch EMA verringert effektiv falsche Ausbruchssignale
- Umfassende Risikokontrolle: Dynamische Stop-Loss-Anpassung an die Marktvolatilität unter Verwendung von ATR
- Bidirektionales Trading: Unterstützt sowohl den Long- als auch den Short-Handel, um Marktchancen zu nutzen
- Parameteranpassung: Schlüsselparameter können für verschiedene Marktmerkmale angepasst werden
- Visuelle Überwachung: Aufzeichnungen von Handelssignalen in einer Tabelle für die Überwachung und das Backtesting von Strategien
Strategische Risiken
- Risiko eines falschen Ausbruchs des RSI: Selbst bei einer EMA-Gleichung kann der RSI immer noch falsche Ausbruchssignale erzeugen
- Unzureichende ATR-Stop-Loss-Einstellungen: Falsche Einstellungen des ATR-Multiplikators können zu lockeren oder knappen Stops führen.
- Parameteroptimierungsrisiko: Überoptimierung kann zu einer Überanpassung der Strategie führen
- Abhängigkeit vom Marktumfeld: Die Leistung kann zwischen den Trends und den unterschiedlichen Märkten erheblich variieren
Optimierung der Strategie
- Einführung von Multi-Timeframe-Analysen: Einbeziehung von RSI-Signalen mit längeren Zeitrahmen für die Handelsbestätigung
- Optimierung des Stop-Loss-Mechanismus: Dynamische Anpassung des ATR-Multiplikators auf Basis von Unterstützung/Widerstand
- Hinzufügen von Marktumfeldanalyse: Hinzufügen von Trendindikatoren zur Anpassung von Strategieparametern
- Verbesserte Signalfilterung: Erwägen Sie das Hinzufügen von Lautstärkenindikatoren, um falsche Ausbrüche zu filtern
- Implementieren von Positionsgrößen: Dynamische Anpassung der Positionsgröße basierend auf Signalstärke und Volatilität
Zusammenfassung
Die Strategie kombiniert drei klassische technische Indikatoren - RSI, EMA und ATR - um ein vollständiges quantitatives Handelssystem aufzubauen. Sie zeigt eine starke Praktikabilität bei der Signalgenerierung, Risikokontrolle und Handelsausführung. Durch kontinuierliche Optimierung und Verbesserung verspricht die Strategie eine stabile Performance im Live-Handel. Benutzer müssen jedoch die Auswirkungen der Marktbedingungen auf die Strategieleistung berücksichtigen, Parameter angemessen festlegen und eine angemessene Risikokontrolle beibehalten.
/*backtest
start: 2019-12-23 08:00:00
end: 2025-01-04 08:00:00
period: 1d
basePeriod: 1d
exchanges: [{"eid":"Futures_Binance","currency":"BTC_USDT"}]
*/
//@version=6
strategy("RSI Trading Strategy with EMA and ATR Stop Loss/Take Profit", overlay=true)
length = input.int(14, minval=1, title="RSI Length")
src = input(close, title="Source")
rsi = ta.rsi(src, length)
smoothingLength = input.int(14, minval=1, title="Smoothing Length")
smoothedRsi = ta.ema(rsi, smoothingLength) // استفاده از EMA برای صاف کردن RSI
atrLength = input.int(14, title="ATR Length")
atrMultiplier = input.float(1, title="ATR Multiplier")
atrValue = ta.atr(atrLength) // محاسبه ATR
level1 = 30
level2 = 70
// تنظیمات استراتژی
var table crossingTable = table.new(position.top_right, 2, 5, border_width=1)
var int crossCount = 0
var float crossPrice = na
// شرط ورود به معامله خرید زمانی که RSI از سطح 70 به بالا عبور میکند
if (ta.crossover(smoothedRsi, level2))
strategy.entry("Long", strategy.long)
// تنظیم حد سود و حد ضرر
strategy.exit("Take Profit/Stop Loss", "Long", stop=close - atrMultiplier * atrValue, limit=close + atrMultiplier * atrValue, comment="")
crossCount := crossCount + 1
crossPrice := close
// شرط ورود به معامله فروش زمانی که RSI از سطح 70 به پایین عبور میکند
if (ta.crossunder(smoothedRsi, level2))
strategy.entry("Short", strategy.short)
// تنظیم حد سود و حد ضرر
strategy.exit("Take Profit/Stop Loss", "Short", stop=close + atrMultiplier * atrValue, limit=close - atrMultiplier * atrValue, comment="")
crossCount := crossCount + 1
crossPrice := close
// شرط ورود به معامله خرید زمانی که RSI از سطح 30 به بالا عبور میکند
if (ta.crossover(smoothedRsi, level1))
strategy.entry("Long", strategy.long)
// تنظیم حد سود و حد ضرر
strategy.exit("Take Profit/Stop Loss", "Long", stop=close - atrMultiplier * atrValue, limit=close + atrMultiplier * atrValue, comment="")
crossCount := crossCount + 1
crossPrice := close
// شرط ورود به معامله فروش زمانی که RSI از سطح 30 به پایین عبور میکند
if (ta.crossunder(smoothedRsi, level1))
strategy.entry("Short", strategy.short)
// تنظیم حد سود و حد ضرر
strategy.exit("Take Profit/Stop Loss", "Short", stop=close + atrMultiplier * atrValue, limit=close - atrMultiplier * atrValue, comment="")
crossCount := crossCount + 1
crossPrice := close
if (not na(crossPrice))
table.cell(crossingTable, 0, crossCount % 5, text=str.tostring(crossCount), bgcolor=color.green)
table.cell(crossingTable, 1, crossCount % 5, text=str.tostring(crossPrice), bgcolor=color.green)
// ترسیم خطوط و مقادیر RSI
plot(smoothedRsi, title="Smoothed RSI", color=color.blue)
hline(level1, "Level 30", color=color.red)
hline(level2, "Level 70", color=color.green)
- RSI50_EMA Langzeitstrategie
- Strategie zur Umkehrung des Trendkanals für Gold
- 4-Stunden-Zeitrahmen-Engabling-Muster-Handelsstrategie mit dynamischer Gewinn- und Stop-Loss-Optimierung
- ATR-RSI-Verstärktes Handelssystem nach Trend
- Dynamischer Stop-Loss-Mehrzeiten-RSI-Trend nach Strategie
- EMA-RSI-Kreuzungsstrategie
- Han Yue - Trend nach Handelsstrategie auf der Grundlage von mehreren EMAs, ATR und RSI
- Multi-Indikator-Intelligente Pyramidenstrategie
- Multi-Timeframe Exponential Moving Average Crossover Strategie mit Optimierung von Risiko-Belohnung
- AlphaTradingBot Handelsstrategie
- Der Wert des Wertpapiers wird auf der Basis der in Artikel 4 Absatz 1 Buchstabe b genannten Methode berechnet.
- Längfristige Trend-SMA-Quantitative Strategie
- Multi-Technical Indicator Fusion Trend nach einer quantitativen Handelsstrategie
- Multi-Technischer Indikator Momentum-MA-Trend nach Strategie
- Triple EMA Crossover Trading System mit einem intelligenten auf R2R basierenden Stop Loss Management
- Dynamische volatilitätsgetriebene hochfrequente EMA-Quantitative Strategie
- Handelsstrategie zur Umkehrung der Dynamik des Dualen Technischen Indikators mit einem Risikomanagementsystem
- Adaptive Fibonacci-Bollinger-Bänder Strategieanalyse
- Handelsstrategie mit mehreren Zeitrahmen
- Multi-Timeframe Supertrend Dynamischer Trend-Handelsalgorithmus
- Erweiterte MACD-Crossover-Handelsstrategie mit adaptivem Risikomanagement
- Quantitative Trend-Erfassung-Strategie auf der Grundlage von Candlestick Wick Length Analysis
- Statistik der doppelten Standardabweichung VWAP Breakout-Handelsstrategie
- Strategie für ein langes Netz auf der Grundlage von Auslastung und Zielgewinn
- Dynamischer gleitender Durchschnittsverlauf nach Strategie mit ATR-Risikomanagementsystem
- Multi-Indikator-optimierte KDJ-Trend-Crossover-Strategie auf Basis eines dynamischen Stochastischen Musterhandelssystems
- Multi-Timeframe Heikin-Ashi gleitender Durchschnittstrend nach Handelssystem