Handelsstrategie zur Umkehrung der Dynamik des Dualen Technischen Indikators mit einem Risikomanagementsystem
Schriftsteller:ChaoZhang, Datum: 2025-01-06 16:45:01Tags:RSIBBRRSMA

Übersicht
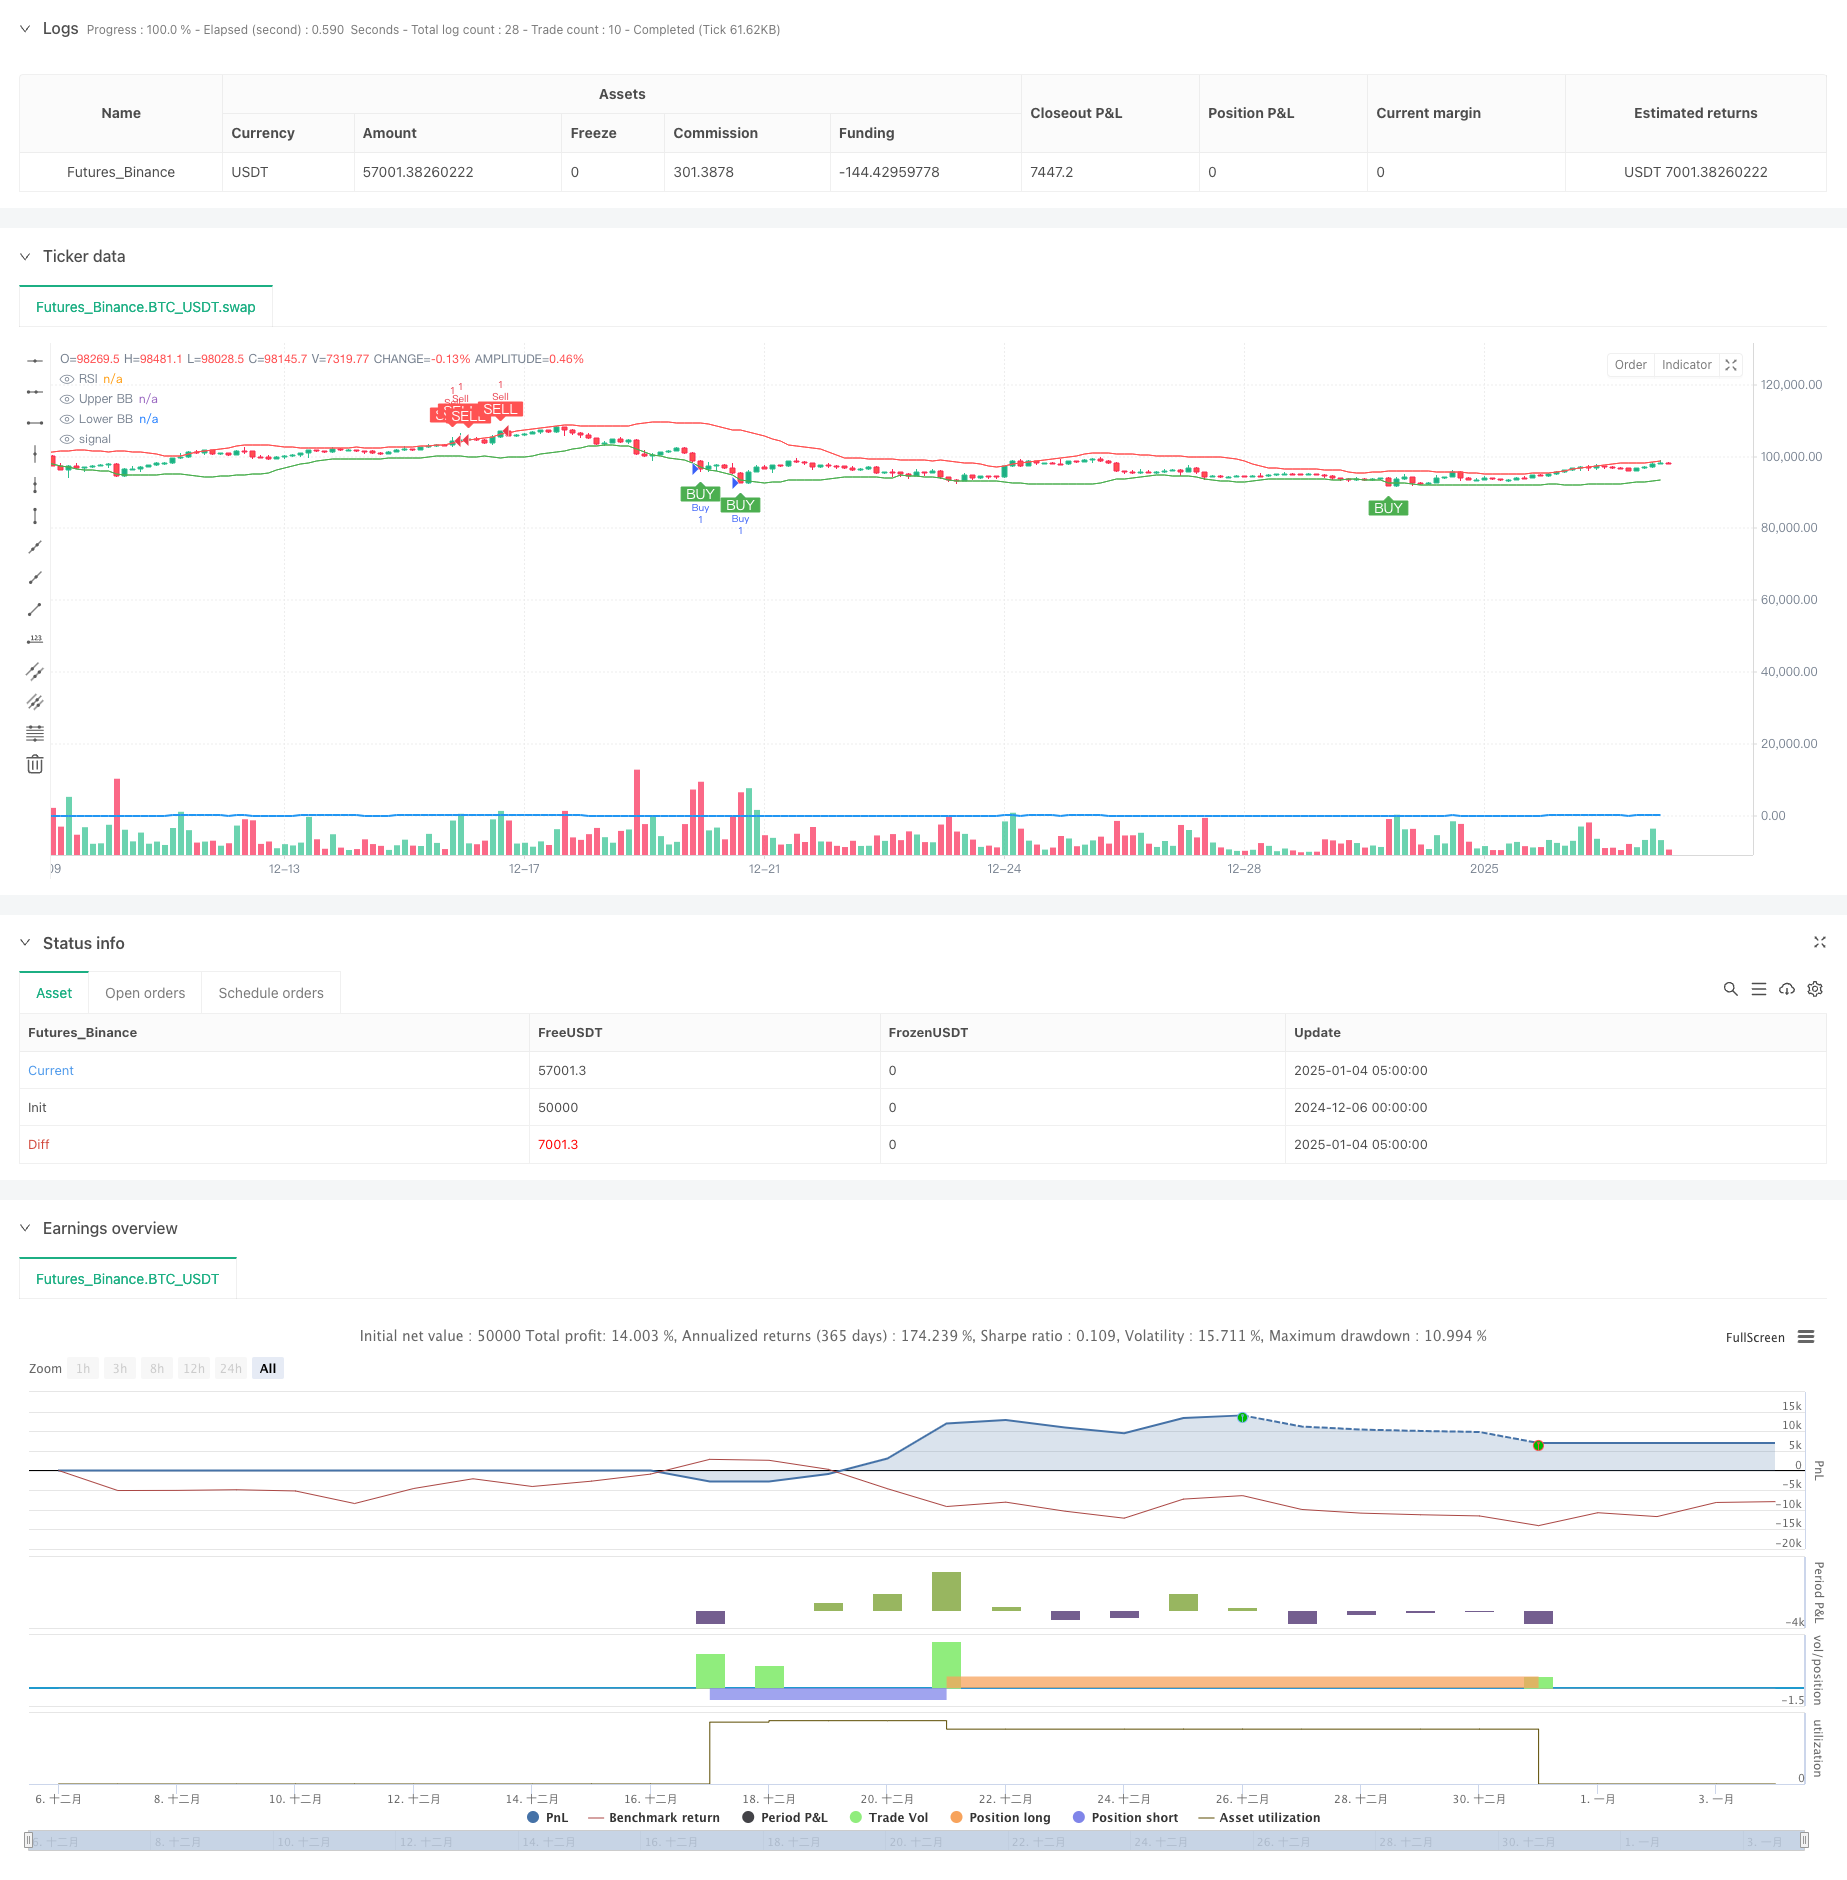
Diese Strategie ist ein Dynamikumkehrhandelssystem, das Indikatoren von RSI und Bollinger Bands kombiniert, um überkaufte und überverkaufte Bereiche zu identifizieren. Es implementiert ein 1: 2-Risiko-Rendite-Verhältnis mit einem nachfolgenden Stop-Loss für das Risikomanagement. Die Kernlogik besteht darin, Trades auszuführen, wenn sowohl RSI als auch Bollinger Bands gleichzeitig überverkaufte oder überkaufte Signale zeigen und das Kapital durch strenges Risikomanagement schützen.
Strategieprinzipien
Die Strategie verwendet einen 14-Perioden-RSI und 20-Perioden-Bollinger-Bänder als primäre Indikatoren. Kaufbedingungen erfordern sowohl: RSI unter 30 (Überverkauft) als auch Preis bei oder unter dem unteren Bollinger-Band. Verkaufsbedingungen erfordern sowohl: RSI über 70 (Überkauft) als auch Preis bei oder über dem oberen Bollinger-Band. Das System verwendet 5-Bar-Hoch-/Tiefpunkte für Trailing-Stops, wobei der Gewinnsatz auf das Doppelte der Stop-Loss-Distanz festgelegt ist und ein Risiko-Rendite-Verhältnis von 1:2 streng beibehalten wird.
Strategische Vorteile
- Die doppelte Indikatorfilterung verbessert die Signalqualität und verringert die Falschsignale
- Kombination von Dynamik- und Volatilitätsindikatoren für eine umfassende Marktperspektive
- Strenge Mechanismen zur Risikokontrolle, einschließlich Trailing-Stops und fester Risiko-Rendite-Ratio
- Voll automatisiertes System, das emotionale Störungen eliminiert.
- Klare Strategie-Logik, die leicht zu verstehen und zu pflegen ist
Strategische Risiken
- Kann häufige Stopps auf Trendmärkten auftreten
- Doppelbedingungen könnten einige Handelschancen verpassen
- Festgelegte RSI- und Bollinger-Band-Parameter entsprechen möglicherweise nicht allen Marktbedingungen
- Trailing-Stops können zu früh aus volatilen Märkten aussteigen
- Erfordert ein ordnungsgemäßes Geldmanagement, um mit aufeinanderfolgenden Verlusten umzugehen
Optimierungsrichtlinien
- Implementierung eines Mechanismus für anpassungsfähige Parameter zur dynamischen Anpassung der Indikatoreninstellungen anhand der Marktvolatilität
- Hinzufügen eines Trendfilters zur Pause des Umkehrhandels bei starken Trends
- Entwicklung eines dynamischen Risikoverhältnissystems, das sich an die Marktbedingungen anpasst
- Einbeziehung der Lautstärkerkennung zur Verbesserung der Signalzuverlässigkeit
- Implementieren Sie flexiblere Stop-Loss-Mechanismen wie Trailing-Stops oder zeitbasierte Exits
Zusammenfassung
Dies ist eine gut strukturierte Umkehrhandelsstrategie, die die Genauigkeit durch doppelte technische Indikatoren erhöht und ein strenges Risikomanagement einsetzt. Obwohl sie einfach und intuitiv ist, enthält sie alle Schlüsselelemente, die für ein ausgereiftes Handelssystem erforderlich sind. Durch die vorgeschlagenen Optimierungsrichtungen hat die Strategie Raum für weitere Verbesserungen. Für den Live-Handel werden gründliches Backtesting und Parameteroptimierung empfohlen.
/*backtest
start: 2024-12-06 00:00:00
end: 2025-01-04 08:00:00
period: 3h
basePeriod: 3h
exchanges: [{"eid":"Futures_Binance","currency":"BTC_USDT"}]
*/

//@version=5
strategy("RSI + Bollinger Bands with 1:2 Risk/Reward", overlay=true)

// Define Inputs
length_rsi = input.int(14, title="RSI Period")
oversold_level = input.int(30, title="RSI Oversold Level")
overbought_level = input.int(70, title="RSI Overbought Level")
length_bb = input.int(20, title="Bollinger Bands Period")
src = close
risk_to_reward = input.float(2.0, title="Risk-to-Reward Ratio", minval=1.0, step=0.1)

// Calculate Indicators
rsi_value = ta.rsi(src, length_rsi)
basis = ta.sma(src, length_bb)
dev = ta.stdev(src, length_bb)
upper_band = basis + 2 * dev
lower_band = basis - 2 * dev

// Define Buy and Sell Conditions
rsi_buy_condition = rsi_value < oversold_level // RSI below 30 (buy signal)
bollinger_buy_condition = close <= lower_band // Price at or near lower Bollinger Band (buy signal)

rsi_sell_condition = rsi_value > overbought_level // RSI above 70 (sell signal)
bollinger_sell_condition = close >= upper_band // Price at or near upper Bollinger Band (sell signal)

// Combine Buy and Sell Conditions
buy_condition = rsi_buy_condition and bollinger_buy_condition
sell_condition = rsi_sell_condition and bollinger_sell_condition

// Plot Buy and Sell Signals with white text and green/red boxes
plotshape(series=buy_condition, location=location.belowbar, color=color.green, style=shape.labelup, title="Buy Signal", text="BUY", textcolor=color.white, size=size.small)
plotshape(series=sell_condition, location=location.abovebar, color=color.red, style=shape.labeldown, title="Sell Signal", text="SELL", textcolor=color.white, size=size.small)

// Calculate Swing Points (for Stop Loss)
swing_low = ta.lowest(low, 5)  // Last 5 bars' low
swing_high = ta.highest(high, 5) // Last 5 bars' high

// Calculate Risk (Distance from Entry to SL)
long_risk = close - swing_low
short_risk = swing_high - close

// Calculate Take Profit using 1:2 Risk-to-Reward Ratio
take_profit_long = close + 2 * long_risk
take_profit_short = close - 2 * short_risk

// Strategy Execution: Enter Buy/Sell Positions
if buy_condition
    strategy.entry("Buy", strategy.long)
    strategy.exit("Take Profit", "Buy", limit=take_profit_long, stop=swing_low)  // Set TP and SL for Buy

if sell_condition
    strategy.entry("Sell", strategy.short)
    strategy.exit("Take Profit", "Sell", limit=take_profit_short, stop=swing_high)  // Set TP and SL for Sell

// Plotting the Indicators for Visualization (Optional - comment out if not needed)
plot(rsi_value, color=color.blue, title="RSI", linewidth=2, display=display.none)
plot(upper_band, color=color.red, title="Upper BB", display=display.none)
plot(lower_band, color=color.green, title="Lower BB", display=display.none)
- Der Trend der hohen Gewinnrate bedeutet eine Umkehrung der Handelsstrategie
- Bollinger Bands RSI Handelsstrategie
- Die RSI- und Bollinger-Band-Synergie-Swing-Handelsstrategie
- Bollinger-Bänder und kombinierte RSI-Handelsstrategie
- Bollinger-Bänder und RSI-Crossover-Handelsstrategie
- Bollinger-Bänder und RSI kombinierte dynamische Handelsstrategie
- Multi-Technical Indicator Fusion Trend nach einer quantitativen Handelsstrategie
- Anpassungsfähige Bollinger-Bänder Dynamische Positionsmanagementstrategie
- Die Risikopositionen sind in der Regel in den folgenden Kategorien aufgeführt:
- Hochpräzise RSI- und Bollinger-Band-Breakout-Strategie mit optimiertem Risiko-Rendite-Verhältnis
- Der Wert des Wertpapiers wird auf der Basis der in Artikel 4 Absatz 1 Buchstabe b genannten Methode berechnet.
- Längfristige Trend-SMA-Quantitative Strategie
- Multi-Technical Indicator Fusion Trend nach einer quantitativen Handelsstrategie
- Multi-Technischer Indikator Momentum-MA-Trend nach Strategie
- Triple EMA Crossover Trading System mit einem intelligenten auf R2R basierenden Stop Loss Management
- Dynamische volatilitätsgetriebene hochfrequente EMA-Quantitative Strategie
- Mehrzeitrahmen-quantitative Handelsstrategie auf der Grundlage von EMA-glätteten RSI und ATR Dynamic Stop-Loss/Take-Profit
- Adaptive Fibonacci-Bollinger-Bänder Strategieanalyse
- Handelsstrategie mit mehreren Zeitrahmen
- Multi-Timeframe Supertrend Dynamischer Trend-Handelsalgorithmus
- Erweiterte MACD-Crossover-Handelsstrategie mit adaptivem Risikomanagement
- Quantitative Trend-Erfassung-Strategie auf der Grundlage von Candlestick Wick Length Analysis
- Statistik der doppelten Standardabweichung VWAP Breakout-Handelsstrategie
- Strategie für ein langes Netz auf der Grundlage von Auslastung und Zielgewinn
- Dynamischer gleitender Durchschnittsverlauf nach Strategie mit ATR-Risikomanagementsystem
- Multi-Indikator-optimierte KDJ-Trend-Crossover-Strategie auf Basis eines dynamischen Stochastischen Musterhandelssystems