SMA Crossover Strategy with RSI Filter and Alerts
Author: ChaoZhang, Date: 2024-06-17 17:37:31Tags: SMARSI
Overview
The strategy uses the crossover of two Simple Moving Averages (SMAs) to identify buy and sell signals, combined with the Relative Strength Index (RSI) as a filter to reduce false signals. A buy signal is triggered when the short-term SMA crosses above the long-term SMA and the RSI is below the overbought level, while a sell signal is triggered when the short-term SMA crosses below the long-term SMA and the RSI is above the oversold level. The strategy also sets stop-loss and take-profit prices to manage risk and lock in profits. Additionally, sound and visual alerts are integrated to promptly notify the trader when signals occur.
Strategy Principle
The core of the strategy is to utilize the crossover relationship between two Simple Moving Averages (SMAs) of different periods to identify potential trend changes. When the short-term SMA crosses above the long-term SMA, it indicates that an uptrend may be forming, thus triggering a buy signal. Conversely, when the short-term SMA crosses below the long-term SMA, it suggests that a downtrend may be developing, thus triggering a sell signal.
To enhance the reliability of the signals and reduce false ones, the strategy introduces the Relative Strength Index (RSI) as a filter. RSI is a momentum oscillator used to measure the speed and magnitude of price changes. A buy signal is confirmed when the RSI is below the overbought level (default: 70), while a sell signal is confirmed when the RSI is above the oversold level (default: 30). This helps avoid entering trades when the price may already be overbought or oversold.
The strategy also sets predefined stop-loss and take-profit prices to manage risk and lock in profits. The stop-loss price is set by default to 1% of the entry price, while the take-profit price is set by default to 2% of the entry price. This helps limit potential losses and secure profits.
Lastly, the strategy integrates sound and visual alerts to promptly notify the trader when buy or sell signals occur. Sound alerts provide audible notifications when signals are triggered, while visual alerts highlight the signals on the chart with green (buy) and red (sell) backgrounds.
Strategy Advantages
-
Simplicity: The strategy employs commonly used technical indicators such as Simple Moving Averages (SMAs) and the Relative Strength Index (RSI), making it easy to understand and implement.
-
Trend Following: By using the crossover of SMAs with different periods, the strategy can identify potential trend changes, helping traders align with the prevailing trend.
-
Reduced False Signals: The introduction of RSI as a filter helps reduce false signals, improving the reliability of trading signals.
-
Risk Management: The strategy incorporates predefined stop-loss and take-profit prices, aiding in managing risk and securing profits.
-
Timely Alerts: The integration of sound and visual alerts promptly notifies traders of trading opportunities, enabling quick reactions.
-
Broad Applicability: The strategy can be applied to a wide range of assets, including indices, forex pairs, and commodities, making it versatile.
Strategy Risks
-
Parameter Sensitivity: The performance of the strategy heavily relies on the lengths of the SMAs, the settings of the RSI, and the stop-loss and take-profit parameters. Improper parameter selection may lead to suboptimal results.
-
Lag: As a trend-following strategy, the SMA crossover may experience lag, especially in rapidly changing market conditions. This can result in missed optimal entry points or delayed exits.
-
Choppy Markets: In sideways or choppy markets, frequent SMA crossovers may generate multiple false signals, leading to unnecessary trades and potential losses.
-
News Events: Major news events and economic data releases can cause sudden price fluctuations, invalidating technical indicators and adversely affecting the strategy’s performance.
-
Overtrading: If the periods of the SMAs are chosen too short, it may result in frequent trading signals, increasing transaction costs and potential slippage.
Strategy Optimization Directions
-
Parameter Optimization: Fine-tuning the lengths of the SMAs, the settings of the RSI, and the stop-loss and take-profit parameters can improve the strategy’s performance. Backtesting and optimization techniques can be employed to determine the optimal parameter combination.
-
Additional Filters: Besides RSI, other technical indicators such as Bollinger Bands or MACD can be introduced as filters to further confirm trends and reduce false signals.
-
Dynamic Stop-Loss and Take-Profit: Instead of using fixed stop-loss and take-profit levels, consider implementing dynamic levels that adjust based on market volatility or price action. This can help capture more profits in trending markets and minimize losses in choppy conditions.
-
Trend Confirmation: After a trading signal is triggered, consider waiting for a certain time or price confirmation to validate the stability of the trend. This can be done by observing consecutive closes above/below the SMA or using additional trend confirmation indicators.
-
Market Environment Adaptation: Adjust strategy parameters or switch to more suitable strategy variants based on different market environments (e.g., trending, ranging, or chaotic). This requires continuous monitoring and assessment of market conditions.
-
Portfolio Management: Combine the strategy with other uncorrelated strategies to build a diversified portfolio, spreading risk and enhancing overall returns.
Summary
The SMA Crossover Strategy with RSI Filter and Alerts is a simple yet effective trend-following approach. By utilizing the crossover of Simple Moving Averages with different periods to identify potential trend changes and using the Relative Strength Index as a confirming filter, the strategy generates reliable trading signals. The built-in risk management measures, such as stop-loss and take-profit, help control potential losses and lock in profits. The integration of sound and visual alerts enables traders to respond to trading opportunities in a timely manner.
While the strategy has its strengths, it also carries some inherent risks, such as parameter sensitivity, signal lag, and overtrading. By optimizing parameters, introducing additional filters, implementing dynamic stop-loss and take-profit, and adapting to changing market environments, the strategy’s performance can be further enhanced.
Overall, the SMA Crossover Strategy with RSI Filter and Alerts provides a solid starting point for traders seeking a simple and effective trend-following approach. With proper optimization and risk management, the strategy can be a valuable addition to any quantitative trader’s toolbox.
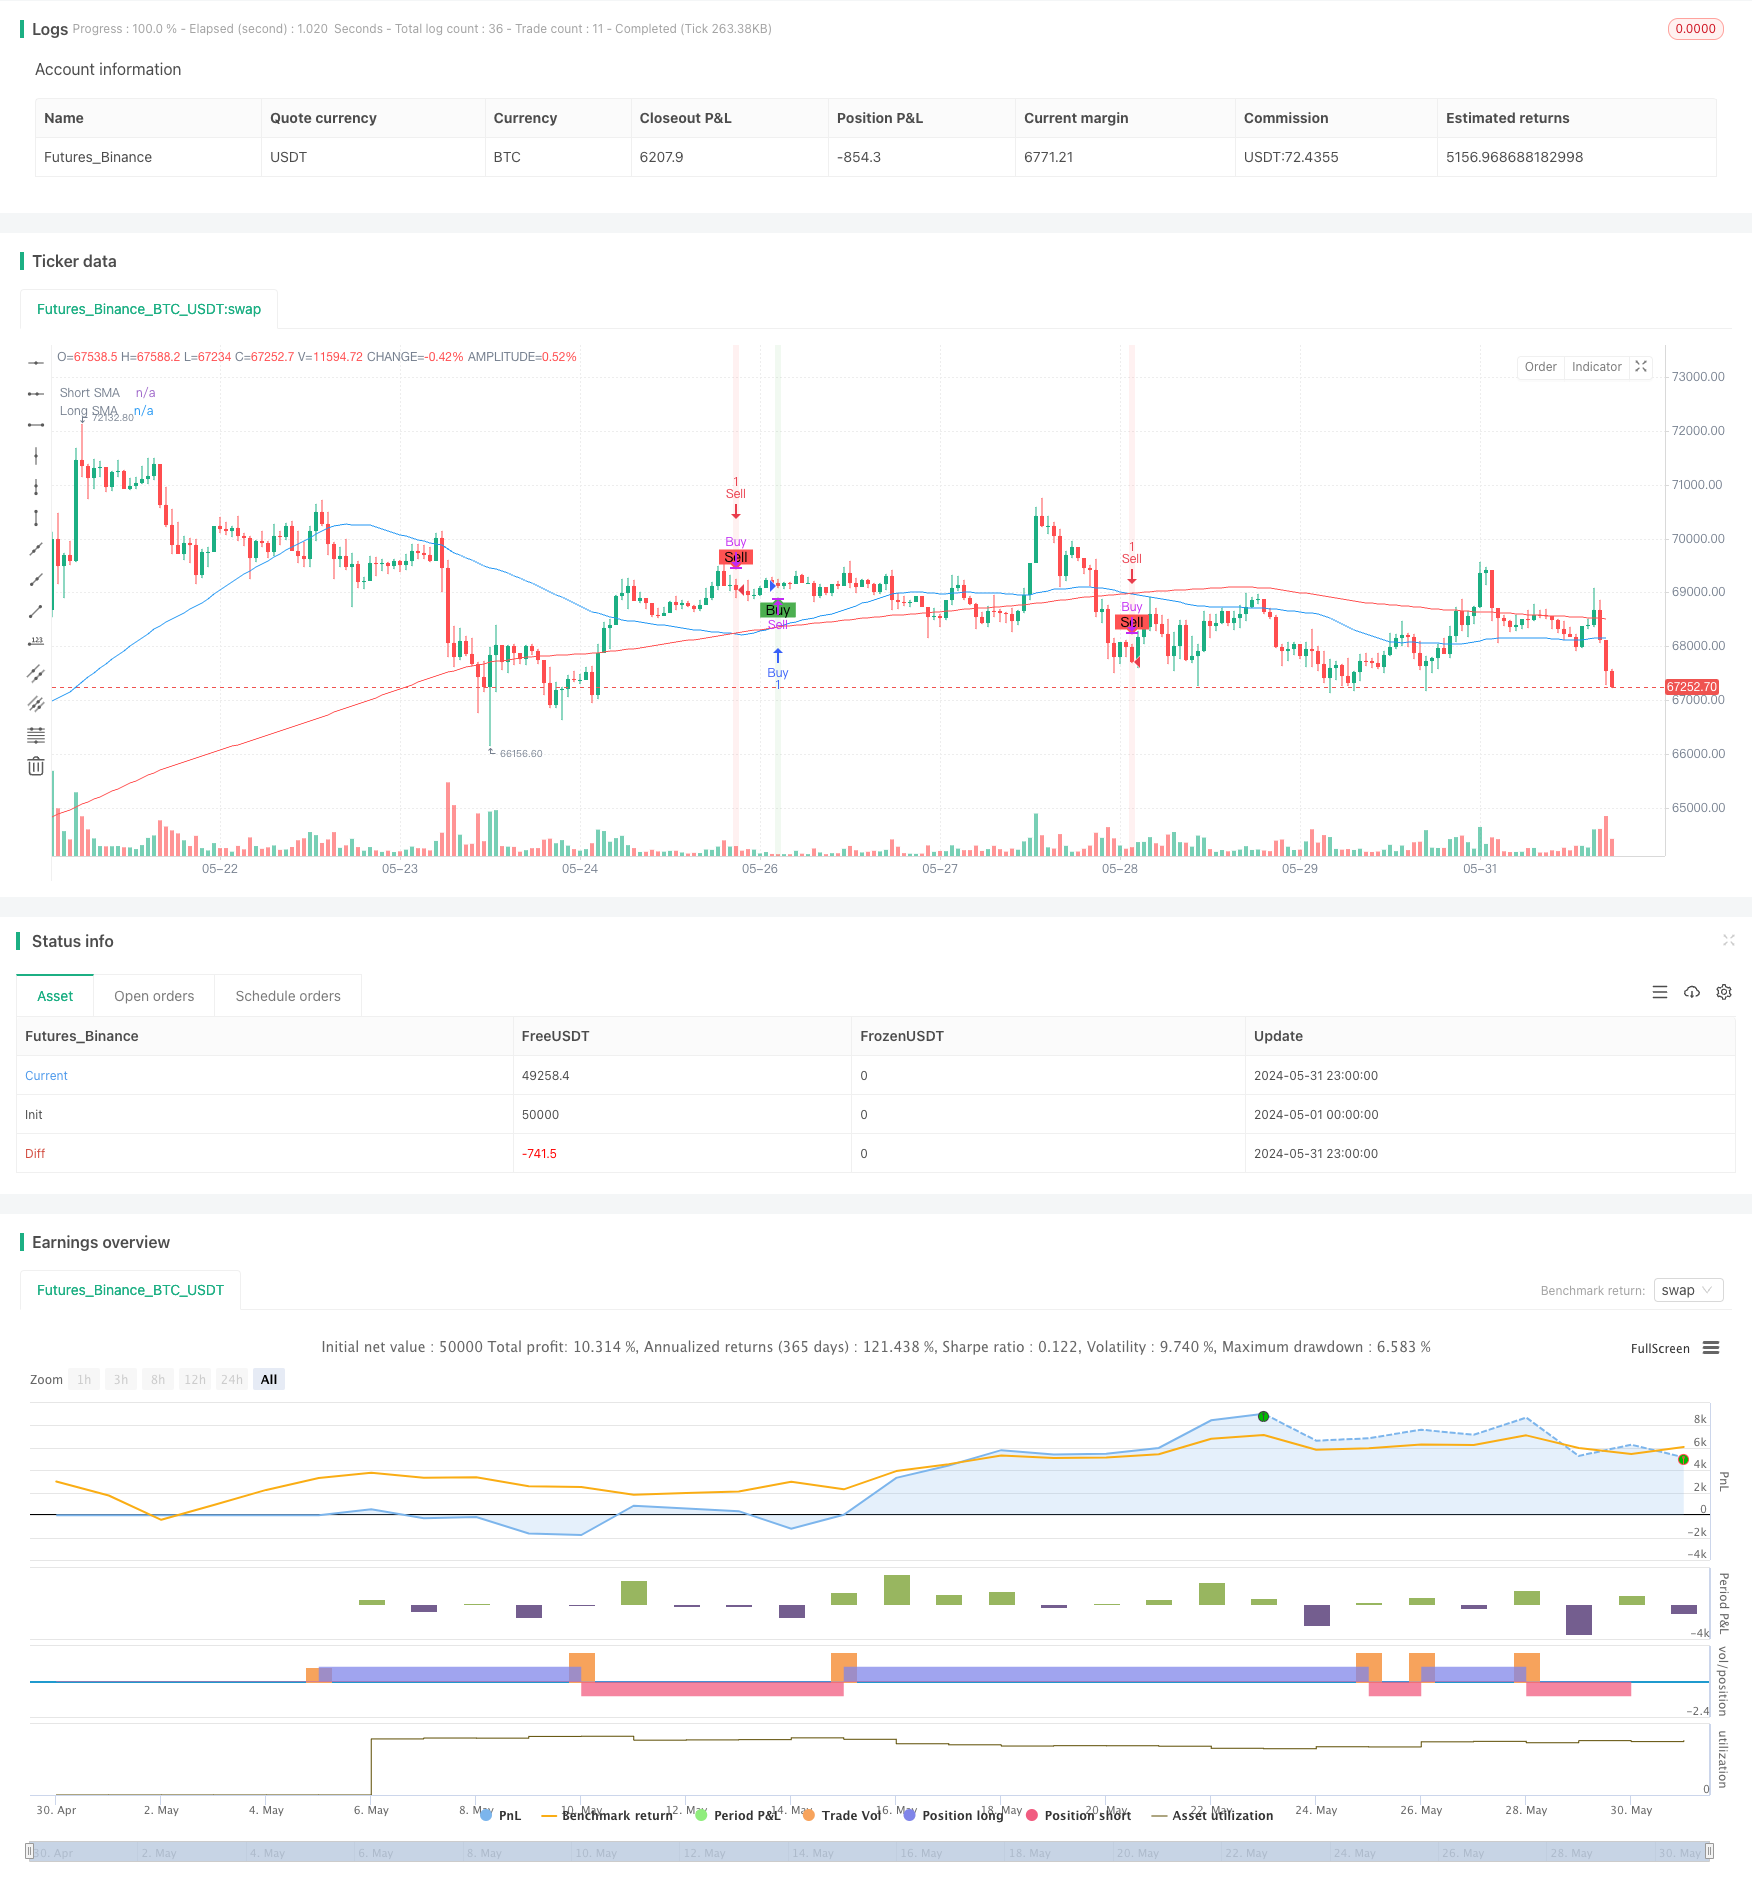
/*backtest
start: 2024-05-01 00:00:00
end: 2024-05-31 23:59:59
period: 1h
basePeriod: 15m
exchanges: [{"eid":"Futures_Binance","currency":"BTC_USDT"}]
*/

//@version=5
strategy("SMA Crossover with RSI Filter and Alerts", shorttitle="SMA Crossover RSI Alerts", overlay=true)

// Define input parameters for the lengths of the short and long SMAs
shortSMA = input(50, title="Short SMA Length")
longSMA = input(200, title="Long SMA Length")

// Define input parameters for RSI
rsiLength = input(14, title="RSI Length")
rsiOverbought = input(70, title="RSI Overbought Level")
rsiOversold = input(30, title="RSI Oversold Level")

// Define input parameters for risk management
stopLossPct = input.float(1.0, title="Stop Loss (%)")
takeProfitPct = input.float(2.0, title="Take Profit (%)")

// Calculate the short and long SMAs using the closing prices
smaShort = ta.sma(close, shortSMA)
smaLong = ta.sma(close, longSMA)

// Calculate the RSI
rsi = ta.rsi(close, rsiLength)

// Generate buy and sell signals based on crossovers and RSI confirmation
buySignal = ta.crossover(smaShort, smaLong) and rsi < rsiOverbought
sellSignal = ta.crossunder(smaShort, smaLong) and rsi > rsiOversold

// Plot the short and long SMAs on the chart
plot(smaShort, color=color.blue, title="Short SMA")
plot(smaLong, color=color.red, title="Long SMA")

// Calculate stop loss and take profit prices
stopLoss = strategy.position_avg_price * (1 - stopLossPct / 100)
takeProfit = strategy.position_avg_price * (1 + takeProfitPct / 100)

// Highlight candles with special colors when buy or sell signals are generated
bgcolor(buySignal ? color.new(color.green, 90) : na)
bgcolor(sellSignal ? color.new(color.red, 90) : na)

// Plot the buy and sell signals on the chart with labels
plotshape(series=buySignal, location=location.belowbar, color=color.green, style=shape.labelup, text="Buy")
plotshape(series=sellSignal, location=location.abovebar, color=color.red, style=shape.labeldown, text="Sell")

// Execute the strategy by entering long or short positions based on the signals
if (buySignal)
    strategy.entry("Buy", strategy.long, stop=stopLoss, limit=takeProfit)
if (sellSignal)
    strategy.entry("Sell", strategy.short, stop=stopLoss, limit=takeProfit)

// Close positions when the opposite signal is generated
if (sellSignal)
    strategy.close("Buy")
if (buySignal)
    strategy.close("Sell")

// Add alerts for buy and sell signals
alertcondition(buySignal, title="Buy Signal", message="SMA Crossover Buy Signal")
alertcondition(sellSignal, title="Sell Signal", message="SMA Crossover Sell Signal")

// Trigger sound alerts for buy and sell signals
if (buySignal)
    alert("SMA Crossover Buy Signal", alert.freq_once_per_bar_close)
if (sellSignal)
    alert("SMA Crossover Sell Signal", alert.freq_once_per_bar_close)
- Intraday BUY/SELL
- Triple Relative Strength Index Quantitative Trading Strategy
- Dynamic Stop-Loss and Take-Profit Dual Moving Average Trend Following Strategy with Candlestick Reactions
- Bollinger Bands RSI Neutral Market Quantitative Trading Strategy
- RSI Trend Momentum Trading Strategy with Dual MA and Volume Confirmation
- RSI2 Strategy Intraday Reversal Win Rate Backtest
- Relative Strength Index Mean Reversion Strategy
- Multi-Moving Average Momentum Trend Following Strategy
- Bollinger Bands RSI Trading Strategy
- Trend Filtered Pin Bar Reversal Strategy
- Double Supertrend Multi-Step Trailing Take-Profit Strategy
- Custom Signal Oscillator Strategy (CSO)
- Multi-Level RSI Mean Reversion Strategy with Dynamic Volatility Adjustment
- Bollinger Bands Momentum Crossover Strategy
- Super Triple Indicator RSI-MACD-BB Momentum Reversal Strategy
- CCI Momentum Divergence Trend Trading Strategy
- Hilo Activator MACD Dynamic Stop-Loss Take-Profit Trading Strategy
- Dynamic Take-Profit and Stop-Loss Dual Moving Average Crossover Trading Strategy
- RSI Dual-Period Moving Average Reversal Strategy with Dynamic Risk Management System
- Markov Chain Probability Transition State Quantitative Trading Strategy
- Dynamic Donchian Channel and Simple Moving Average Combination Quantitative Strategy
- Dynamic Fibonacci Retracement Trading Strategy
- Bollinger Bands and Exponential Moving Average Crossover Trading Strategy
- EMA and Supertrend Combination Quantitative Trading Strategy
- EMA, RSI, TA, Multi-Indicator Trading Strategy
- SUPERTREND Trend-following Long Position with Stop-loss and Take-profit Strategy
- Trend Following Adaptive Expected Value Assessment Strategy Based on Crossover Moving Averages
- EMA Bullish Crossover Strategy
- EMA Dynamic Stop-Loss Trading Strategy
- RSI, MACD, Bollinger Bands and Volume-Based Hybrid Trading Strategy