Double-Smoothed Heiken Ashi Trend Following Strategy
Author: ChaoZhang, Date: 2024-07-29 16:02:27Tags: HAEMA
Overview
The Double-Smoothed Heiken Ashi Trend Following Strategy is a quantitative trading approach focused on capturing upward market trends. This strategy combines a modified version of Heiken Ashi candlestick technique with double smoothing using Exponential Moving Averages (EMAs), aiming to provide clearer trend signals while reducing market noise. This method is particularly suitable for market environments with strong, sustained trends, helping traders better capture long-term bullish movements.
Strategy Principles
Heiken Ashi Modification: The strategy begins by calculating Heiken Ashi candlesticks, but unlike the traditional method, it uses Exponential Moving Averages (EMAs) of open, high, low, and close prices to construct the modified Heiken Ashi candles.
Double Smoothing Process: The strategy applies two layers of smoothing. The first layer uses EMAs in calculating Heiken Ashi values, and the second layer applies another EMA to the Heiken Ashi open and close prices. This double smoothing aims to further reduce market noise and provide clearer trend signals.
Long-Only Strategy: The strategy focuses on capturing upward trends, only engaging in long trades. During downward trends, the strategy closes existing long positions rather than taking short positions.
Entry and Exit Conditions:
- Entry (Buy): When the color of the smoothed Heiken Ashi candlestick changes from red to green (indicating the potential start of an uptrend).
- Exit (Sell): When the color of the smoothed Heiken Ashi candlestick changes from green to red (indicating the potential end of an uptrend).
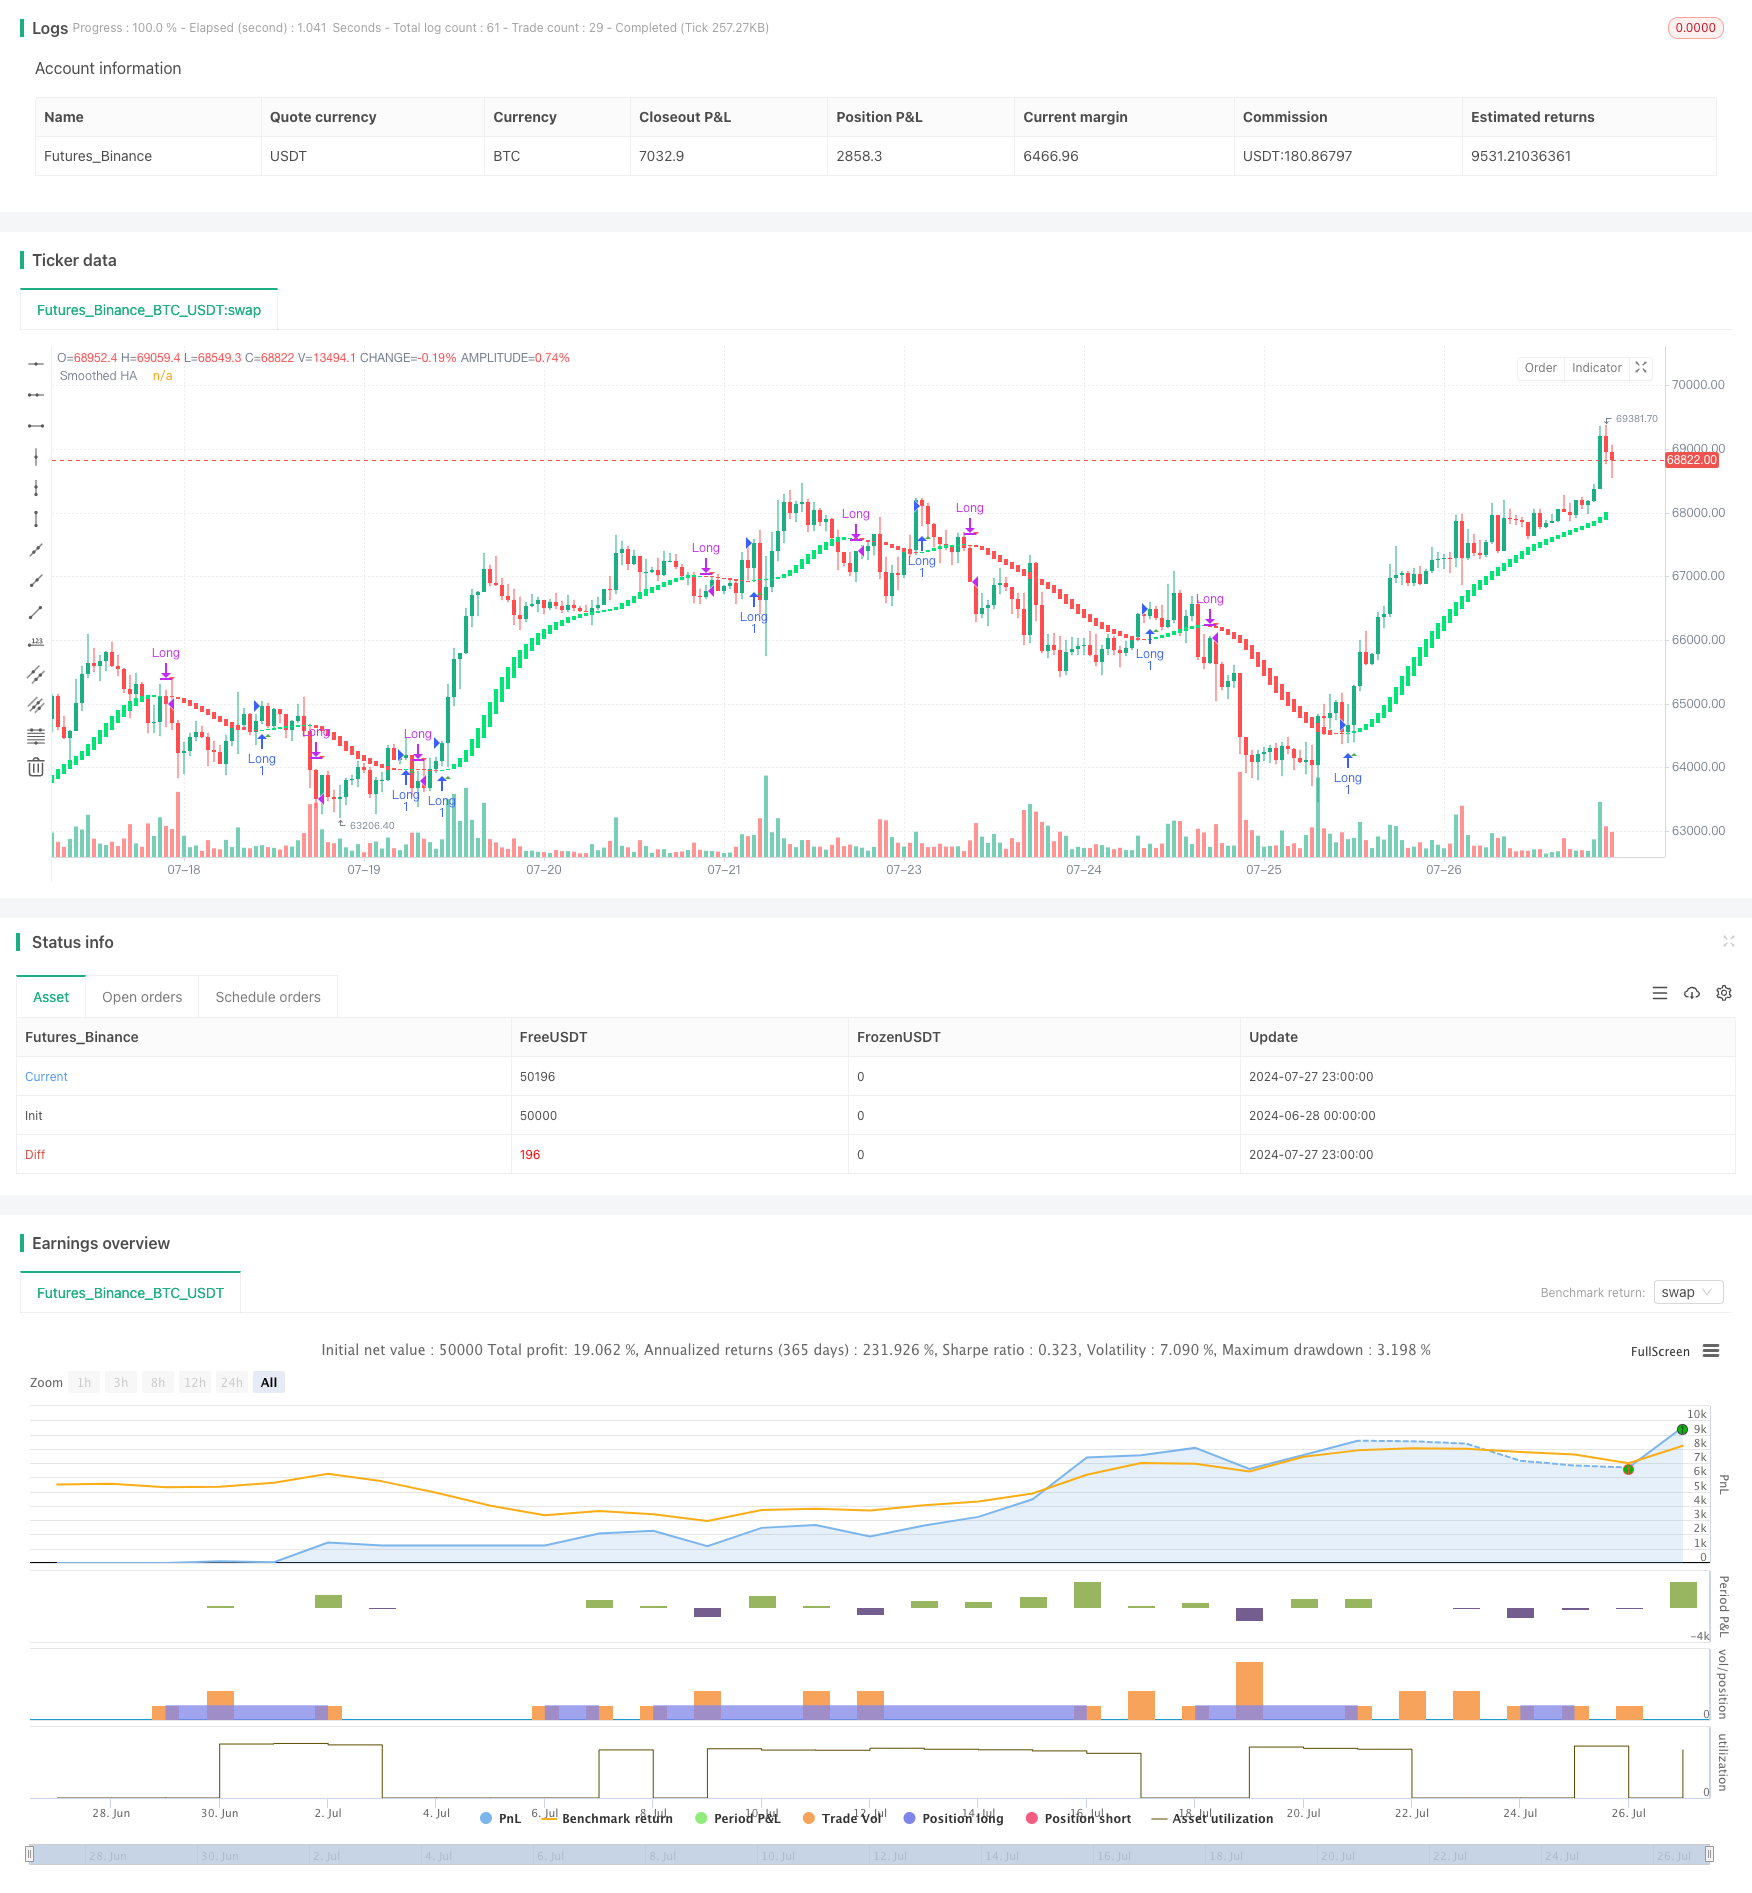
Visual Aids: The strategy plots modified Heiken Ashi candlesticks on the chart, with red representing downtrends and green representing uptrends. Additionally, the strategy displays triangle-shaped markers on the chart to indicate buy and sell signals, appearing after the candle closes to ensure signal reliability.
Position Management: The strategy employs a position sizing method based on account equity percentage, defaulting to 100% of available equity per trade.
Strategy Advantages
Strong Trend Following Capability: By using modified Heiken Ashi candlesticks and double smoothing, the strategy can effectively identify and follow strong market trends, especially suitable for trending markets.
Reduced Noise Impact: The double smoothing process helps filter out short-term market fluctuations and false breakouts, making trend signals clearer and more reliable.
Visual Intuitiveness: The strategy provides clear visual indications, including color-coded candlesticks and buy/sell signal markers, allowing traders to quickly assess market conditions and potential trading opportunities.
High Flexibility: The strategy allows users to adjust EMA length parameters, enabling optimization for different trading instruments and time frames.
Risk Management: Through its long-only approach and equity percentage-based position sizing, the strategy incorporates certain risk control mechanisms.
Automated Trading: The strategy can be easily implemented for automated trading, reducing emotional interference and improving execution efficiency.
Strategy Risks
Lag: Due to the use of double smoothing, the strategy may react slowly at trend reversal points, leading to slightly delayed entries and exits.
Poor Performance in Ranging Markets: In sideways or trendless market environments, the strategy may generate frequent false signals, resulting in overtrading and unnecessary losses.
Single Direction Risk: As a long-only strategy, it may miss potential short-selling opportunities in consistently declining markets, affecting overall returns.
Over-reliance on Single Indicator: The strategy primarily relies on Heiken Ashi candlesticks and EMAs, lacking supplementary technical indicators or fundamental analysis, which may overlook other important market information.
Parameter Sensitivity: Strategy performance may be sensitive to the choice of EMA length parameters, potentially requiring frequent adjustments under different market conditions.
Drawdown Risk: In sharp corrections following strong uptrends, the strategy may not be able to cut losses in time, leading to significant drawdowns.
Strategy Optimization Directions
Introduce Additional Indicators: Consider adding other technical indicators such as Relative Strength Index (RSI) or Moving Average Convergence Divergence (MACD) to provide additional trend confirmation and potential overbought/oversold signals.
Optimize Entry and Exit Logic: Experiment with more complex conditions, such as requiring several consecutive candles to confirm trend changes, or incorporating volume information to enhance signal reliability.
Dynamic Parameter Adjustment: Implement adaptive EMA lengths that automatically adjust smoothing parameters based on market volatility to adapt to different market environments.
Add Stop Loss and Take Profit Mechanisms: Introduce trailing stops or volatility-based dynamic stop losses to better control risk and lock in profits.
Incorporate Market State Filtering: Develop a market state identification module to automatically reduce trading frequency or pause trading in ranging markets to minimize false signals.
Multi-Timeframe Analysis: Combine information from longer and shorter time frames to improve the accuracy and timeliness of trend judgments.
Integrate Fundamental Data: Consider incorporating relevant fundamental indicators or event-driven factors to enhance the strategy’s comprehensiveness.
Optimize Position Management: Implement more flexible position management strategies, such as risk-based position sizing adjustments or scaling-in techniques.
Conclusion
The Double-Smoothed Heiken Ashi Trend Following Strategy is an innovative quantitative trading method that provides traders with a unique trend-following tool by combining modified Heiken Ashi candlestick technique with double EMA smoothing. The strategy’s main advantages lie in its powerful trend capture capability and noise reduction effect, particularly suitable for market environments with clear trends.
However, the strategy also has inherent risks and limitations, such as signal lag and poor performance in ranging markets. To fully leverage the strategy’s potential and manage associated risks, traders should consider further optimizing and refining the strategy, such as introducing additional technical indicators, optimizing entry and exit logic, and implementing dynamic parameter adjustments.
Overall, the Double-Smoothed Heiken Ashi Trend Following Strategy offers a valuable research direction in the field of quantitative trading. Through continuous backtesting, optimization, and live trading verification, this strategy has the potential to become a reliable component of a trading system. However, when using this strategy, traders should still carefully consider market conditions, personal risk tolerance, and combine it with other analytical tools and risk management techniques to build a comprehensive and robust trading strategy.
/*backtest
start: 2024-06-28 00:00:00
end: 2024-07-28 00:00:00
period: 1h
basePeriod: 15m
exchanges: [{"eid":"Futures_Binance","currency":"BTC_USDT"}]
*/

//@version=5
strategy("Smoothed Heiken Ashi Strategy Long Only", overlay=true)

len = input.int(10, title="EMA Length")
len2 = input.int(10, title="Smoothing Length")

o = ta.ema(open, len)
c = ta.ema(close, len)
h = ta.ema(high, len)
l = ta.ema(low, len)
haclose = (o + h + l + c) / 4

var float haopen = 0.0
haopen := na(haopen[1]) ? (o + c) / 2 : (haopen[1] + haclose[1]) / 2
hahigh = math.max(h, math.max(haopen, haclose))
halow = math.min(l, math.min(haopen, haclose))

o2 = ta.ema(haopen, len2)
c2 = ta.ema(haclose, len2)
col = o2 > c2 ? 0 : 1 // 0 for red, 1 for lime

// Plotting candles without wicks
plotcandle(o2, o2, c2, c2, title="Smoothed HA", color=col == 0 ? color.red : color.lime)

// Strategy logic
longEntryCondition = col == 1 and col[1] == 0
longExitCondition = col == 0 and col[1] == 1

if (longEntryCondition)
    strategy.entry("Long", strategy.long)

if (longExitCondition)
    strategy.close("Long")

// Plotting signals after the close of the candle
plotshape(longEntryCondition, title="Buy Signal", location=location.belowbar, color=color.green, style=shape.triangleup, size=size.small, offset=1)
plotshape(longExitCondition, title="Sell Signal", location=location.abovebar, color=color.red, style=shape.triangledown, size=size.small, offset=1)
- Crossover Moving Average with Smoothed Candlestick Momentum Strategy
- Advanced Quantitative Trend Capture Strategy with Dynamic Range Filter
- Multi-Timeframe Heikin-Ashi Moving Average Trend Following Trading System
- Dynamic Dual EMA Crossover Quantitative Trading Strategy
- Multi-EMA Golden Cross Strategy with Tiered Take-Profit
- EMA TREND CLOUD
- Ichimoku Cloud Smooth Oscillator
- TrendScalp-FractalBox-3EMA
- Dual EMA Momentum Trend Trading Strategy with Full Body Candle Signal System
- EMA Crossover with Short-term Signals Strategy
- Precision Trading Strategy and Risk Management System Based on SuperTrend Indicator
- EMA, RSI, Volume-Price Trend, Engulfing Pattern
- Magic Channel Price Action Trading Strategy
- Multi-Indicator Options Trading Strategy
- Dual Moving Average Mean Reversion Strategy with Risk Control
- Dual Moving Average Trend Following Strategy with RSI Filter
- Multi-EMA Crossover with Fibonacci Extension Trend Following Strategy
- Multi-EMA Crossover Stop Strategy
- Adaptive Momentum Trading Strategy with SMA Crossover and SuperTrend
- Weighted Moving Average and Relative Strength Index Crossover Strategy with Risk Management Optimization System
- RSI Reversal Cross Momentum Profit Target Quantitative Trading Strategy
- Multi-Indicator Adaptive Trend Following Strategy
- Multi-Indicator Comprehensive Trading Strategy: Perfect Combination of Momentum, Overbought/Oversold, and Volatility
- High-Precision RSI and Bollinger Bands Breakout Strategy with Optimized Risk-Reward Ratio
- Advanced EMA Crossover Strategy: Adaptive Trading System with Dynamic Stop-Loss and Take-Profit Targets
- EMA Crossover with Dual Take Profit and Stop Loss Strategy
- Multi-Timeframe Hull Moving Average Crossover Strategy
- Dynamic Trailing Stop Dual Target Moving Average Crossover Strategy
- Dynamic Adaptive Momentum Breakout Strategy
- Adaptive Moving Average Crossover with Trailing Stop-Loss Strategy