Overview
The “Multi-Indicator Trend Following Strategy” is a sophisticated and comprehensive trend-following approach to trading. It combines the Relative Strength Index (RSI) with multiple periods of Exponential Moving Averages (EMAs) to identify market trends and generate trading signals. The core of this strategy lies in its simultaneous use of short-term momentum indicators and long-term trend indicators to capture market movements across different timeframes.
Strategy Principles
The strategy operates based on the following key principles:
RSI Signals: Utilizes a 3-period RSI as a short-term momentum indicator. RSI above 80 is considered overbought, while below 20 is oversold.
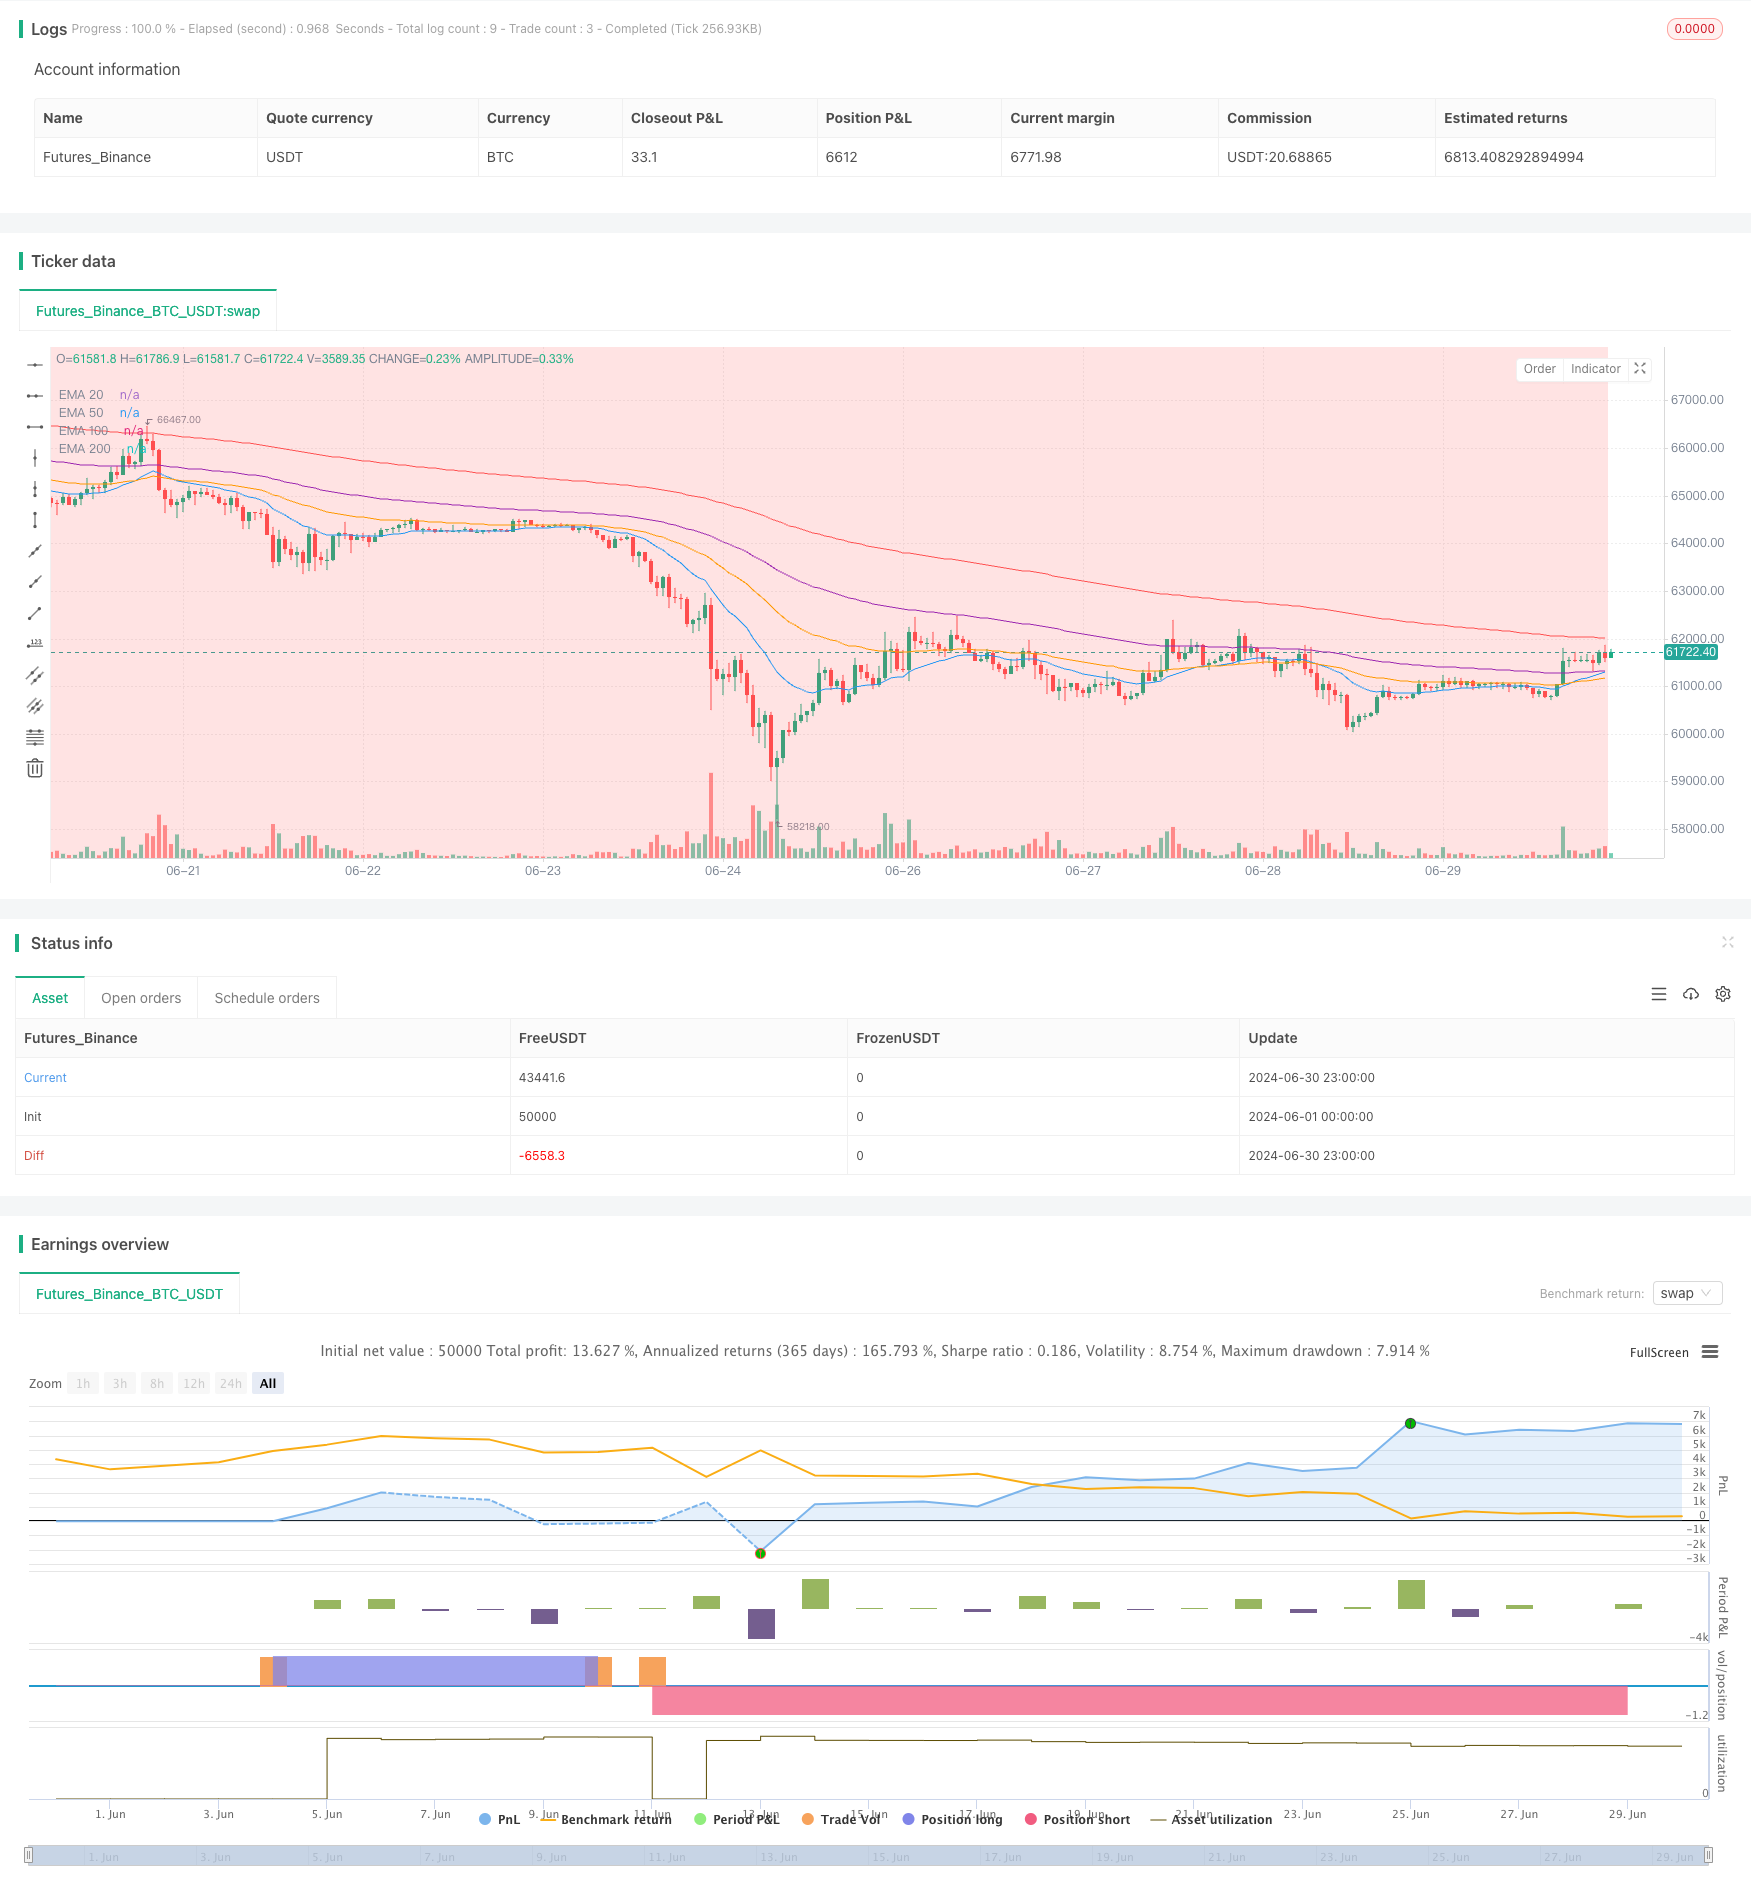
EMA Trend Confirmation: Uses 20, 50, 100, and 200-period EMAs to confirm long-term trends. An uptrend is identified when these EMAs are aligned in the order 20 > 50 > 100 > 200; the reverse order indicates a downtrend.
Entry Signals:
- Long Signal: Triggered when RSI > 80 and EMAs are in uptrend alignment.
- Short Signal: Triggered when RSI < 20 and EMAs are in downtrend alignment.
Exit Signals:
- Long Exit: Triggered when the 50-period EMA crosses below the 200-period EMA or RSI falls below 30.
- Short Exit: Triggered when the 50-period EMA crosses above the 200-period EMA or RSI rises above 70.
Persistence Confirmation: The strategy requires signals to remain consistent for at least 3 periods to avoid false signals.
Visualization: Uses background colors to mark bullish and bearish periods and plots all EMA lines on the chart.
Strategy Advantages
Multi-dimensional Analysis: Combines short-term momentum (RSI) and long-term trend (EMA) indicators for a more comprehensive market perspective.
Trend Confirmation: Utilizes multiple EMA crossovers to confirm trends, reducing the risk of false breakouts.
Flexible Parameter Settings: Allows users to adjust RSI length and thresholds based on personal preferences and market conditions.
Visual Aids: Provides intuitive market state visualization through background colors and EMA lines for quick assessment.
Dynamic Stop-Loss: Uses EMA crossovers and RSI reversals as stop-loss points, adapting to market changes.
Signal Persistence Requirement: Filters out noise by requiring signals to persist for multiple periods, enhancing reliability.
Bi-directional Trading: Capable of capturing opportunities in both bullish and bearish markets.
Strategy Risks
Lag: Both EMAs and RSI are lagging indicators, potentially slow to react in rapidly reversing markets.
Poor Performance in Ranging Markets: May generate frequent false signals in sideways or choppy markets.
Over-reliance on Technical Indicators: Ignores fundamental factors and other market influences.
Parameter Sensitivity: Different RSI and EMA parameter settings can lead to vastly different results.
Potential for Overtrading: May lead to excessive trading and increased transaction costs under certain market conditions.
Fixed Threshold Limitations: Fixed RSI thresholds may become ineffective as market volatility changes.
Lack of Risk Management: The strategy lacks explicit stop-loss and profit target settings.
Strategy Optimization Directions
Adaptive Parameters: Introduce adaptive mechanisms to dynamically adjust RSI and EMA parameters based on market volatility.
Additional Filters: Incorporate volume, volatility, or other supplementary indicators to improve signal quality.
Improved Exit Mechanisms: Design more sophisticated profit targets and stop-loss strategies, such as using the Average True Range (ATR).
Multiple Timeframe Analysis: Validate signals across multiple timeframes to increase accuracy.
Fundamental Factor Integration: Incorporate economic calendar events or news to filter out potentially high-risk trades.
Execution Logic Optimization: Consider using limit orders instead of market orders for better entry prices.
Backtesting and Optimization: Conduct extensive historical data backtesting to find optimal parameter combinations.
Machine Learning Integration: Utilize machine learning algorithms to optimize parameter selection and signal generation processes.
Conclusion
The “Multi-Indicator Trend Following Strategy” is a complex trading system that leverages RSI and multiple EMAs. It aims to capture persistent trends across various market environments by combining short-term momentum and long-term trend indicators. The strategy’s strengths lie in its multi-dimensional analysis approach and flexible parameter settings, but it also faces risks of lag and over-reliance on technical indicators. To further enhance strategy performance, considerations should be given to introducing adaptive parameters, improving risk management mechanisms, and integrating more market factors. Overall, this is a promising strategy framework that, with continuous optimization and thorough backtesting, has the potential to perform well in real trading scenarios.
/*backtest
start: 2024-06-01 00:00:00
end: 2024-06-30 23:59:59
period: 1h
basePeriod: 15m
exchanges: [{"eid":"Futures_Binance","currency":"BTC_USDT"}]
*/

// Bu Pine Script™ kodu, Mozilla Public License 2.0 koşullarına tabidir: https://mozilla.org/MPL/2.0/
// © akadal

//@version=5
strategy("Trendy Strategy", overlay=true)

// Ayarlanabilir parametreler
rsiLength = input.int(3, title="RSI Length")
longThreshold = input.int(80, title="Long RSI Threshold")
shortThreshold = input.int(20, title="Short RSI Threshold")

ema20 = ta.ema(close, 20)
ema50 = ta.ema(close, 50)
ema100 = ta.ema(close, 100)
ema200 = ta.ema(close, 200)
rsi = ta.rsi(close, rsiLength)

// Long sinyal koşulu
longSignal = rsi > longThreshold and ema20 > ema50 and ema50 > ema100 and ema100 > ema200

// Short sinyal koşulu
shortSignal = rsi < shortThreshold and ema20 < ema50 and ema50 < ema100 and ema100 < ema200

// Longtayken stop sinyali: EMA 50'nin EMA 200'nin altına düşmesi veya RSI'nin 30'un altına düşmesi
longStopSignal = ta.barssince(ema50 < ema200) <= 2 and rsi < 30

// Shorttayken stop sinyali: EMA 50'nin EMA 200'nin üstüne çıkması veya RSI'nin 70'in üstüne çıkması
shortStopSignal = ta.barssince(ema50 > ema200) <= 2 and rsi > 70

// Sinyallerin art arda ne kadar süredir true olduğunu tutan değişkenler
longConditionMet = ta.barssince(longSignal) <= 2
shortConditionMet = ta.barssince(shortSignal) <= 2

// Trend durumlarını izlemek için değişkenler
var bool inLong = false
var bool inShort = false

if (longConditionMet and not inLong)
    inLong := true
    inShort := false
    strategy.entry("Long", strategy.long)
else if (shortConditionMet and not inShort)
    inShort := true
    inLong := false
    strategy.entry("Short", strategy.short)
else if (inLong and longStopSignal)
    inLong := false
    strategy.close("Long")
else if (inShort and shortStopSignal)
    inShort := false
    strategy.close("Short")

// Grafik üzerinde long ve short dönemlerini işaretleme
bgcolor(inLong ? color.new(color.green, 80) : na)
bgcolor(inShort ? color.new(color.red, 80) : na)

// EMA'ları grafik üzerinde gösterme
plot(ema20, title="EMA 20", color=color.blue)
plot(ema50, title="EMA 50", color=color.orange)
plot(ema100, title="EMA 100", color=color.purple)
plot(ema200, title="EMA 200", color=color.red)