Multi-Confirmation Reversal Buy Strategy
Author: ChaoZhang, Date: 2024-07-30 12:06:29Tags: RSIMA
Overview
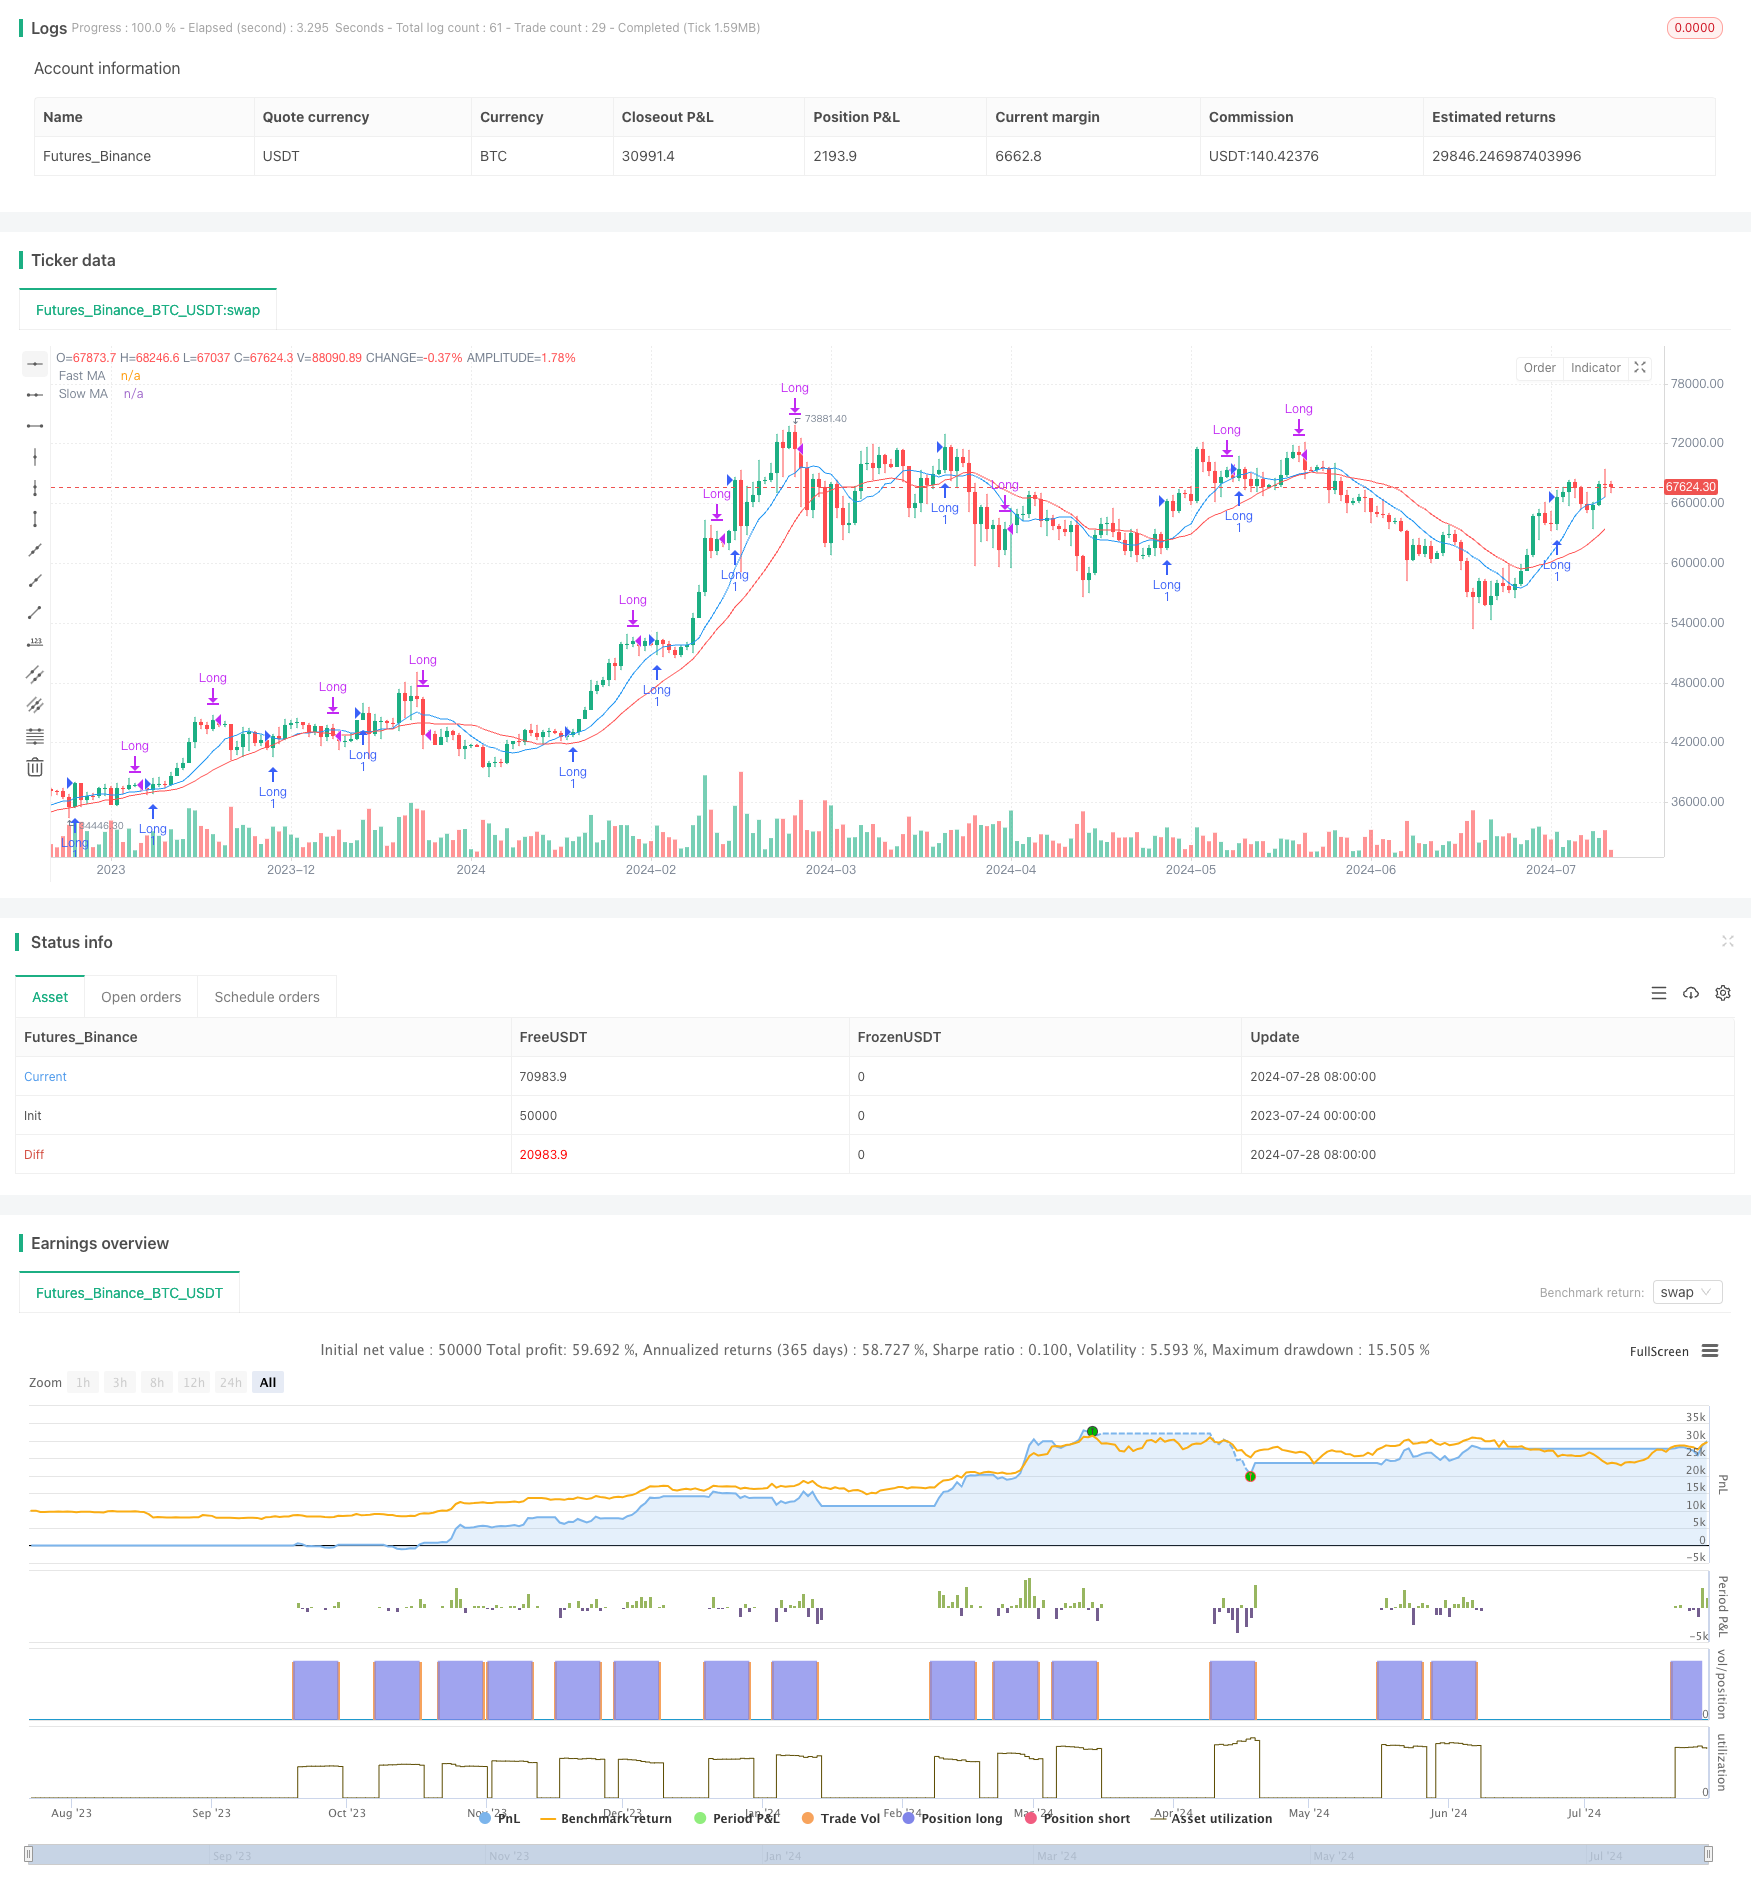
The Multi-Confirmation Reversal Buy Strategy is a quantitative trading approach focused on entry, designed to capture rebound opportunities after market downturns. This strategy integrates price action, technical indicators, and volume analysis to confirm market bottom reversal signals, thereby reducing the risk of premature entry during downtrends. The core idea is to use multiple screening conditions to ensure that buying occurs only when clear signs of market reversal are present, thus improving the success rate and profitability of trades.
Strategy Principles
The strategy operates based on the following key steps:
Price Reversal Confirmation: The strategy first checks if the current candlestick is bullish (closing price higher than opening price), which is an initial signal of potential market reversal.
Recent High Breakout: By comparing the current closing price with the highest closing price over the past few periods (adjustable lookback period), it confirms whether the price has broken above recent highs, helping to verify the formation of an uptrend.
Momentum Indicator Confirmation: The Relative Strength Index (RSI) is used to measure price momentum. When the RSI value exceeds 50, it indicates that momentum is shifting upward, supporting an uptrend.
Moving Average Crossover: The strategy requires the price to be above the fast moving average, and the fast moving average to be above the slow moving average. This “golden cross” formation is typically viewed as a confirmation signal for an uptrend.
Increasing Volume: By comparing the current volume with the recent average volume, it confirms whether volume is increasing. Increasing volume is generally considered strong support for price movements.
Comprehensive Judgment: Only when all the above conditions are met simultaneously does the strategy generate a buy signal and execute a long entry.
Fixed Holding Period Exit: The strategy employs a simple fixed holding period exit mechanism, automatically closing the position on the 10th bar after entry, realizing profits or limiting losses.
Strategy Advantages
Multiple Confirmation Mechanism: By combining price action, technical indicators, and volume analysis, the strategy significantly reduces the risk of misjudging market bottoms, improving the accuracy of entry timing.
Trend-Following Characteristic: The strategy design ensures entry only when a clear uptrend is formed, helping to capture profits from major trends.
Flexibility: Multiple parameters in the strategy (such as lookback period, moving average periods) can be optimized and adjusted for different markets and trading instruments, providing good adaptability.
Risk Control: By waiting for multiple confirmation signals, the strategy effectively reduces the risk of premature entry during downtrends, enhancing trading safety.
Automated Execution: The strategy can be programmed as an automated trading system, reducing emotional interference and improving execution efficiency.
Objectivity: Based on clear mathematical models and technical indicators, the strategy eliminates the influence of subjective judgment, maintaining consistency and objectivity in trading decisions.
Strategy Risks
Lag Risk: As the strategy requires waiting for multiple confirmation signals, it may miss some rapid reversal opportunities, leading to relatively delayed entry timing.
False Breakout Risk: In oscillating markets, situations may occur where all conditions are met but prices subsequently fall back, causing short-term losses.
Limitations of Fixed Exit Mechanism: Using a fixed exit after 10 bars may not fully capitalize on major trends and might not stop losses timely if the market quickly reverses.
Over-reliance on Technical Indicators: The strategy is entirely based on technical analysis, ignoring the influence of fundamental factors, which may perform poorly in markets driven by significant news or events.
Parameter Sensitivity: The strategy’s performance is highly dependent on parameter settings; inappropriate parameter selection may significantly reduce the strategy’s effectiveness.
Market Environment Dependency: This strategy performs well in clearly trending markets but may be less effective in long-term sideways or highly volatile markets.
Strategy Optimization Directions
Dynamic Exit Mechanism: Introduce a dynamic stop-loss and take-profit mechanism based on market volatility to replace the fixed-period exit, better adapting to different market environments.
Add Volatility Filter: Include consideration of market volatility in entry conditions to avoid frequent trading in excessively volatile markets.
Multi-Timeframe Analysis: Incorporate analysis of longer timeframes to ensure entry direction aligns with larger trends, improving strategy stability.
Optimize Indicator Parameters: Through historical data backtesting, find the optimal combination of indicator parameters, such as RSI period, moving average periods, etc.
Introduce Machine Learning Algorithms: Utilize machine learning techniques to comprehensively weigh multiple indicators, potentially improving the strategy’s predictive accuracy.
Add Fundamental Filters: Consider introducing some fundamental indicators or event-driven factors to make the strategy more comprehensive in assessing market conditions.
Diversified Application: Consider applying the strategy simultaneously across multiple uncorrelated trading instruments to diversify risk and improve overall stability.
Conclusion
The Multi-Confirmation Reversal Buy Strategy is a quantitative trading method aimed at capturing market bottom reversal opportunities. By comprehensively utilizing price action, technical indicators, and volume analysis, this strategy effectively reduces the risk of incorrect entries and improves the success rate of trades. The strategy’s multiple confirmation mechanisms and trend-following characteristics give it good performance potential in markets with clear trends. However, the strategy also has certain lag and false breakout risks, requiring traders to deal with them cautiously.
Through the introduction of dynamic exit mechanisms, multi-timeframe analysis, and machine learning algorithms, among other optimization directions, this strategy has the potential to further enhance its adaptability and stability across different market environments. Overall, this is a clearly structured and logically rigorous quantitative trading strategy, providing traders with a systematic method to capture market reversal opportunities. However, like all trading strategies, it still requires careful parameter adjustment and risk management in practical application, combined with personal risk preferences and market experience.
//@version=5
strategy("Buy After Dip Strategy (Arbitrary Exit) [nn1]", overlay=true)

// Parameters
lookback = input.int(3, "Lookback Period")
maFast = input.int(10, "Fast MA Period")
maSlow = input.int(20, "Slow MA Period")

// Calculate indicators
fastMA = ta.sma(close, maFast)
slowMA = ta.sma(close, maSlow)
rsi = ta.rsi(close, 14)

// Function to check if candle is bullish
isBullish = close > open

// Function to check if current close is highest in lookback period
isHighestClose = close == ta.highest(close, lookback)

// Check for increasing volume
volumeIncreasing = volume > ta.sma(volume, 5)

// Entry conditions
entryCondition = isBullish and isHighestClose and rsi > 50 and close > fastMA and fastMA > slowMA and volumeIncreasing

// Plot moving averages
plot(fastMA, "Fast MA", color.blue)
plot(slowMA, "Slow MA", color.red)

// Entry logic
if (entryCondition)
    strategy.entry("Long", strategy.long)

// Arbitrary Exit Logic: Exit 10 bars later
if (ta.barssince(strategy.position_size == 0) >= 10)
    strategy.close("Long")
- Momentum Trend Ichimoku Cloud Trading Strategy
- Dual-Period RSI Trend Momentum Strategy with Pyramiding Position Management System
- Best TradingView Strategy
- Advanced Dynamic Fibonacci Retracement Trend Quantitative Trading Strategy
- RSI Dynamic Drawdown Stop-Loss Strategy
- MA, SMA, MA Slope, Trailing Stop Loss, Re-Entry
- Dynamic RSI Oversold Rebound Trading Strategy with Stop-Loss Optimization Model
- Short-Term Trading Strategy Based on Bollinger Bands, Moving Average, and RSI
- Moving Average and Relative Strength Index Strategy
- Multi-Moving Average Momentum Trend Following Strategy
- Dynamic Trend-Following Trading Strategy Based on Gann Angles
- VWAP-ATR Trend Following and Price Reversal Strategy
- Bollinger Bands RSI Neutral Market Quantitative Trading Strategy
- Multi-Level Oversold Oscillator Buy Strategy
- Adaptive Trend Following Strategy Combining AlphaTrend and KAMA with Risk Management
- Dual Indicator Cross-Confirmation Momentum Volume Quantitative Trading Strategy
- Dynamic Trend Following Strategy - Multi-Indicator Integrated Momentum Analysis System
- Multi-EMA and Supertrend Crossover Strategy
- Dynamic Mean Reversion and Momentum Strategy
- Dual EMA Dynamic Trend Capture Trading System
- Enhanced Dual EMA Pullback Breakout Trading Strategy
- Multi-Timeframe Exponential Moving Average Crossover Strategy
- Multi-Period Dynamic Channel Crossover Strategy
- Comprehensive Price Gap Short-Term Trend Capture Strategy
- Multi-Stochastic Oscillation and Momentum Analysis System
- Multi-Timeframe Moving Average and RSI Trend Trading Strategy
- Multi-Period Moving Average Crossover Trend Following Strategy
- Three-Week High-Low Momentum Trading Strategy
- Adaptive Moving Average Crossover Strategy
- Technical Indicator Strategy, Risk Management Strategy, Adaptive Trend Following Strategy