Multi-EMA Crossover Strategy with Trend Confirmation
Author: ChaoZhang, Date: 2024-07-31 11:08:14Tags: EMASMA
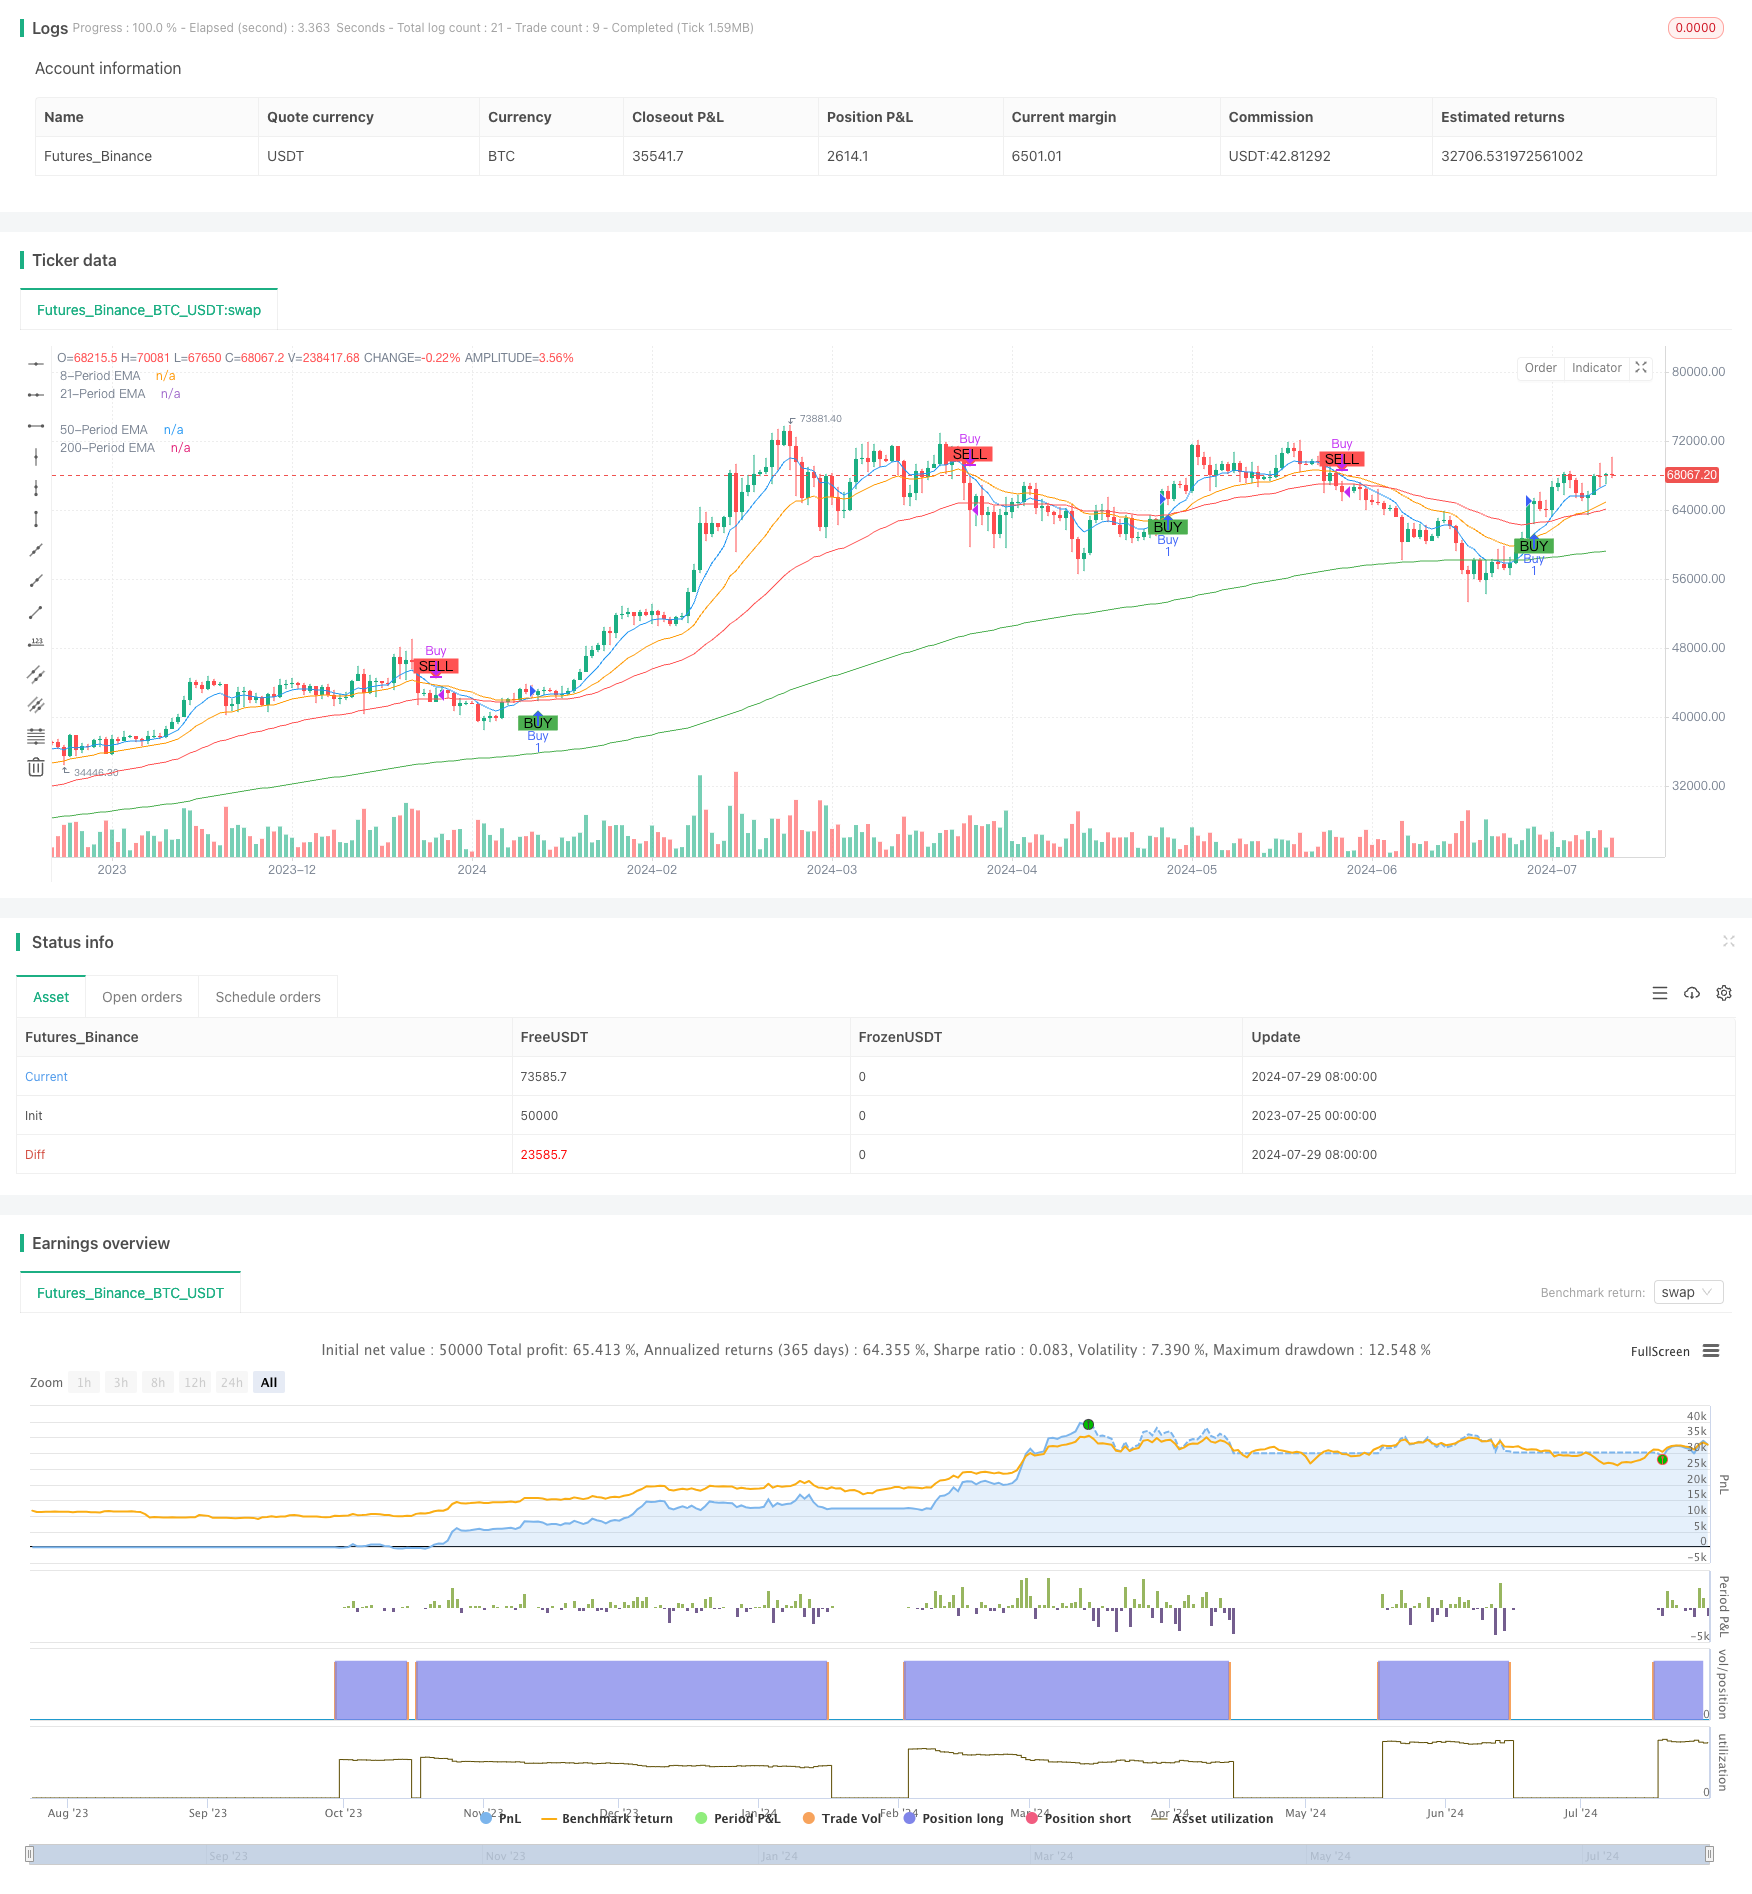
Overview
The Multi-EMA Crossover Strategy with Trend Confirmation is a trend-following trading system that combines multiple timeframe Exponential Moving Averages (EMAs). This strategy primarily uses the crossover of 8-period and 21-period EMAs to generate trading signals, while incorporating 50-period and 200-period EMAs to confirm the overall market trend. This approach aims to capture changes in medium to short-term trends while using longer-term averages to filter out false signals.
Strategy Principles
The core principles of this strategy are based on the following key elements:
Multiple EMA Crossovers: Utilizes the crossover of 8-period and 21-period EMAs as the main signal generation mechanism. A buy signal is generated when the 8 EMA crosses above the 21 EMA, and a sell signal when it crosses below.
Trend Confirmation: Incorporates 50-period and 200-period EMAs as long-term trend indicators. The strategy requires all shorter-term EMAs (8, 21, 50) to be above the 200 EMA, ensuring the overall market is in an uptrend.
Signal Confirmation: The strategy only confirms trading signals after the candle closes, helping to reduce risks from false breakouts.
Risk Management: The strategy employs a simple entry and exit logic, entering on buy signals and exiting on sell signals, without complex position sizing or stop-loss mechanisms.
Strategy Advantages
Trend Following Capability: By combining EMAs of multiple timeframes, the strategy can effectively capture market trend changes and adapt to different market environments.
False Signal Filtering: Using the long-term EMA (200-period) as a trend filter helps reduce erroneous signals in sideways or bearish markets.
Flexibility: Strategy parameters can be adjusted for different markets and trading instruments to adapt to varying volatility and trend characteristics.
Visualization: The strategy clearly marks buy and sell signals on the chart, allowing traders to intuitively understand market trends and trading opportunities.
Alert Functionality: Integrated trade signal alerts help traders capture market opportunities in a timely manner.
Strategy Risks
Lag: As a trend-following strategy, it may experience significant drawdowns during early trend reversals.
Poor Performance in Choppy Markets: In sideways, range-bound markets, it may generate frequent false signals leading to overtrading.
Lack of Stop-Loss Mechanism: The strategy does not set explicit stop-loss rules, potentially exposing to significant risks in extreme market conditions.
Over-reliance on EMAs: Sole dependence on EMAs may overlook other important market factors and indicators.
Parameter Sensitivity: Strategy performance may be sensitive to the choice of EMA periods, requiring careful optimization and backtesting.
Strategy Optimization Directions
Introduce Adaptive Parameters: Consider using adaptive EMA periods to better accommodate volatility changes under different market conditions.
Add Filters: Incorporate other technical indicators (such as RSI, MACD) as auxiliary filters to improve signal quality.
Enhance Risk Management: Introduce dynamic stop-loss and take-profit mechanisms, such as using ATR (Average True Range) to set stop-loss levels.
Optimize Position Management: Implement dynamic position sizing based on market volatility or trend strength.
Increase Market State Recognition: Develop algorithms to identify trending, ranging, and high-volatility markets, applying different trading strategies for different market states.
Multi-Timeframe Analysis: Integrate market information from more timeframes to improve the accuracy of trend judgments.
Backtesting and Optimization: Conduct extensive historical data backtesting to optimize parameters, balancing returns and risks.
Conclusion
The Multi-EMA Crossover Strategy with Trend Confirmation is a trend-following system that combines EMAs from multiple timeframes, capturing trading opportunities through short-term average crossovers while confirming overall trends with long-term averages. This strategy has the advantages of being simple to operate, easy to understand, and implement, suitable for tracking medium to long-term market trends. However, as a pure technical analysis strategy, it also faces challenges such as lag and underperformance in choppy markets.
To improve the strategy’s robustness and adaptability, consider introducing adaptive parameters, adding auxiliary indicators, enhancing risk management mechanisms, and developing more sophisticated market state recognition algorithms. Through these optimizations, the strategy has the potential to demonstrate better stability and profitability across different market environments.
Ultimately, successful application of this strategy requires traders to deeply understand its principles, carefully conduct parameter optimization and backtesting, and combine personal risk preferences and market insights to formulate a comprehensive trading plan.
/*backtest
start: 2023-07-25 00:00:00
end: 2024-07-30 00:00:00
period: 1d
basePeriod: 1h
exchanges: [{"eid":"Futures_Binance","currency":"BTC_USDT"}]
*/

//@version=5
strategy("Multi EMA Strategy with Alerts", overlay=true)

// Define input parameters for EMA lengths
ema8_length = input.int(8, title="8-Period EMA Length", minval=1)
ema21_length = input.int(21, title="21-Period EMA Length", minval=1)
ema50_length = input.int(50, title="50-Period EMA Length", minval=1)
ema200_length = input.int(200, title="200-Period EMA Length", minval=1)

// Calculate EMAs
ema8 = ta.ema(close, ema8_length)
ema21 = ta.ema(close, ema21_length)
ema50 = ta.ema(close, ema50_length)
ema200 = ta.ema(close, ema200_length)

// Plot EMAs
plot(ema8, color=color.blue, title="8-Period EMA")
plot(ema21, color=color.orange, title="21-Period EMA")
plot(ema50, color=color.red, title="50-Period EMA")
plot(ema200, color=color.green, title="200-Period EMA")

// Additional condition: All short-term EMAs must be above the 200-period EMA
allAbove200 = (ema8 > ema200) and (ema21 > ema200) and (ema50 > ema200)

// Generate buy and sell signals based on EMA crosses and additional condition when the bar is closed
buyCondition = ta.crossover(ema8, ema21) and barstate.isconfirmed and allAbove200
sellCondition = ta.crossunder(ema8, ema21) and barstate.isconfirmed

// Plot buy and sell signals on the chart
plotshape(series=buyCondition, location=location.belowbar, color=color.green, style=shape.labelup, title="Buy Signal", text="BUY")
plotshape(series=sellCondition, location=location.abovebar, color=color.red, style=shape.labeldown, title="Sell Signal", text="SELL")

// Create strategy entries and exits
if (buyCondition)
    strategy.entry("Buy", strategy.long)

if (sellCondition)
    strategy.close("Buy")

// Create alert conditions
alertcondition(buyCondition, title="Buy Alert", message="Buy Signal: 8 EMA crossed above 21 EMA with all EMAs above 200 EMA")
alertcondition(sellCondition, title="Sell Alert", message="Sell Signal: 8 EMA crossed below 21 EMA")
- Multi-Wave Trend Crossing Risk Management Quantitative Strategy
- Multi-EMA Crossover Momentum Strategy
- Dual EMA Volume Trend Confirmation Strategy for Quantitative Trading
- Advanced Quantitative Trend Following and Cloud Reversal Composite Trading Strategy
- EMA Crossover Momentum Scalping Strategy
- SMA Dual Moving Average Crossover Strategy
- Trading ABC
- EMA, SMA, Moving Average Crossover, Momentum Indicator
- EMA5 and EMA13 Crossover Strategy
- Multi-EMA Trend Momentum Recognition and Stop-Loss Trading System
- Super Moving Average and Upperband Crossover Strategy
- Elliott Wave and Tom DeMark Trend-Following Trading Strategy
- Multi-Timeframe Unified Strategy Based on Quantitative Momentum and Convergence-Divergence
- RSI Oversold Periodic Investment Strategy with Cooldown Optimization
- Optimized Multi-Timeframe HMA Quantitative Trading Strategy with Dynamic Stop-Loss
- Bollinger Band Crossover with Slippage and Price Impact Combined Strategy
- Trend Structure Break with Order Block and Fair Value Gap Strategy
- Adaptive Dynamic Stop-Loss and Take-Profit Strategy with SMA Crossover and Volume Filter
- Dual MACD Trend Confirmation Trading System
- High/Low Breakout Strategy with Alpha Trend and Moving Average Filter
- Multi-Candlestick Pattern Recognition and Trading Strategy
- Momentum-Driven EMA-RSI Crossover Strategy
- Multi-Indicator Dynamic Trading Strategy
- Multi-Indicator Intelligent Pyramiding Strategy
- Multi-EMA Crossover Momentum Strategy
- Multi-Order Breakout Trend Following Strategy
- Multi-EMA Crossover with Time Interval Integration Strategy
- Dual Moving Average Crossover Confirmation Strategy with Volume-Price Integration Optimization Model
- Dual Dynamic Indicator Optimization Strategy
- VWAP Crossover Dynamic Profit Target Trading Strategy
- Bollinger Bands Breakout Quantitative Trading Strategy