Golden Momentum Capture Strategy: Multi-Timeframe Exponential Moving Average Crossover System
Author: ChaoZhang, Date: 2024-07-31 15:00:12Tags: EMAMACDRSISMAATR
Overview
The Golden Momentum Capture Strategy is a trading system based on multi-timeframe analysis that utilizes the crossover of three Exponential Moving Averages (EMAs) to identify market trends and potential trading opportunities. This strategy combines short-term (9-period), medium-term (26-period), and long-term (55-period) EMAs, observing their relative positions and crossovers to determine changes in market momentum and trends. The core of the strategy lies in determining the overall trend direction on a higher timeframe, then seeking precise entry and exit points on lower timeframes, thereby improving the success rate and profitability of trades.
Strategy Principles
Multi-Timeframe Analysis:
- Analyze the trends of EMA 9, EMA 26, and EMA 55 on higher timeframes (e.g., daily or 4-hour) to determine the overall market trend.
- If EMA 55 shows an upward trend on the higher timeframe, it’s considered a bullish environment; if downward, it’s considered bearish.
Lower Timeframe Execution:
- After determining the higher timeframe trend, switch to lower timeframes (e.g., 15-minute or 1-hour) to look for specific trading signals.
- Buy Signal: Generated when EMA 9 crosses above EMA 26, and both are above EMA 55.
- Sell Signal: Generated when EMA 9 crosses below EMA 26, and both are below EMA 55.
Signal Confirmation:
- Buy Confirmation: In addition to the EMA crossover, EMA 9 and EMA 26 must be above EMA 55 and align with the bullish trend identified on the higher timeframe.
- Sell Confirmation: In addition to the EMA crossover, EMA 9 and EMA 26 must be below EMA 55 and align with the bearish trend identified on the higher timeframe.
Code Implementation:
- Written in Pine Script language, executable on the TradingView platform.
- Uses the request.security() function to obtain and analyze multi-timeframe data.
- Employs ta.crossover() and ta.crossunder() functions to detect EMA crossovers.
- Executes buy and sell operations through the strategy.entry() function.
Strategy Advantages
Trend Following: By combining EMAs from multiple timeframes, the strategy effectively captures major market trends, reducing the risk of counter-trend trading.
Momentum Capture: EMA crossover signals help timely detect changes in market momentum, allowing traders to enter at the early stages of trends.
Signal Filtering: Requiring specific positions of EMA 9 and EMA 26 relative to EMA 55 helps filter out potential false signals.
Flexibility: The strategy allows users to customize EMA timeframes, adjustable for different trading instruments and personal preferences.
Objectivity: Based on clear mathematical indicators and rules, it reduces biases from subjective judgment.
Automation Potential: With clear strategy logic, it’s easy to implement programmatically, showing good potential for automated trading.
Strategy Risks
Lag: EMAs are inherently lagging indicators, which may not react quickly enough in rapidly changing markets.
False Breakouts: In choppy markets, frequent false breakout signals may lead to overtrading.
Trend Dependency: The strategy may not perform well in range-bound markets with no clear trends.
Parameter Sensitivity: The choice of EMA periods significantly affects strategy performance; different markets may require different parameter settings.
Over-reliance on Technical Analysis: Ignoring fundamental factors and other market elements may lead to misjudgments.
Drawdown Risk: The strategy may not identify trend reversals timely, potentially leading to significant drawdowns.
Strategy Optimization Directions
Introduce Additional Filters:
- Consider adding volume indicators to ensure trading signals are supported by sufficient volume.
- Incorporate momentum indicators like Relative Strength Index (RSI) or Stochastic Oscillator to further confirm trend strength.
Dynamic Parameter Adjustment:
- Implement dynamic adjustment of EMA periods, automatically optimizing parameters based on market volatility.
- Consider using Adaptive Moving Averages (AMA) instead of traditional EMAs to better adapt to different market conditions.
Improve Stop Loss and Profit-Taking Strategies:
- Introduce trailing stops, such as dynamic stops based on Average True Range (ATR).
- Implement partial profit-locking mechanisms to secure gains during trends.
Market Environment Recognition:
- Develop algorithms to identify whether the current market is trending or ranging, and apply different trading strategies accordingly.
Multi-Factor Model:
- Incorporate the EMA crossover strategy as a component in a multi-factor model, combining it with other technical and fundamental factors.
Machine Learning Optimization:
- Use machine learning algorithms to optimize parameter selection and signal generation processes.
- Explore deep learning models, such as LSTM networks, to predict future EMA trends.
Summary
The Golden Momentum Capture Strategy is a comprehensive trading system that combines multi-timeframe analysis with EMA crossover techniques. By determining the overall trend on higher timeframes and seeking precise entry points on lower timeframes, this strategy aims to improve trading accuracy and profitability. While there are inherent risks such as lag and false breakouts, with proper risk management and continuous optimization, this strategy has the potential to become a powerful trading tool. Future optimization directions include introducing additional technical indicators, implementing dynamic parameter adjustments, improving stop-loss strategies, and exploring machine learning applications. Overall, this is a strategy framework worth further research and improvement, particularly suitable for traders seeking a balance between trend following and momentum trading.
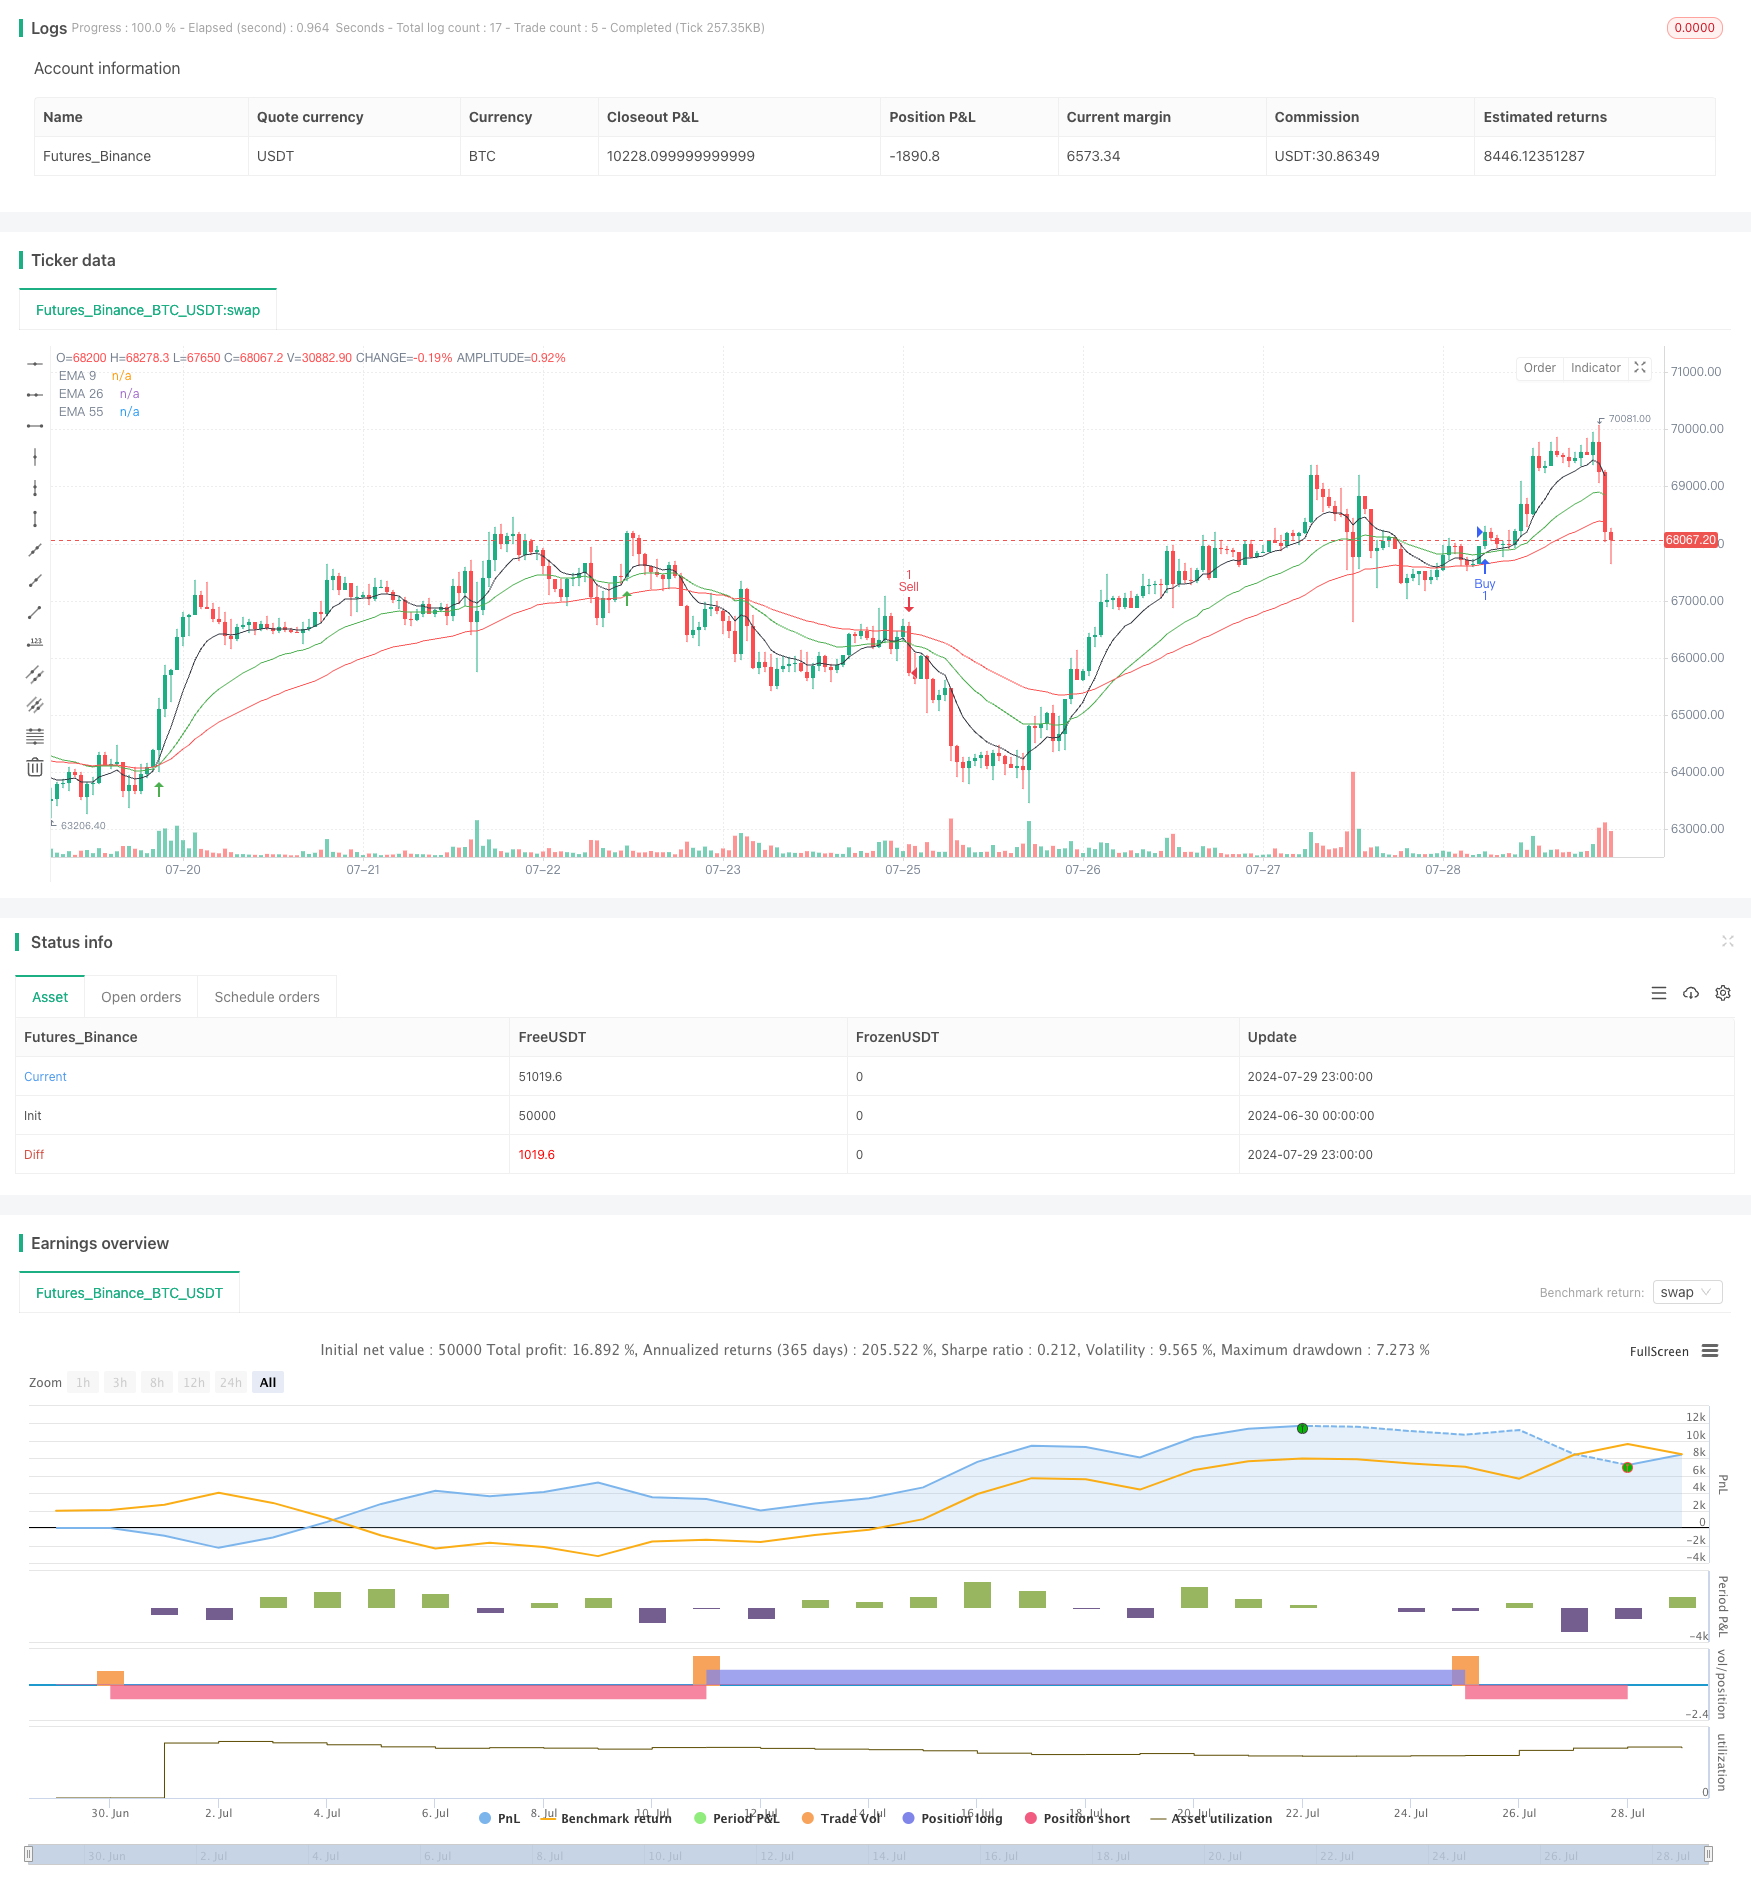
/*backtest
start: 2024-06-30 00:00:00
end: 2024-07-30 00:00:00
period: 1h
basePeriod: 15m
exchanges: [{"eid":"Futures_Binance","currency":"BTC_USDT"}]
*/

//@version=5
strategy("Golden Crossover", overlay=true)

// Define EMA lengths
ema9_length = 9
ema26_length = 26
ema55_length = 55

// Input parameters
timeFrame9 = input.timeframe('', 'Time Frame - EMA 9')
timeFrame26 = input.timeframe('', 'Time Frame - EMA 26')
timeFrame55 = input.timeframe('', 'Time Frame - EMA 55')

// Request data from specified time frames
ema9 = request.security(syminfo.tickerid, timeFrame9, ta.ema(close, ema9_length))
ema26 = request.security(syminfo.tickerid, timeFrame26, ta.ema(close, ema26_length))
ema55 = request.security(syminfo.tickerid, timeFrame55, ta.ema(close, ema55_length))

// Plot EMAs on the chart
plot(ema9, color=color.black, title="EMA 9")
plot(ema26, color=color.green, title="EMA 26")
plot(ema55, color=color.red, title="EMA 55")

// Define buy condition
buy_condition = ta.crossover(ema9, ema26) and ema26 > ema55 //and ema26 > ema55 // (We can activate additional condition to get more accurate signals)

// Define sell condition
sell_condition = ta.crossunder(ema9, ema26) and (ema26 < ema55) //and ema26 < ema55 // (We can activate additional condition to get more accurate signals)

// Execute buy and sell orders
if (buy_condition)
    strategy.entry("Buy", strategy.long)

if (sell_condition)
    strategy.entry("Sell", strategy.short)

// Optional: Plot buy and sell signals on the chart
plotshape(series=buy_condition, location=location.belowbar, color=color.green, style=shape.arrowup, title="Buy")
plotshape(series=sell_condition, location=location.abovebar, color=color.red, style=shape.arrowdown, title="Sell")
- Multi-EMA Trend Following Strategy with Dynamic ATR Targets
- Multi-Technical Indicator Trend Following Strategy with RSI Momentum Filter
- Short-term Short Selling Strategy for High-liquidity Currency Pairs
- Multi-Period Exponential Moving Average Crossover Strategy with Options Trading Suggestion System
- Dual EMA Indicator Smart Crossing Trading System with Dynamic Stop-Loss and Take-Profit Strategy
- Multi-Period Trend Following Trading System Based on EMA Volatility Bands
- No Upper Wick Bullish Candle Breakout Strategy
- Multi-Indicator Dynamic Stop-Loss Momentum Trend Trading Strategy
- Multi-Indicator Trend Momentum Trading Strategy: An Optimized Quantitative Trading System Based on Bollinger Bands, Fibonacci and ATR
- Volume-based Dynamic DCA Strategy
- EMA MACD Momentum Tracking Strategy
- Dynamic Position Management RSI Overbought Reversal Strategy
- Multi-Zone RSI Trading Strategy
- Dynamic Trend Following Strategy with Machine Learning Enhanced Risk Management
- Crossover Moving Average with Smoothed Candlestick Momentum Strategy
- Dual Moving Average Crossover Strategy with Daily Profit Target
- Dynamic Stop-Loss Moving Average Crossover Strategy
- MACD-ATR-EMA Multi-Indicator Dynamic Trend Following Strategy
- RSI Momentum Divergence Breakout Strategy
- Multi-Indicator Synergy Long-Term Trading Strategy
- Triple Supertrend Crossover Strategy
- Advanced Multi-Timeframe Ichimoku Cloud Trading Strategy with Dynamic Multidimensional Analysis
- Dual Moving Average Momentum Trading Strategy: Time-Optimized Trend Following System
- Enhanced EMA/WMA Crossover Strategy with Comprehensive Exit Conditions
- Supertrend and EMA Crossover Quantitative Trading Strategy
- EMA, SMA, Moving Average Crossover, Momentum Indicator
- Comprehensive Trading System Combining SMA Crossover Strategy with Fair Value Gap Pullback
- Dynamic Support-Resistance Breakout Moving Average Crossover Strategy
- Dynamic Trend Following with Precision Take-Profit and Stop-Loss Strategy
- Ichimoku Kinko Hyo Trend Following and Support Resistance Strategy