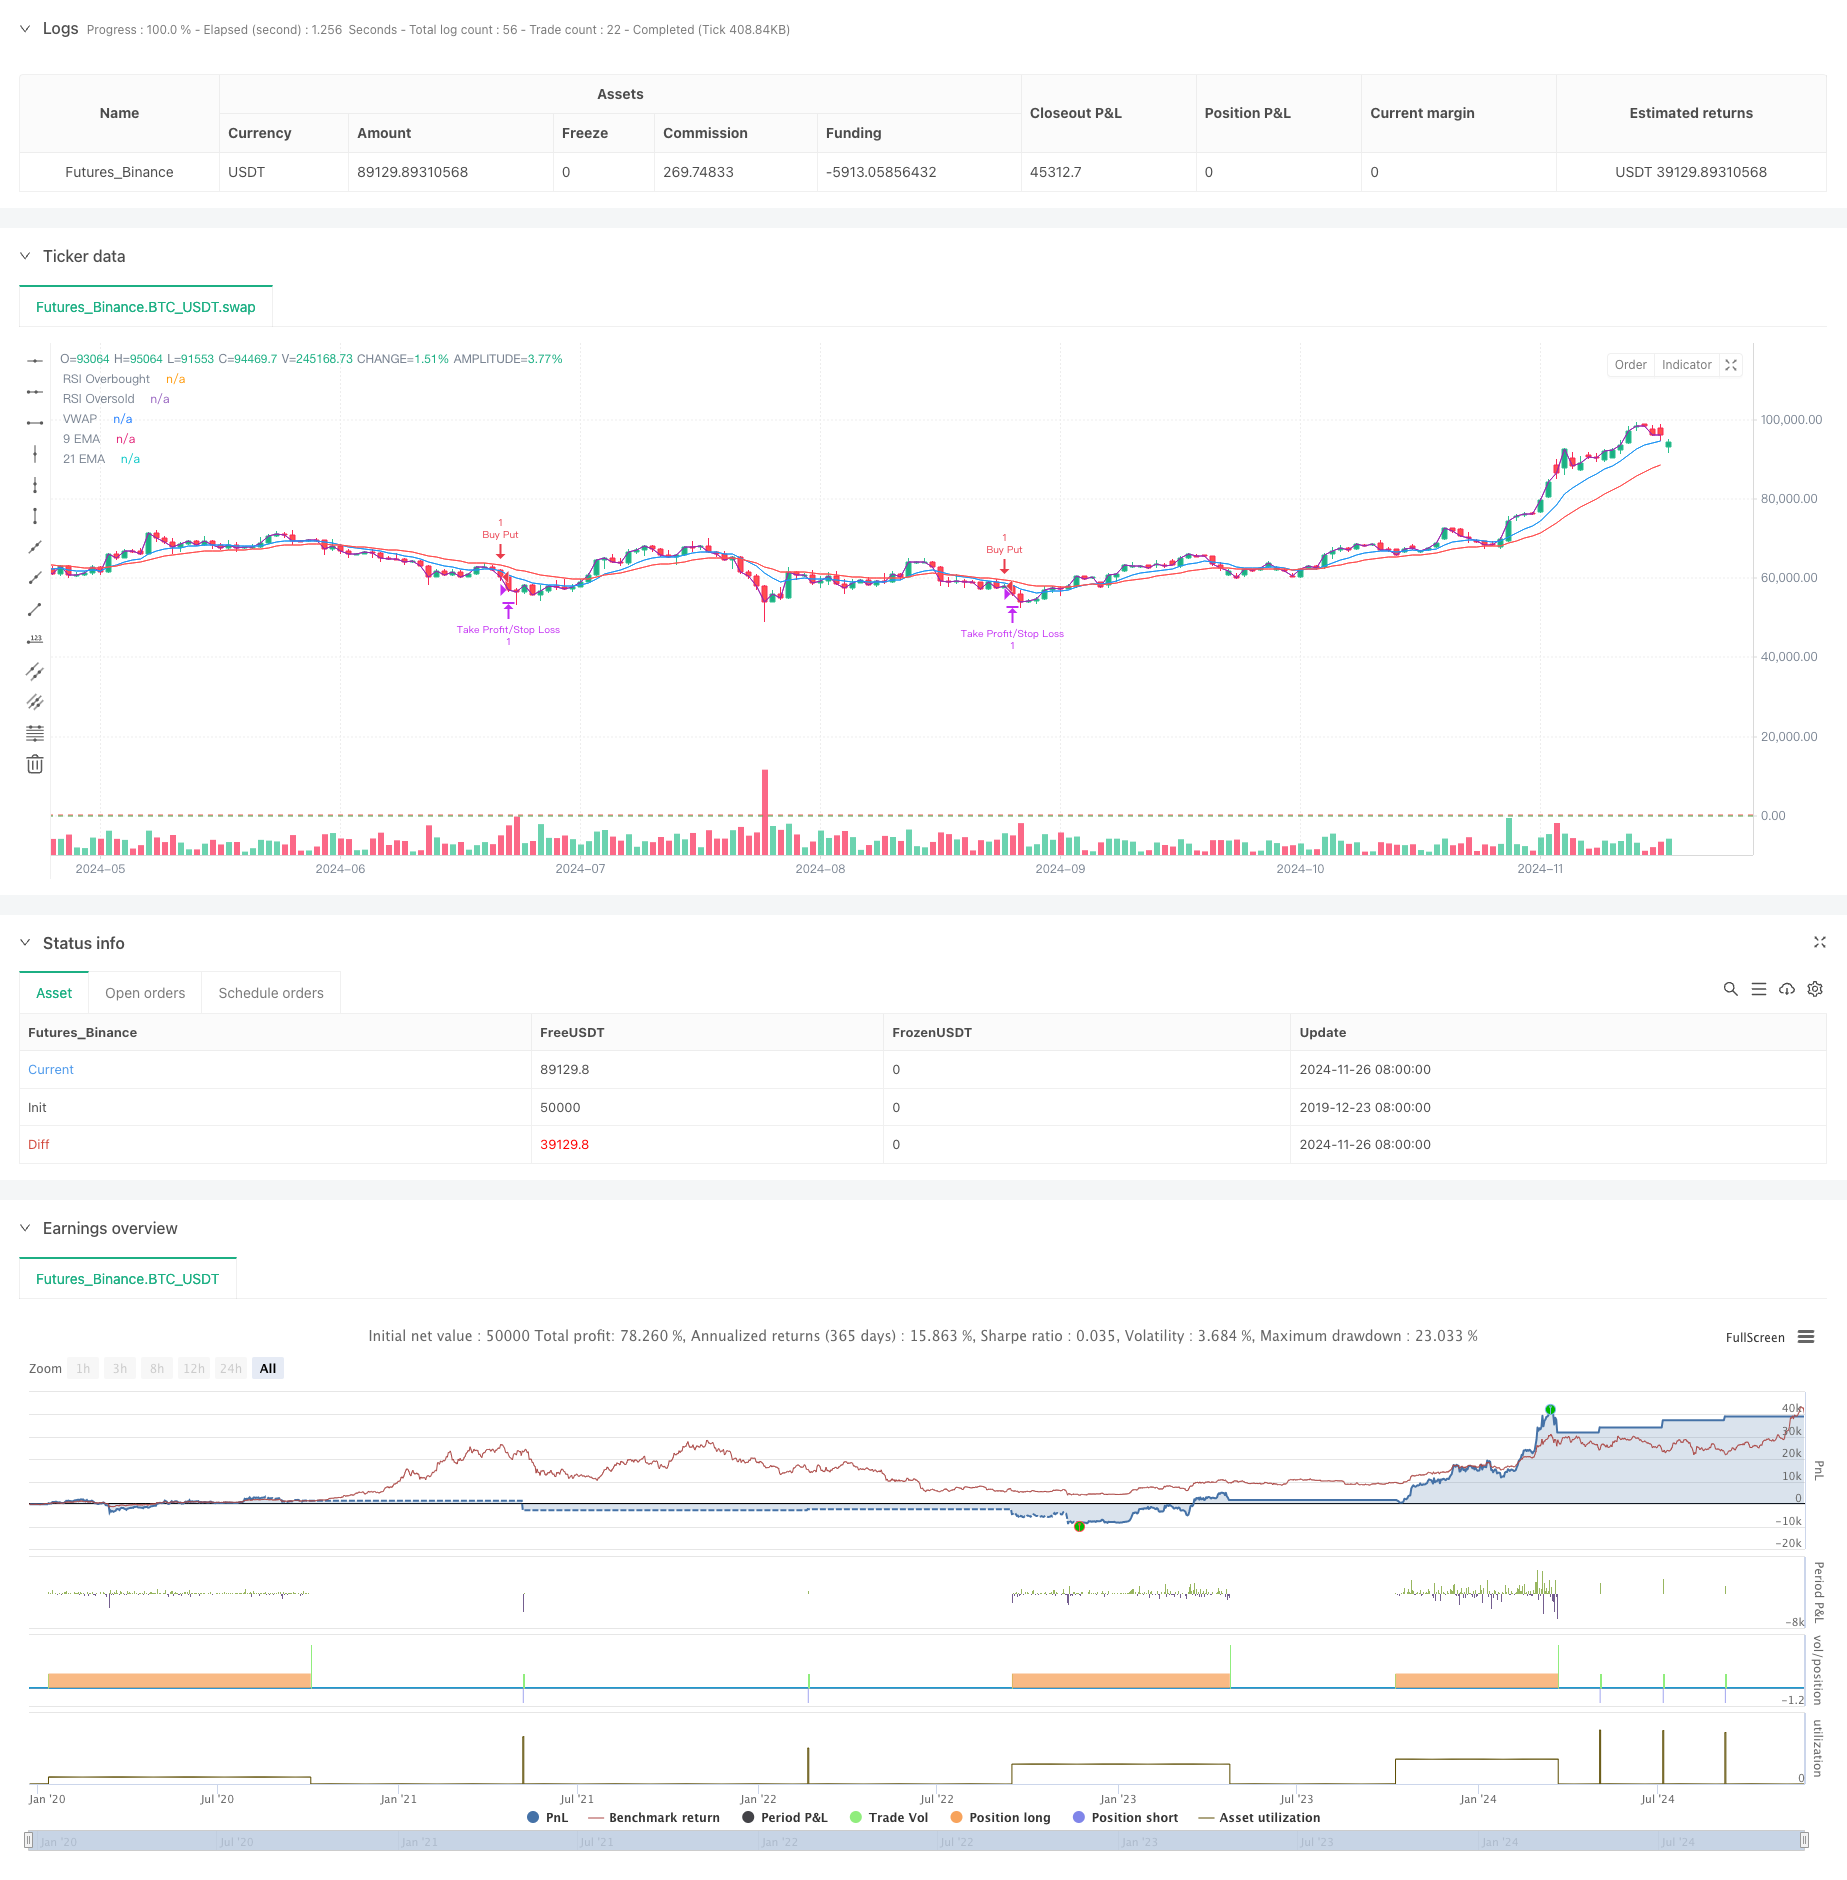
High-Frequency Dynamic Multi-Indicator Moving Average Crossover Strategy
Author: ChaoZhang, Date: 2024-11-28 15:29:06Tags: EMARSIATRVWAPSMA

Overview
This strategy is a high-frequency trading system based on multiple technical indicators, utilizing a 5-minute timeframe and combining moving averages, momentum indicators, and volume analysis. The strategy adapts to market volatility through dynamic adjustments and uses multiple signal confirmations to improve trading accuracy and reliability. The core concept lies in capturing short-term market trends through a multi-dimensional combination of technical indicators while employing dynamic stop-loss mechanisms for risk control.
Strategy Principles
The strategy employs a dual moving average system (9-period and 21-period EMAs) as the primary trend determination tool, combined with RSI for momentum confirmation. Long opportunities are sought when price is above both EMAs and RSI is between 40-65, while short opportunities are considered when price is below both EMAs and RSI is between 35-60. Additionally, the strategy incorporates a volume confirmation mechanism requiring current volume to exceed 1.2 times the 20-period moving average volume. The use of VWAP further ensures trade direction aligns with intraday mainstream trends.
Strategy Advantages
- Multiple signal confirmation mechanism significantly improves trading reliability
- Dynamic profit-taking and stop-loss settings adapt to different market environments
- Conservative RSI thresholds avoid trading in extreme zones
- Volume confirmation mechanism effectively filters false signals
- VWAP usage helps ensure trade direction aligns with major capital flow
- Responsive moving average system suitable for capturing short-term market opportunities
Strategy Risks
- May generate frequent false signals in range-bound markets
- Multiple conditions may cause missed trading opportunities
- High-frequency trading may face higher transaction costs
- Potentially slow response to rapid market reversals
- High requirements for real-time market data quality
Strategy Optimization Directions
- Introduce adaptive parameter adjustment mechanisms for dynamic indicator parameter updates based on market conditions
- Add market environment recognition modules to employ different trading strategies under various market conditions
- Optimize volume filtering conditions, considering relative volume or volume profile analysis
- Improve stop-loss mechanism by potentially adding trailing stop functionality
- Include trading time filters to avoid high-volatility opening and closing periods
Summary
This strategy constructs a relatively complete trading system through the combination of multiple technical indicators. Its strengths lie in its multi-dimensional signal confirmation mechanism and dynamic risk control methods. While some potential risks exist, the strategy maintains good practical value through proper parameter optimization and risk management. Traders are advised to conduct thorough backtesting before live implementation and adjust parameters according to specific market conditions.
/*backtest
start: 2019-12-23 08:00:00
end: 2024-11-27 00:00:00
period: 1d
basePeriod: 1d
exchanges: [{"eid":"Futures_Binance","currency":"BTC_USDT"}]
*/

//@version=5
strategy("Optimized Nifty MidCap Select Options 5-min Intraday Strategy", overlay=true)

// Parameters
emaShortPeriod = input.int(9, title="Short EMA")
emaLongPeriod = input.int(21, title="Long EMA")
rsiPeriod = input.int(14, title="RSI Period")
rsiOverbought = input.int(65, title="RSI Overbought Level") // More conservative than 70
rsiOversold = input.int(35, title="RSI Oversold Level") // More conservative than 30
atrLength = input.int(14, title="ATR Length")
atrMultiplier = input.float(1.5, title="ATR Multiplier")
volumeMultiplier = input.float(1.2, title="Volume Multiplier") // For confirming high-volume trades

// EMA Calculation
emaShort = ta.ema(close, emaShortPeriod)
emaLong = ta.ema(close, emaLongPeriod)

// RSI Calculation
rsiValue = ta.rsi(close, rsiPeriod)

// ATR Calculation
atrValue = ta.atr(atrLength)

// VWAP Calculation
vwapValue = ta.vwap(close)

// Volume Check
volumeCondition = volume > ta.sma(volume, 20) * volumeMultiplier

// Define long and short conditions

// Long Condition:
// Price above both EMAs, RSI not overbought, price above VWAP, and high volume
longCondition = (close > emaShort) and (close > emaLong) and (rsiValue > 40 and rsiValue < rsiOverbought) and (close > vwapValue) and volumeCondition

// Short Condition:
// Price below both EMAs, RSI not oversold, price below VWAP, and high volume
shortCondition = (close < emaShort) and (close < emaLong) and (rsiValue < 60 and rsiValue > rsiOversold) and (close < vwapValue) and volumeCondition

// Entry logic
if (longCondition)
    strategy.entry("Buy Call", strategy.long)
if (shortCondition)
    strategy.entry("Buy Put", strategy.short)

// Dynamic Take Profit and Stop Loss based on ATR
takeProfitLevel = strategy.position_avg_price * (1 + atrValue * atrMultiplier / 100)
stopLossLevel = strategy.position_avg_price * (1 - atrValue * atrMultiplier / 100)

// Exit strategy based on ATR levels
strategy.exit("Take Profit/Stop Loss", from_entry="Buy Call", limit=takeProfitLevel, stop=stopLossLevel)
strategy.exit("Take Profit/Stop Loss", from_entry="Buy Put", limit=takeProfitLevel, stop=stopLossLevel)

// Plotting indicators
plot(emaShort, title="9 EMA", color=color.blue)
plot(emaLong, title="21 EMA", color=color.red)
hline(rsiOverbought, "RSI Overbought", color=color.red)
hline(rsiOversold, "RSI Oversold", color=color.green)
plot(vwapValue, title="VWAP", color=color.purple)
- Multi-Filter Trend Breakthrough Smart Moving Average Trading Strategy
- Multi-Indicator Volatility Trading RSI-EMA-ATR Strategy
- Multi-Indicator Trend Momentum Crossover Quantitative Strategy
- Multi-Indicator Dynamic Adaptive Position Sizing with ATR Volatility Strategy
- Multi-Timeframe Moving Average and RSI Trend Trading Strategy
- Multi-Technical Indicator Trend Following Strategy with RSI Momentum Filter
- Golden Momentum Capture Strategy: Multi-Timeframe Exponential Moving Average Crossover System
- Technical Trading Strategy for BTC 15-minute Chart
- Short-term Short Selling Strategy for High-liquidity Currency Pairs
- Multi-Period Exponential Moving Average Crossover Strategy with Options Trading Suggestion System
- ATR Fusion Trend Optimization Model Strategy
- Enhanced Multi-Indicator Trend Reversal Intelligence Strategy
- RSI Trend Momentum Trading Strategy with Dual MA and Volume Confirmation
- Triple EMA Crossover Trading Strategy with Dynamic Stop-Loss and Take-Profit
- Dual Momentum Squeeze Trading System (SMI+UBS Indicator Combination Strategy)
- RSI-MACD Multi-Signal Trading System with Dynamic Stop Management
- ADX Trend Breakout Momentum Trading Strategy
- Trend Following and Mean Reversion Dual Optimization Trading System(Double Seven Strategy)
- Multi-Period Moving Average and RSI Momentum Cross Strategy
- Dual Moving Average MACD Crossover Date-Adjustable Quantitative Trading Strategy
- Triple Exponential Moving Average Trend Trading Strategy
- Multi-Timeframe EMA Trend Strategy with Daily High-Low Breakout System
- Advanced Flexible Multi-Period Moving Average Crossover Strategy
- T3 Moving Average Trend Following Strategy with Trailing Stop Loss
- Multi-Technical Indicator Trend Following Strategy with Ichimoku Cloud Breakout and Stop-Loss System
- Dual Standard Deviation Bollinger Bands Momentum Breakout Strategy
- Advanced Timeframe Fibonacci Retracement with High-Low Breakout Trading System
- RSI Dynamic Exit Level Momentum Trading Strategy
- Multi-Indicator Cross-Trend Tracking and Volume-Price Combined Adaptive Trading Strategy
- Advanced Dual Moving Average Momentum Trend Following Trading System