Multi-Wave Trend Following Price Analysis Strategy
Author: ChaoZhang, Date: 2024-11-29 16:40:36Tags:

Overview
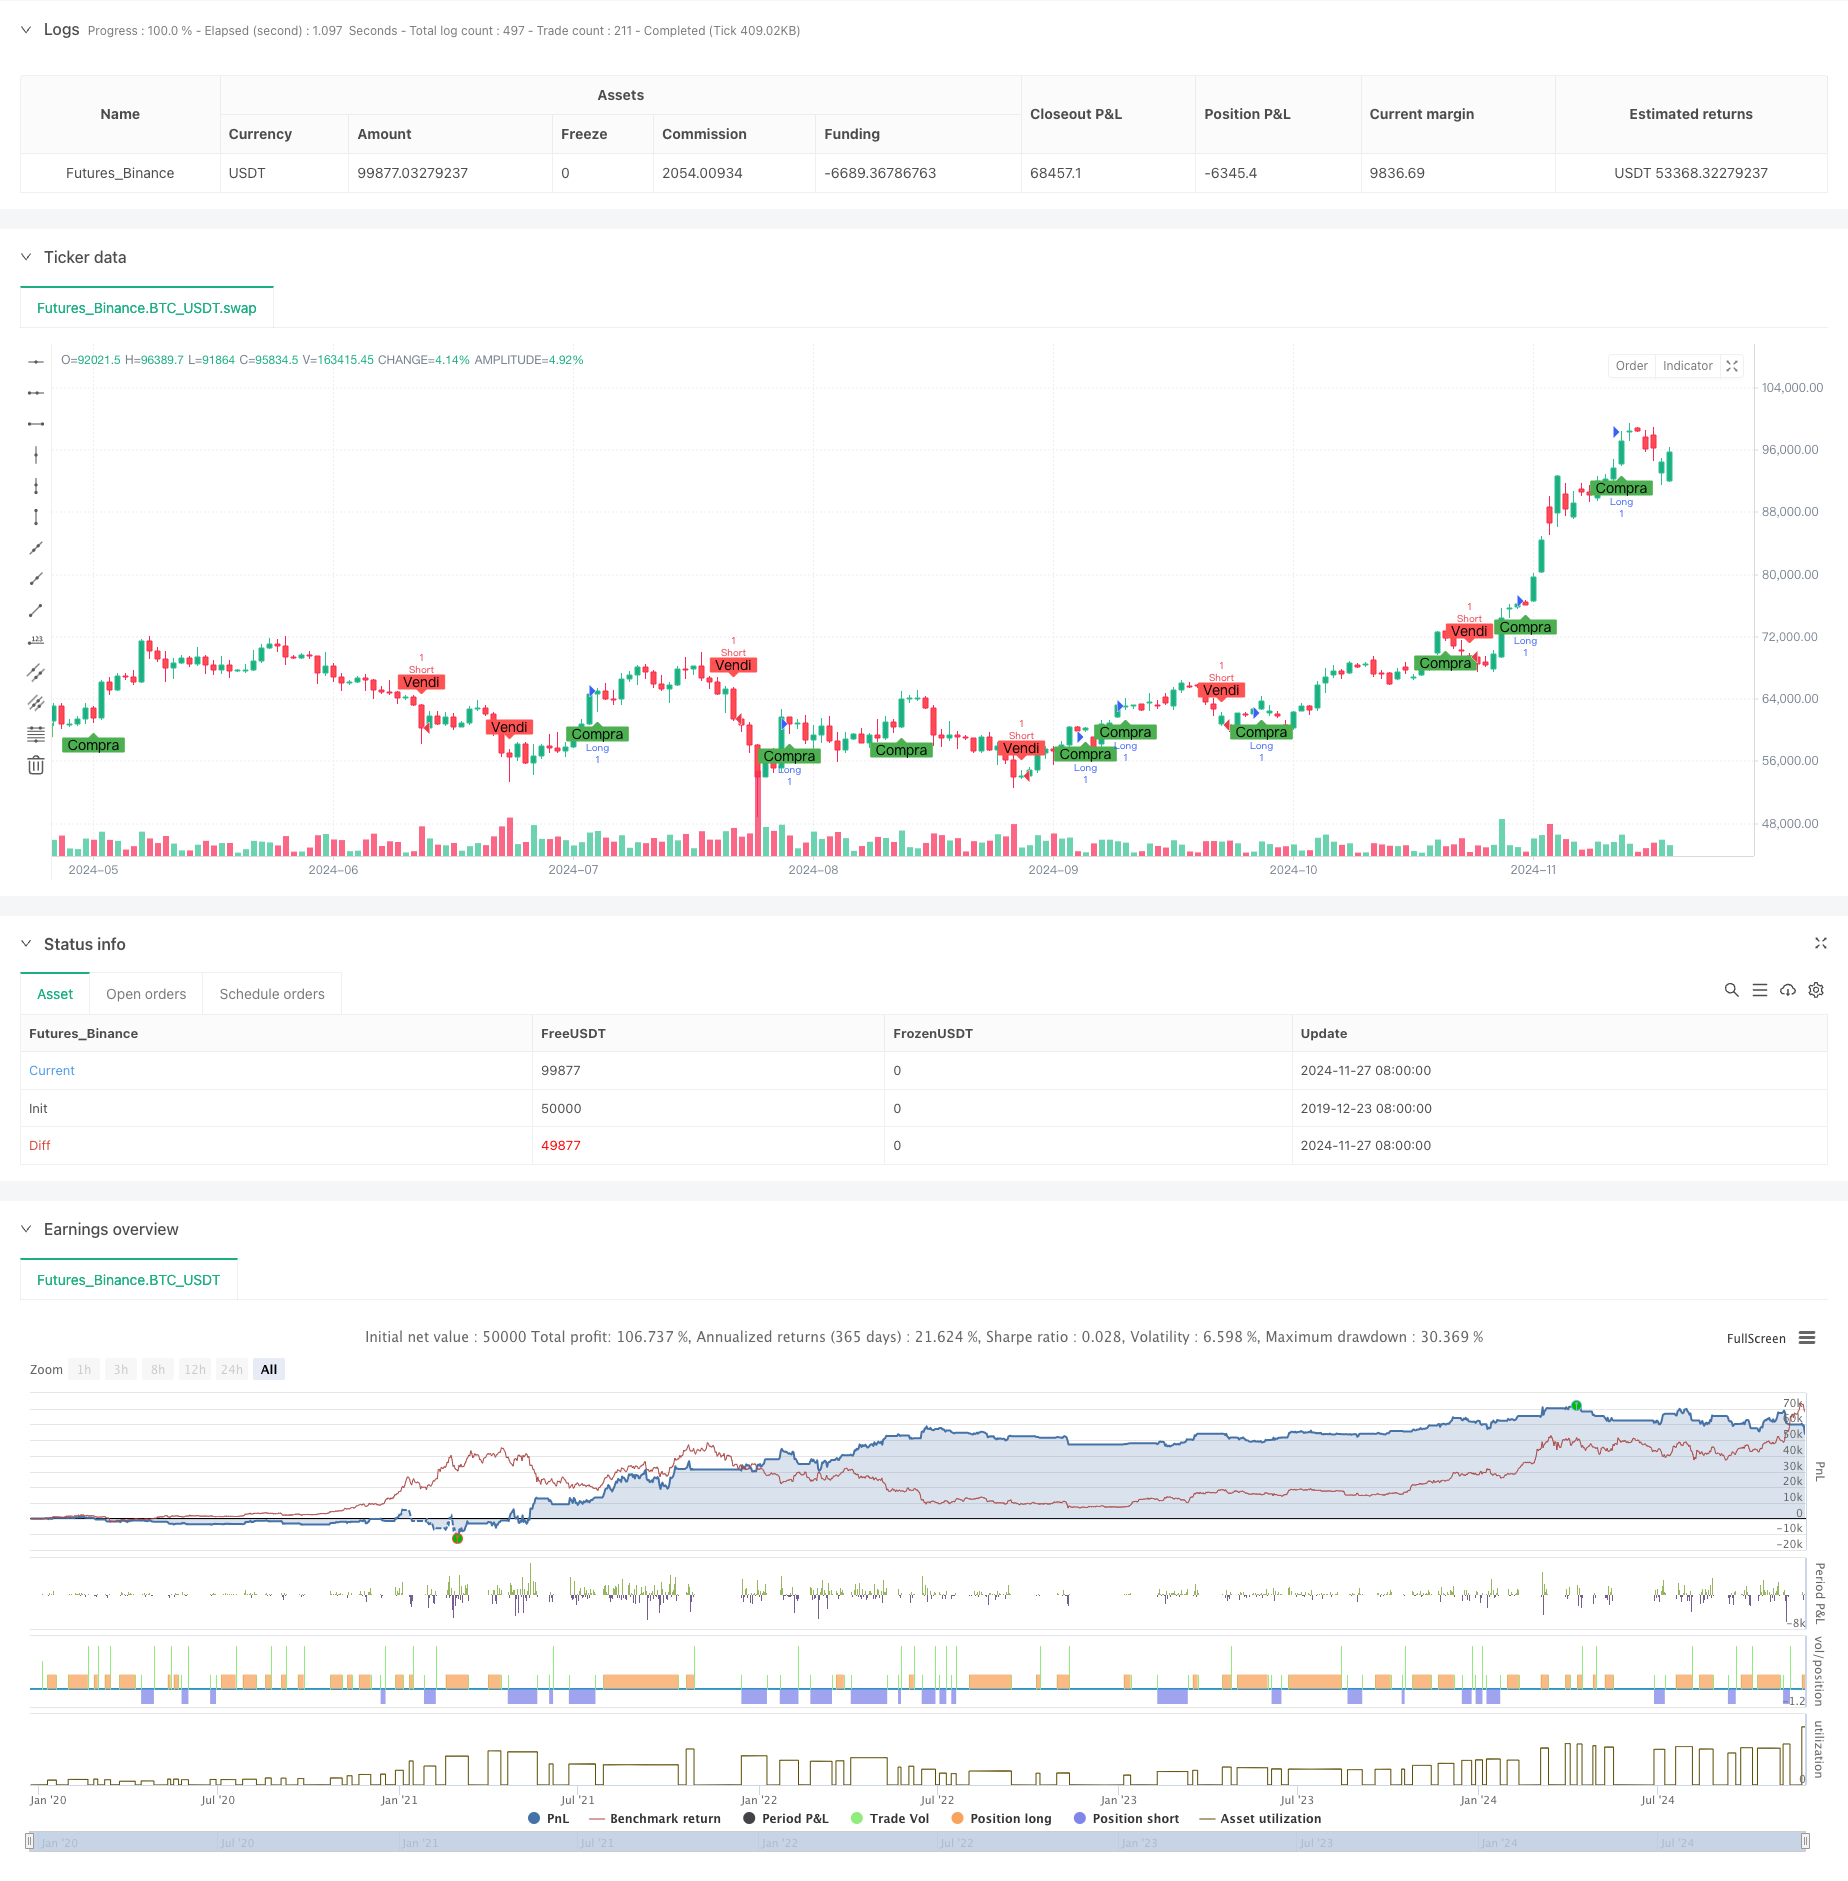
This strategy is a multi-wave trend following system that identifies market trends by analyzing price changes across three consecutive trading periods through their highs and lows. The strategy employs dynamic stop-loss and take-profit mechanisms to protect capital while pursuing stable returns. This approach is particularly suitable for markets with clear trends, effectively capturing medium to long-term price movements.
Strategy Principles
The core logic is built on the principles of price movement continuity and trend continuation. Specifically, the strategy operates through the following steps:
- Trend Identification Mechanism: Continuously monitors highs and lows over three periods, identifying an uptrend when three consecutive higher lows appear, and a downtrend when three consecutive lower highs occur.
- Signal Generation System: Automatically generates corresponding buy or sell signals once a trend is confirmed.
- Risk Management System: Each trade is equipped with dynamic stop-loss and take-profit points, with a stop-loss distance of 2 units and a profit target of 6 units.
Strategy Advantages
- Trend Following Reliability: Confirmation across three periods significantly reduces the possibility of false breakouts.
- Reasonable Risk-Reward Ratio: The set 1:3 risk-reward ratio (2 units stop-loss vs 6 units take-profit) adheres to professional trading principles.
- High Automation Level: The system automatically identifies signals and executes trades, reducing emotional interference.
- Good Visualization: Clear graphical markers for buy and sell points facilitate understanding and review.
Strategy Risks
- Ranging Market Risk: May generate frequent false signals in sideways markets, leading to consecutive stops.
- Slippage Risk: Actual execution prices may significantly deviate from expected prices during high volatility.
- Money Management Risk: Fixed stop-loss and take-profit distances may not suit all market conditions.
Optimization Directions
- Add Volatility Filter: Consider incorporating ATR indicator for dynamic adjustment of stop-loss and take-profit distances.
- Include Trend Confirmation Indicators: Combine with moving averages or MACD to filter false signals.
- Implement Position Sizing System: Dynamically adjust position sizes based on market volatility and account risk tolerance.
- Optimize Signal Confirmation: Consider adding volume confirmation or other technical indicators.
Summary
This is a well-designed trend following strategy that enhances trading reliability through multiple confirmation mechanisms. While there are areas for optimization, the overall approach is clear and suitable as a basic strategy framework for further refinement and customization. The strategy’s core strength lies in its simple yet effective trend identification mechanism, coupled with a reasonable risk management system, capable of achieving good results in trending markets.
/*backtest
start: 2019-12-23 08:00:00
end: 2024-11-28 00:00:00
period: 1d
basePeriod: 1d
exchanges: [{"eid":"Futures_Binance","currency":"BTC_USDT"}]
*/

//@version=5
strategy("Indicatore Minimi e Massimi", overlay=true)

// Parametri di input per stop loss e take profit
stopLossDistance = input(2, title="Distanza Stop Loss")
takeProfitDistance = input(6, title="Distanza Take Profit")

// Funzione per il conteggio dei massimi e minimi
var int countUp = 0
var int countDown = 0

// Calcola i massimi e minimi
if (low > low[1] and low[1] > low[2])
    countUp := countUp + 1
    countDown := 0
else if (high < high[1] and high[1] < high[2])
    countDown := countDown + 1
    countUp := 0
else
    countUp := 0
    countDown := 0

// Segnali di acquisto e vendita
longSignal = countUp == 3
shortSignal = countDown == 3

// Impostazione dello stop loss e take profit
longStopLoss = close - stopLossDistance
longTakeProfit = close + takeProfitDistance
shortStopLoss = close + stopLossDistance
shortTakeProfit = close - takeProfitDistance

// Esegui le operazioni
if (longSignal)
    strategy.entry("Long", strategy.long)
    strategy.exit("Take Profit", "Long", limit=longTakeProfit, stop=longStopLoss)

if (shortSignal)
    strategy.entry("Short", strategy.short)
    strategy.exit("Take Profit", "Short", limit=shortTakeProfit, stop=shortStopLoss)

// Visualizza segnali sul grafico
plotshape(series=longSignal, location=location.belowbar, color=color.green, style=shape.labelup, text="Compra")
plotshape(series=shortSignal, location=location.abovebar, color=color.red, style=shape.labeldown, text="Vendi")
- Multi-Exponential Moving Average Crossover Strategy with Volume-Based ATR Dynamic Stop-Loss Optimization
- Dual Chain Hybrid Momentum EMA Tracking Trading System
- Dynamic Signal Line Trend Following and Volatility Filtering Strategy
- Multi-Timeframe Bollinger Momentum Breakout Strategy with Hull Moving Average
- Multi-Step Volatility-Adjusted Dynamic SuperTrend Strategy
- Triple EMA Trend Following Quantitative Trading Strategy
- Dual Hull Moving Average Crossover Quantitative Strategy
- Statistical Deviation-Based Market Extreme Drawdown Strategy
- Four-Period SMA Breakthrough Trading Strategy with Dynamic Profit/Loss Management System
- RSI and Bollinger Bands Cross-Regression Dual Strategy
- Smoothed Heikin-Ashi with SMA Crossover Trend Following Strategy
- Reflected EMA Trend Determination Strategy Based on Hull Moving Averages
- Dual EMA Indicator Smart Crossing Trading System with Dynamic Stop-Loss and Take-Profit Strategy
- OBV-SMA Crossover with RSI Filter Multi-Dimensional Momentum Trading Strategy
- Dynamic Volatility Trading Strategy Based on Bollinger Bands and Candlestick Patterns
- Advanced Fair Value Gap Detection Strategy with Dynamic Risk Management and Fixed Take Profit
- Dynamic RSI Oversold Rebound Trading Strategy with Stop-Loss Optimization Model
- Dynamic ATR Stop-Loss RSI Oversold Rebound Quantitative Strategy
- Advanced Dual EMA Strategy with ATR Volatility Filter System
- Dual EMA Dynamic Zone Trend Following Strategy