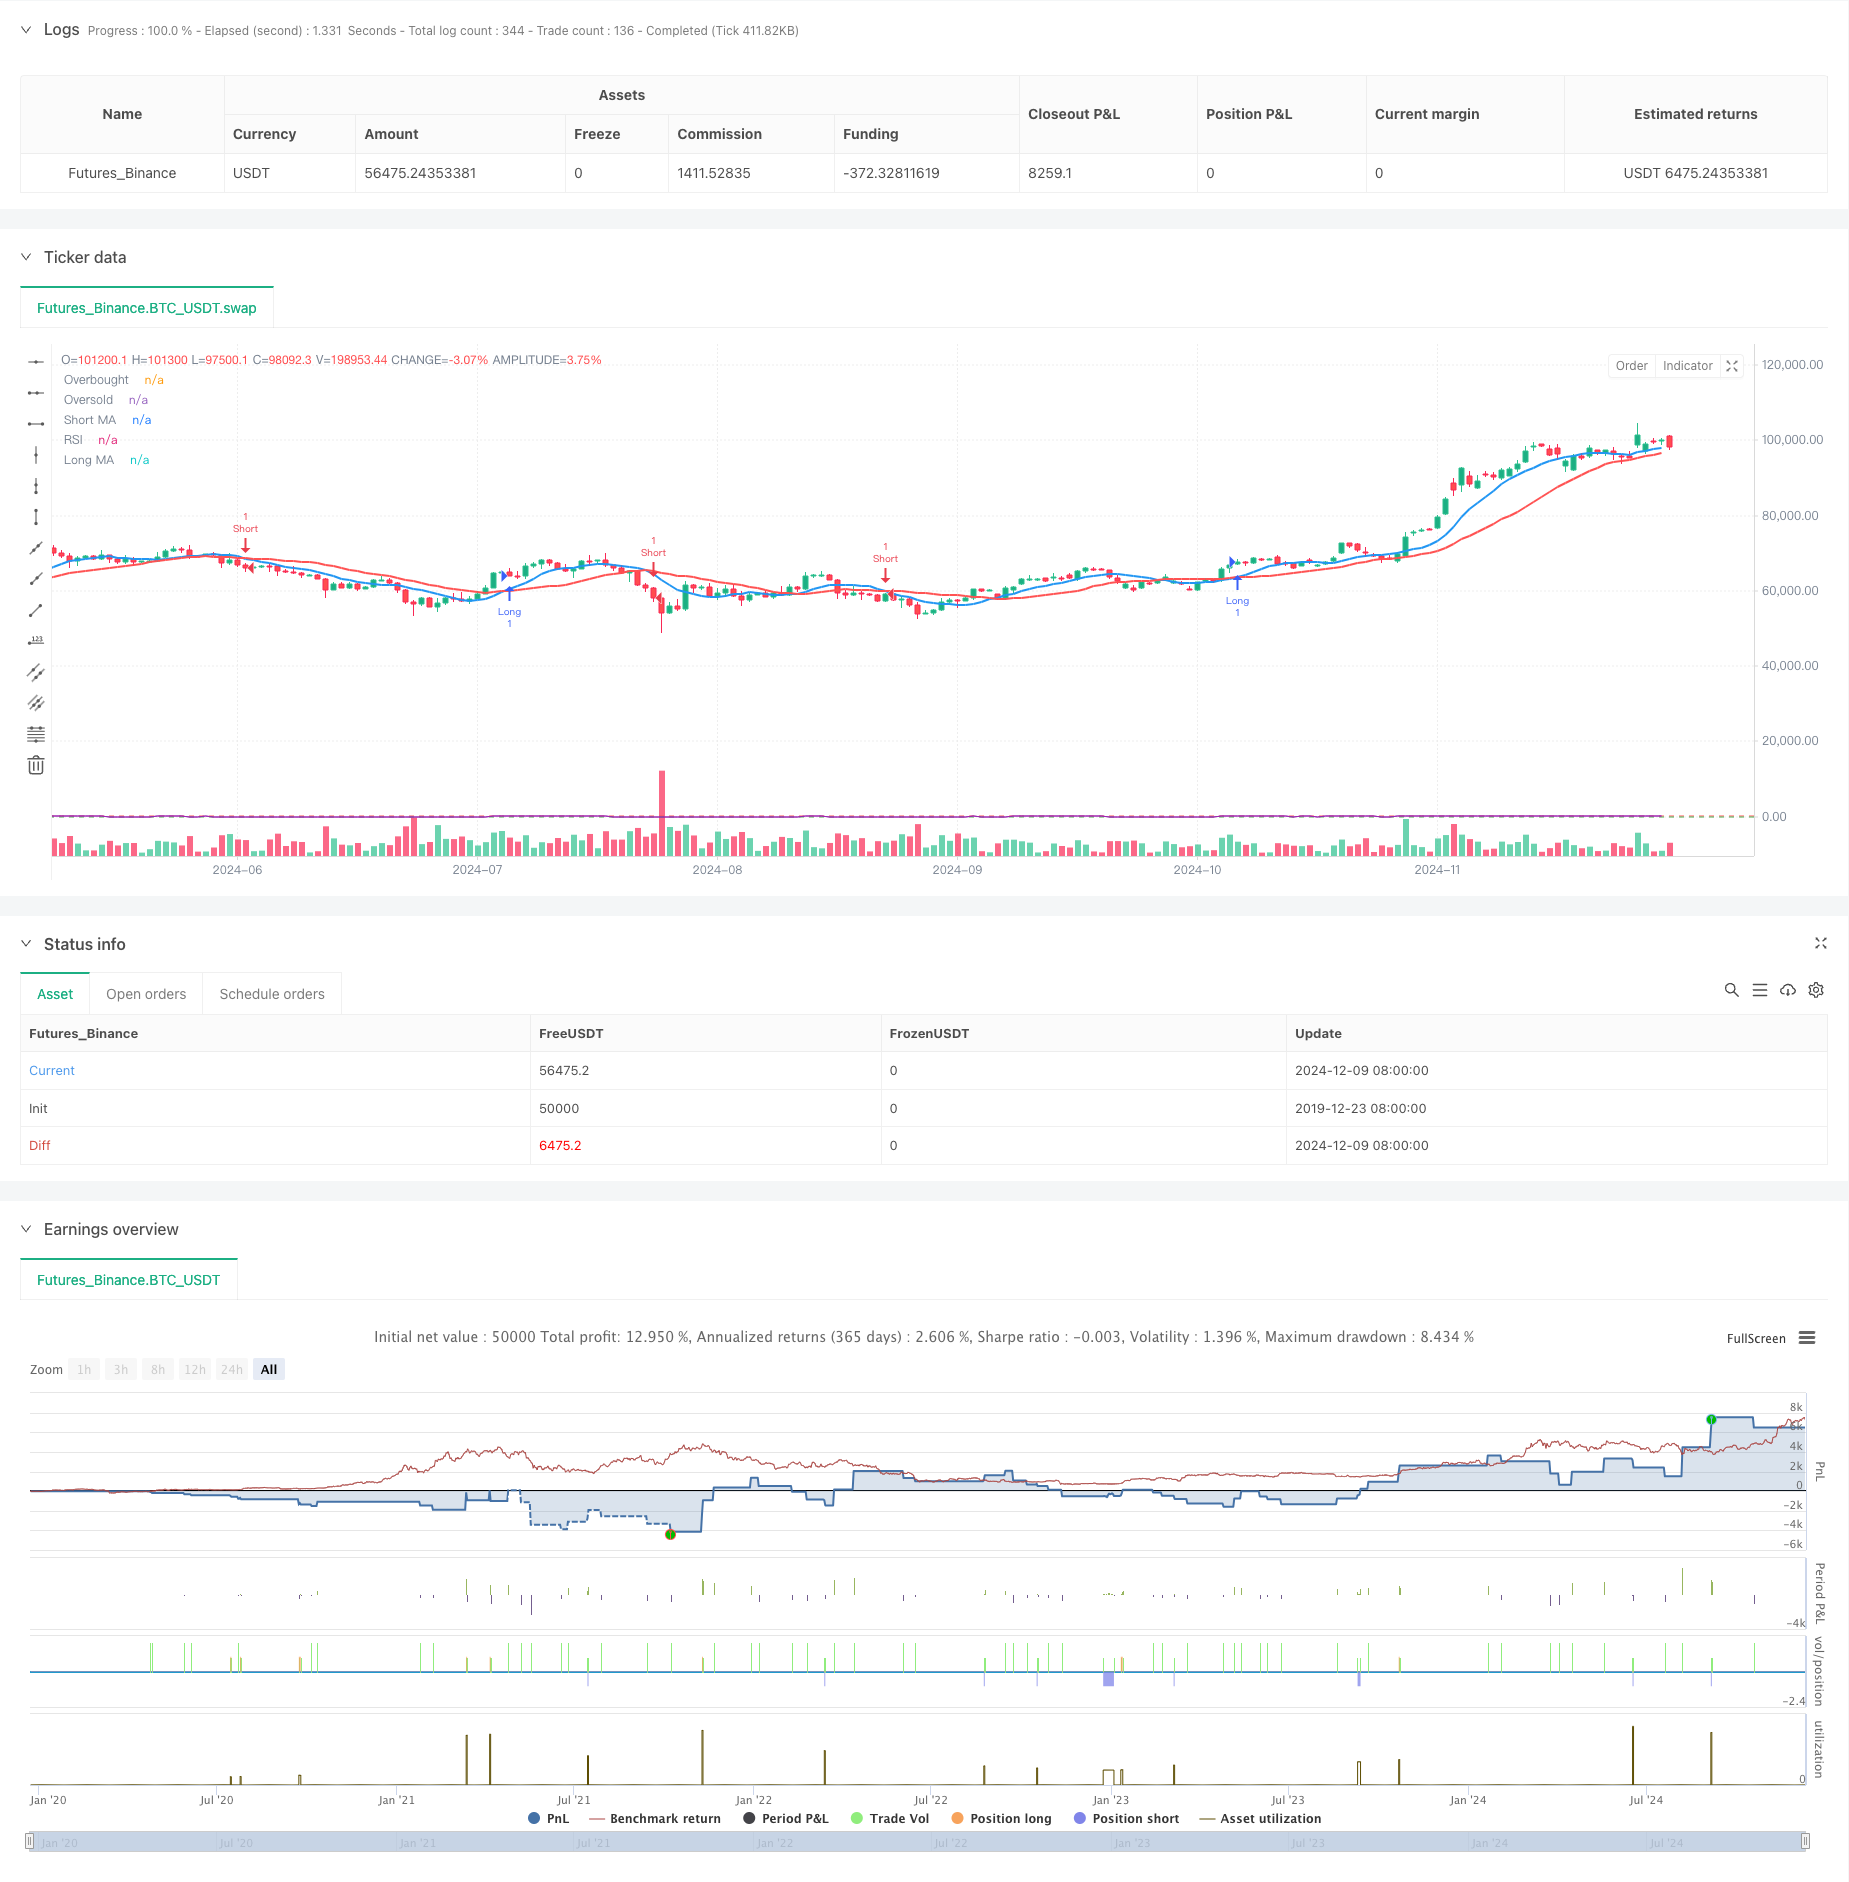
Moving Average Crossover with RSI Trend Momentum Tracking Strategy
Author: ChaoZhang, Date: 2024-12-12 16:22:25Tags: SMARSIMATPSL

Overview
This is a trend-following strategy that combines moving average crossovers with the Relative Strength Index (RSI). The strategy determines market trend direction through short-term and long-term moving average crossovers, while using RSI as a momentum filter to confirm trend strength, thereby improving the reliability of trading signals. The strategy also incorporates percentage-based stop-loss and take-profit for risk management.
Strategy Principles
The strategy employs 9-period and 21-period Simple Moving Averages (SMA) as primary trend indicators. Long signals are generated when the short-term MA crosses above the long-term MA and RSI is above 50, while short signals occur when the short-term MA crosses below the long-term MA and RSI is below 50. This design ensures trade direction aligns with both market trend and momentum. The system controls risk-reward ratio through 1% stop-loss and 2% take-profit levels.
Strategy Advantages
- Dual confirmation mechanism combining MA and RSI improves signal reliability.
- Percentage-based stop-loss and take-profit provides flexible and adaptive risk management.
- High parameter adaptability suitable for different market environments and instruments.
- Simple and clear strategy logic, easy to understand and maintain.
- RSI filtering reduces losses from false breakouts.
Strategy Risks
- May generate frequent false signals in ranging markets.
- Fixed percentage stops may not be flexible enough in highly volatile markets.
- Moving average systems have inherent lag, potentially missing optimal entry points.
- RSI indicator may become ineffective in extreme market conditions.
- Requires careful parameter optimization for different market environments.
Strategy Optimization Directions
- Introduce adaptive stop-loss and take-profit mechanisms that adjust dynamically with market volatility.
- Add volume indicators as additional confirmation signals.
- Optimize moving average periods, consider using Exponential Moving Averages (EMA) for increased sensitivity.
- Implement trend strength filters to reduce position size or pause trading during sideways markets.
- Add time filters to avoid trading during market opening and closing periods.
Summary
This is a well-structured trend-following strategy with clear logic. It provides basic trend direction through MA crossovers, momentum confirmation through RSI, combined with risk management mechanisms to form a complete trading system. While it has some inherent limitations, through continuous optimization and adjustment, the strategy has the potential to maintain stable performance across different market environments. The key to success lies in parameter optimization and risk control execution.
/*backtest
start: 2019-12-23 08:00:00
end: 2024-12-10 08:00:00
period: 1d
basePeriod: 1d
exchanges: [{"eid":"Futures_Binance","currency":"BTC_USDT"}]
*/

//@version=5
strategy("Moving Average Crossover + RSI Strategy", overlay=true, shorttitle="MA RSI Strategy")

// --- Input Parameters ---
shortMA = input.int(9, title="Short MA Period", minval=1)
longMA = input.int(21, title="Long MA Period", minval=1)
rsiLength = input.int(14, title="RSI Length", minval=1)
rsiOverbought = input.int(70, title="RSI Overbought Level", minval=50, maxval=100)
rsiOversold = input.int(30, title="RSI Oversold Level", minval=0, maxval=50)
stopLossPercent = input.float(1, title="Stop Loss Percentage", minval=0.1, maxval=10.0) / 100
takeProfitPercent = input.float(2, title="Take Profit Percentage", minval=0.1, maxval=10.0) / 100

// --- Calculate Moving Averages ---
shortMA_value = ta.sma(close, shortMA)
longMA_value = ta.sma(close, longMA)

// --- Calculate RSI ---
rsi_value = ta.rsi(close, rsiLength)

// --- Buy and Sell Conditions ---
longCondition = ta.crossover(shortMA_value, longMA_value) and rsi_value > 50
shortCondition = ta.crossunder(shortMA_value, longMA_value) and rsi_value < 50

// --- Plot Moving Averages ---
plot(shortMA_value, color=color.blue, linewidth=2, title="Short MA")
plot(longMA_value, color=color.red, linewidth=2, title="Long MA")

// --- Plot RSI (Optional) ---
hline(rsiOverbought, "Overbought", color=color.red)
hline(rsiOversold, "Oversold", color=color.green)
plot(rsi_value, color=color.purple, title="RSI")

// --- Strategy Execution ---
if (longCondition)
    strategy.entry("Long", strategy.long)

if (shortCondition)
    strategy.entry("Short", strategy.short)

// --- Risk Management (Stop Loss and Take Profit) ---
longStopLoss = close * (1 - stopLossPercent)
longTakeProfit = close * (1 + takeProfitPercent)

shortStopLoss = close * (1 + stopLossPercent)
shortTakeProfit = close * (1 - takeProfitPercent)

// Set the stop loss and take profit for long and short positions
strategy.exit("Long Exit", from_entry="Long", stop=longStopLoss, limit=longTakeProfit)
strategy.exit("Short Exit", from_entry="Short", stop=shortStopLoss, limit=shortTakeProfit)
- Dual Moving Average-RSI Synergy Options Quantitative Trading Strategy
- Trend Following RSI and Moving Average Combined Quantitative Trading Strategy
- Smooth Moving Average Stop Loss & Take Profit Strategy with Trend Filter and Exception Exit
- Dynamic Trend Following Strategy - Multi-Indicator Integrated Momentum Analysis System
- Dynamic Moving Average Crossover Trend Following Strategy with Adaptive Risk Management
- Dual Timeframe Stochastic Momentum Trading Strategy
- Dynamic Trailing Stop Dual Target Moving Average Crossover Strategy
- Trend Breakout Trading System with Moving Average (TBMA Strategy)
- Intelligent Moving Average Crossover Strategy with Dynamic Profit/Loss Management System
- Adaptive Quantitative Trading Strategy with Dual Moving Average Crossover and Take Profit/Stop Loss
- Dynamic Volatility Index (VIDYA) with ATR Trend-Following Reversal Strategy
- Multi-Indicator Adaptive Trading Strategy Based on RSI, MACD and Volume
- Price Pattern Based Double Bottom and Top Automated Trading Strategy
- Dynamic ATR Trend Following Strategy Based on Support Breakout
- Multiple Moving Average and Stochastic Oscillator Crossover Quantitative Strategy
- Adaptive Trend Following and Reversal Detection Strategy: A Quantitative Trading System Based on ZigZag and Aroon Indicators
- Multi-Indicator Synergistic Trading Strategy with Bollinger Bands, Fibonacci, MACD and RSI
- Mean Reversion Bollinger Band Dollar-Cost Averaging Investment Strategy
- Multi-dimensional Gold Friday Anomaly Strategy Analysis System
- Multi-Timeframe Trend Dynamic ATR Tracking Strategy
- Dynamic ATR-based Trailing Stop Trading Strategy
- Momentum Trend Following MACD-RSI Dual Confirmation Trading Strategy
- Dynamic Pivot Points with Golden Cross Optimization System
- Multi-Indicator Trend Following Strategy with Bollinger Bands and ATR Dynamic Stop Loss
- Dynamic Trend Following ATR Multi-Period Trading Strategy
- Multi-Indicator Trend Following Strategy with Dynamic Channel and Moving Average Trading System
- Multi-EMA Trend Following Strategy with SMMA Confirmation
- Multi-Indicator Trend Trading System with Momentum Analysis Strategy
- Trend-Following Cloud Momentum Divergence Strategy
- Multi-Indicator Trend Following and Volatility Breakout Strategy