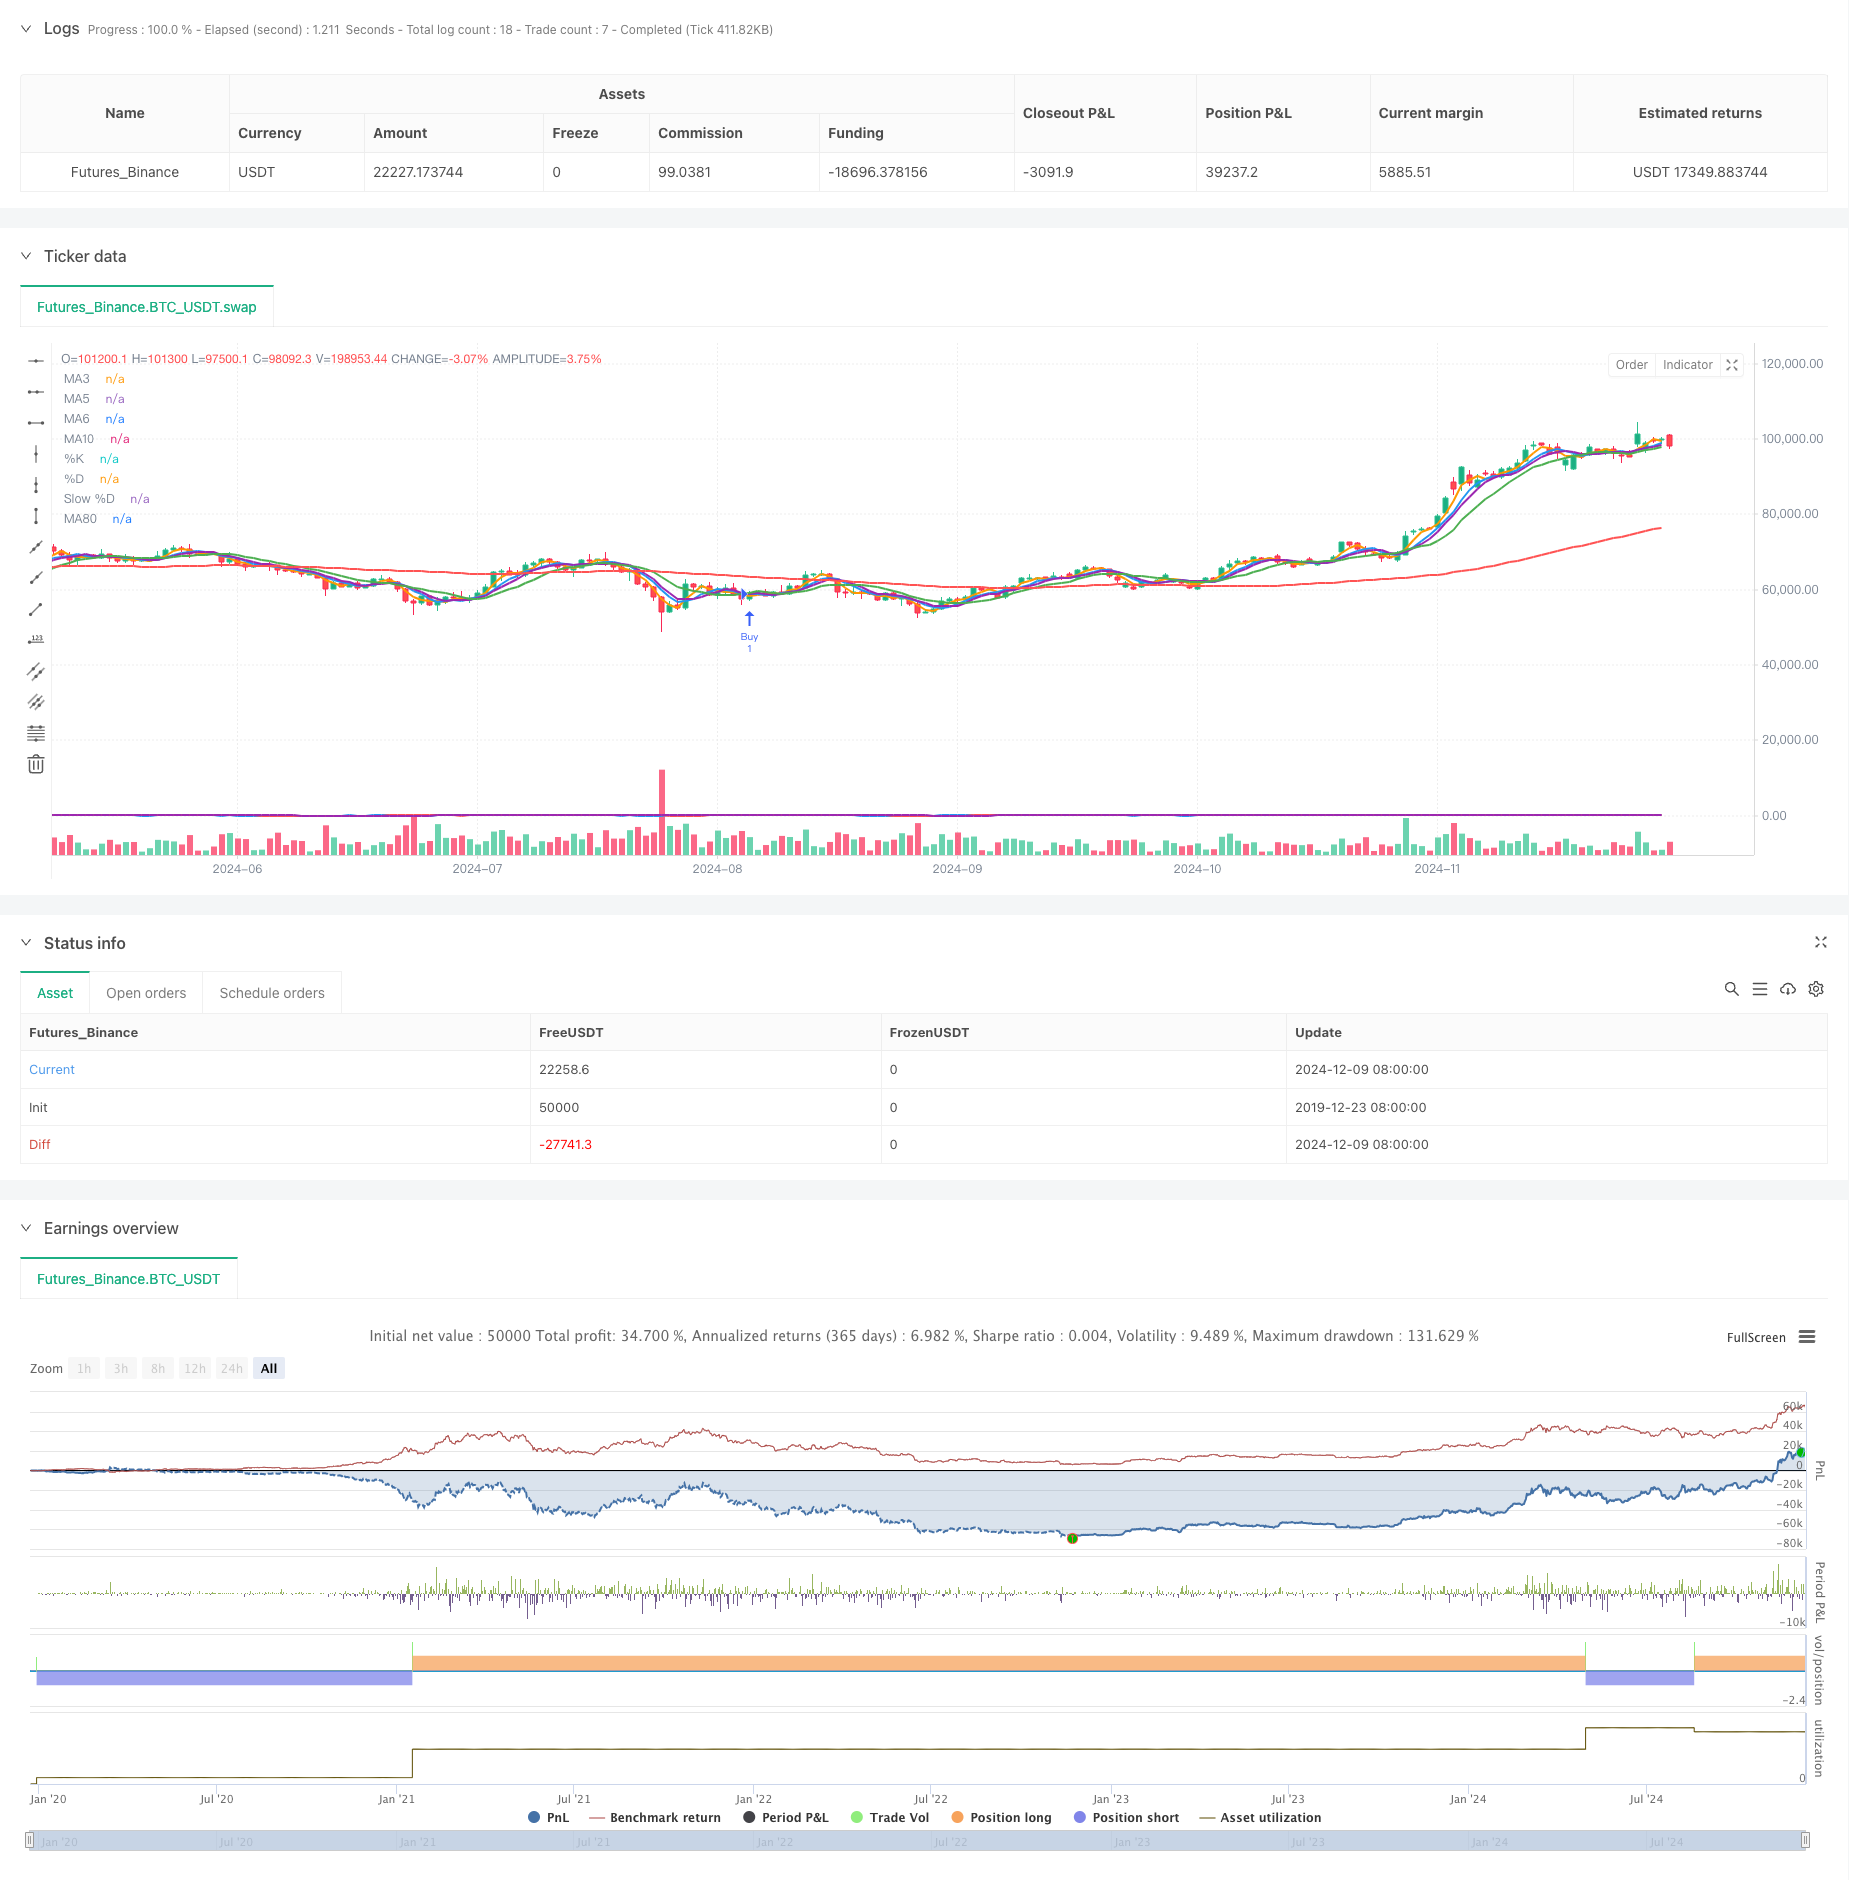
Overview
This strategy is a quantitative trading approach that combines multiple moving averages with stochastic oscillator crossover signals. It utilizes short-term, medium-term, and long-term moving averages, along with the overbought/oversold characteristics of the stochastic oscillator, to capture market trend reversals and trading opportunities through multiple signal confirmations. The strategy’s core strength lies in its use of multiple technical indicators for cross-validation to enhance signal reliability.
Strategy Principle
The strategy employs five moving averages (3-day, 5-day, 6-day, 10-day, and 80-day) and the Stochastic Oscillator. Trading signals are triggered based on the following conditions: 1. Buy Signal: When MA10 crosses above both MA5 and MA6, coinciding with the Stochastic %K line crossing above the %D line. 2. Sell Signal: When MA5 crosses below both MA10 and MA6, coinciding with the Stochastic %D line crossing below the %K line. The strategy uses a 15-period %K and 9-period %D with additional smoothing through moving averages.
Strategy Advantages
- Multiple Confirmation Mechanism: Reduces false breakout risks through cross-validation of multiple moving averages and stochastic oscillator signals.
- Combined Trend Following and Oscillation: Captures both trending movements and overbought/oversold conditions, improving trading accuracy.
- Signal Stability: Filters market noise through multiple moving average crossover confirmations.
- High Adaptability: Applicable across different market conditions and timeframes.
Strategy Risks
- Lag Risk: Moving averages are inherently lagging indicators, potentially causing delayed entry and exit points.
- Sideways Market Risk: May generate frequent false signals in range-bound markets.
- Parameter Sensitivity: Multiple indicator parameters require thorough testing and may need adjustment for different market conditions.
- Signal Conflict: Multiple indicators may generate contradictory signals, requiring a clear priority mechanism.
Strategy Optimization Directions
- Dynamic Parameter Adjustment: Automatically adjust moving average periods and stochastic oscillator parameters based on market volatility.
- Enhanced Trend Filtering: Incorporate ADX or similar trend indicators to adjust strategy parameters during strong trends.
- Stop Loss Optimization: Implement a combination of trailing and fixed stop losses.
- Volume Confirmation: Integrate volume indicators for signal validation to improve reliability.
- Market Environment Recognition: Add market condition assessment modules to adapt parameters to different market states.
Summary
This strategy establishes a comprehensive trading system through the combination of multiple moving averages and stochastic oscillator. Its strengths lie in signal reliability and system stability, though attention must be paid to trading costs and market condition adaptability. Through continuous optimization and refinement, this strategy shows promise for achieving stable returns in real trading conditions.
/*backtest
start: 2019-12-23 08:00:00
end: 2024-12-10 08:00:00
period: 1d
basePeriod: 1d
exchanges: [{"eid":"Futures_Binance","currency":"BTC_USDT"}]
*/

//@version=5
strategy(title="Moving Average and Stochastic Crossover Strategy", overlay=true)

// Calculate the moving averages
ma3 = ta.sma(close, 3)
ma5 = ta.sma(close, 5)
ma6 = ta.sma(close, 6)
ma10 = ta.sma(close, 10)
ma80 = ta.sma(close, 80)

// Stochastic Oscillator with settings %K(15), %D(9), and slowing 9
k = ta.stoch(close, high, low, 15)
d = ta.sma(k, 9)
slow_d = ta.sma(d, 9)

// Buy signal confirmation: MA10 crosses above MA5, MA6, and K line crosses above D line
buySignalConfirmation = ta.crossover(ma10, ma5) and ta.crossover(ma10, ma6) and ta.crossover(k, d)

// Sell signal confirmation: MA5 crosses above MA10, MA6, and D line crosses above K line
sellSignalConfirmation = ta.crossunder(ma5, ma10) and ta.crossunder(ma5, ma6) and ta.crossunder(d, k)

// Strategy logic
if (buySignalConfirmation)
    strategy.entry("Buy", strategy.long)

if (sellSignalConfirmation)
    strategy.entry("Sell", strategy.short)

// Plot the moving averages and Stochastic Oscillator for visualization
plot(ma3, color=color.orange, title="MA3", linewidth=2)
plot(ma5, color=color.blue, title="MA5", linewidth=2)
plot(ma6, color=color.purple, title="MA6", linewidth=2)
plot(ma10, color=color.green, title="MA10", linewidth=2)
plot(ma80, color=color.red, title="MA80", linewidth=2)

plot(k, color=color.blue, title="%K", linewidth=2)
plot(d, color=color.red, title="%D", linewidth=2)
plot(slow_d, color=color.purple, title="Slow %D", linewidth=2)