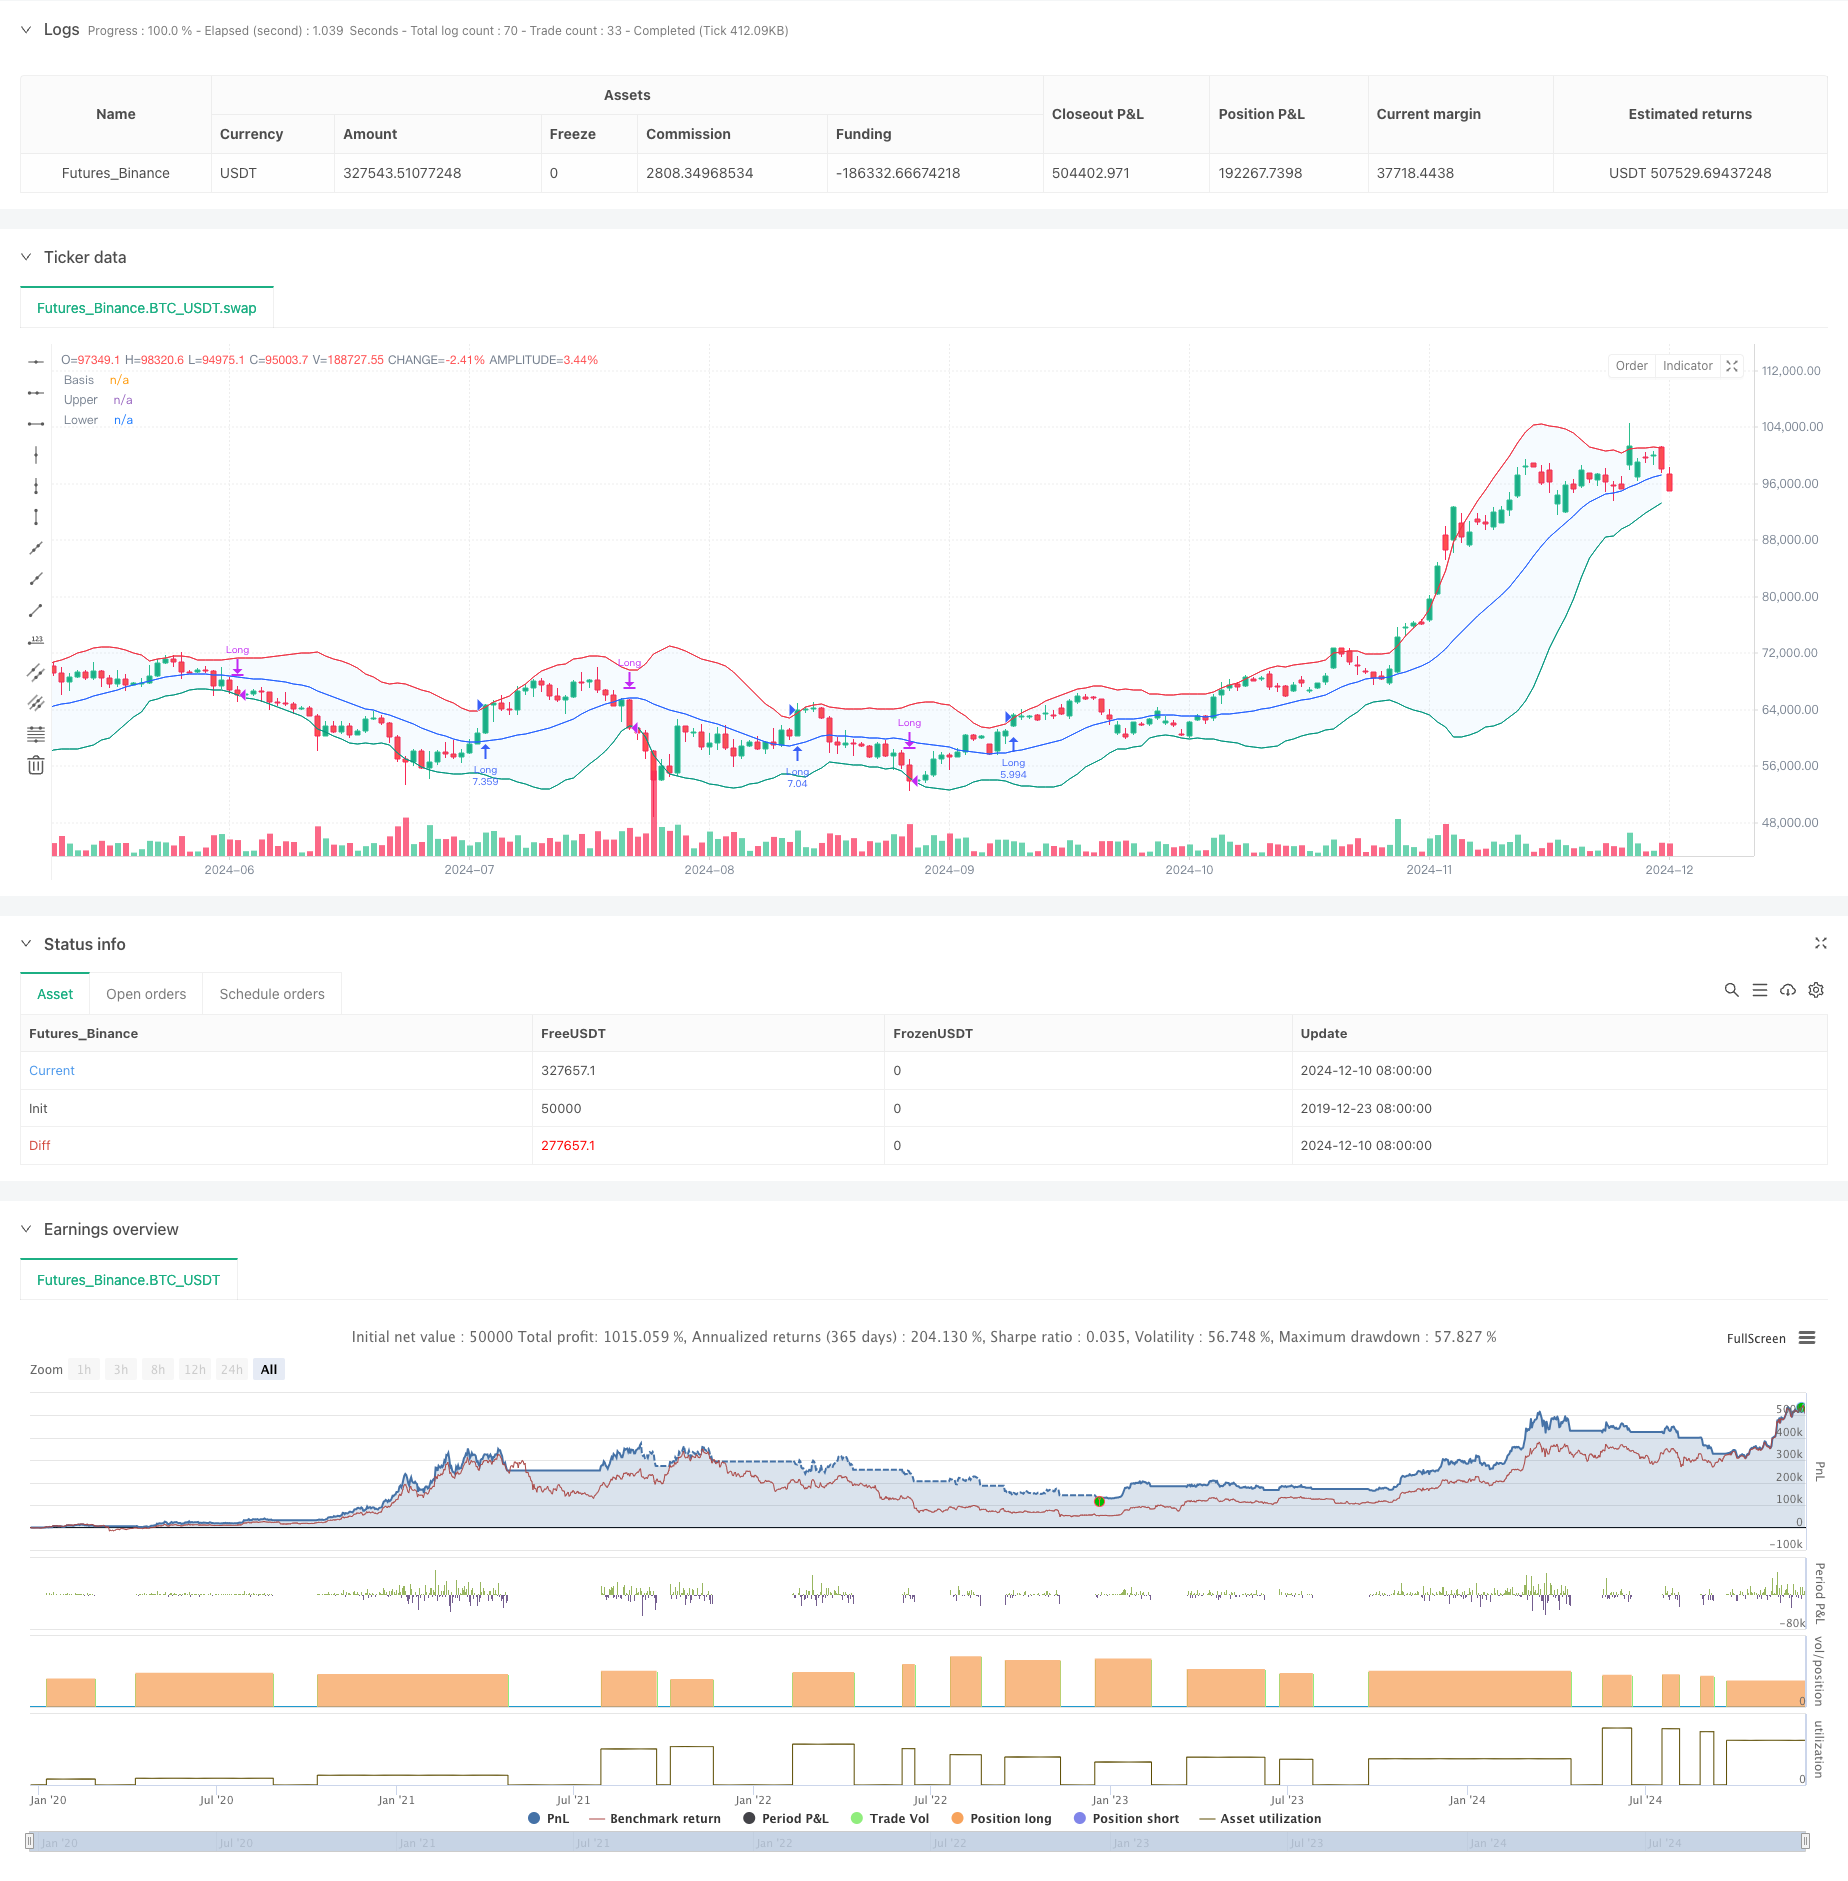
Bollinger Bands Momentum Breakout Adaptive Trend Following Strategy
Author: ChaoZhang, Date: 2024-12-13 11:43:10Tags: BBstdevSMAEMASMMAWMAVWMAATR

Overview
This strategy is a momentum breakout trading system based on Bollinger Bands, primarily capturing trend opportunities through the relationship between price and the upper Bollinger Band. The strategy employs an adaptive moving average type selection mechanism, combined with standard deviation channels to identify market volatility characteristics, particularly suitable for markets with high volatility.
Strategy Principle
The core logic of the strategy is based on the following key elements: 1. Uses customizable moving averages (including SMA, EMA, SMMA, WMA, VWMA) to calculate the middle band of Bollinger Bands. 2. Dynamically determines upper and lower band positions through standard deviation multiplier (default 2.0). 3. Enters long positions when price breaks above the upper band, indicating formation of strong breakout trends. 4. Exits positions when price falls below the lower band, suggesting potential end of uptrend. 5. Incorporates trading costs (0.1%) and slippage (3 points), better reflecting real trading conditions.
Strategy Advantages
- High Adaptability: Through multiple moving average type options, the strategy can adapt to different market conditions.
- Robust Risk Control: Uses Bollinger Bands lower band as stop loss, providing clear risk control.
- Rational Money Management: Employs position sizing based on equity percentage, avoiding risks of fixed position sizes.
- Comprehensive Cost Consideration: Includes commission and slippage factors, making backtesting results more realistic.
- Flexible Time Framework: Allows selection of specific trading time ranges through parameter settings.
Strategy Risks
- False Breakout Risk: Frequent false breakout signals may occur in ranging markets. Solution: Add confirmation indicators or delayed entry mechanisms.
- Trend Reversal Risk: Sudden reversals in strong trend markets may cause significant losses. Solution: Implement trend strength filters.
- Parameter Sensitivity: Different parameter combinations may lead to varying strategy performance. Solution: Requires thorough parameter optimization and robustness testing.
Strategy Optimization Directions
- Introduce Trend Strength Indicators:
- Add ADX or similar indicators to filter signals in weak trend markets
- This can reduce losses from false breakouts
- Optimize Stop Loss Mechanism:
- Implement dynamic stop loss, such as trailing stops
- Helps capture larger profits in continuing trends
- Add Trading Filters:
- Volume-based confirmation signals
- Avoid trading in low liquidity environments
- Enhance Entry Mechanism:
- Add pullback entry mechanisms
- Helps achieve better entry prices
Summary
This is a well-designed trend following strategy with clear logic. It captures market momentum through the dynamic nature of Bollinger Bands and includes good risk control mechanisms. The strategy is highly customizable and can adapt to different market environments through parameter adjustments. For live trading implementation, it is recommended to conduct thorough parameter optimization and backtesting validation, while incorporating the suggested optimization directions for strategy improvement.
/*backtest
start: 2019-12-23 08:00:00
end: 2024-12-11 08:00:00
period: 1d
basePeriod: 1d
exchanges: [{"eid":"Futures_Binance","currency":"BTC_USDT"}]
*/

//@version=5
strategy("Demo GPT - Bollinger Bands", overlay=true, initial_capital=10000, commission_type=strategy.commission.percent, commission_value=0.1, slippage=3, default_qty_type=strategy.percent_of_equity, default_qty_value=100)

// Inputs
length = input.int(20, minval=1, title="Length")
maType = input.string("SMA", "Basis MA Type", options = ["SMA", "EMA", "SMMA (RMA)", "WMA", "VWMA"])
src = input(close, title="Source")
mult = input.float(2.0, minval=0.001, maxval=50, title="StdDev")
offset = input.int(0, "Offset", minval=-500, maxval=500)

// Date range inputs
startYear = input.int(2018, "Start Year", minval=1970, maxval=2100)
startMonth = input.int(1, "Start Month", minval=1, maxval=12)
startDay = input.int(1, "Start Day", minval=1, maxval=31)
endYear = input.int(2069, "End Year", minval=1970, maxval=2100)
endMonth = input.int(12, "End Month", minval=1, maxval=12)
endDay = input.int(31, "End Day", minval=1, maxval=31)

// Time range
startTime = timestamp("GMT+0", startYear, startMonth, startDay, 0, 0)
endTime = timestamp("GMT+0", endYear, endMonth, endDay, 23, 59)

// Moving average function
ma(source, length, _type) =>
    switch _type
        "SMA" => ta.sma(source, length)
        "EMA" => ta.ema(source, length)
        "SMMA (RMA)" => ta.rma(source, length)
        "WMA" => ta.wma(source, length)
        "VWMA" => ta.vwma(source, length)

// Calculate Bollinger Bands
basis = ma(src, length, maType)
dev = mult * ta.stdev(src, length)
upper = basis + dev
lower = basis - dev

// Plot
plot(basis, "Basis", color=#2962FF, offset=offset)
p1 = plot(upper, "Upper", color=#F23645, offset=offset)
p2 = plot(lower, "Lower", color=#089981, offset=offset)
fill(p1, p2, title="Background", color=color.rgb(33, 150, 243, 95))

// Strategy logic: Only go long and flat
inDateRange = time >= startTime and time <= endTime
noPosition = strategy.position_size == 0
longPosition = strategy.position_size > 0

// Buy if close is above upper band
if inDateRange and noPosition and close > upper
    strategy.entry("Long", strategy.long)

// Sell/Exit if close is below lower band
if inDateRange and longPosition and close < lower
    strategy.close("Long")
- Multi-Level Intelligent Dynamic Trailing Stop Strategy Based on Bollinger Bands and ATR
- Multi-Layer Volatility Band Trading Strategy
- Advanced Quantitative Trading Strategy Combining RSI Divergence and Moving Averages
- Bollinger Bands and Moving Average Crossover Strategy
- Dynamic RSI Smart Timing Swing Trading Strategy
- Multi-Indicator Synergistic Trading Strategy with Bollinger Bands, Fibonacci, MACD and RSI
- Multi-Indicator Adaptive Trading Strategy Based on RSI, MACD and Volume
- Enhanced Bollinger Mean Reversion Quantitative Strategy
- Crodl's Supertrend
- SSS
- Dual Exponential Moving Average and Relative Strength Index Crossover Strategy
- Dual Momentum Oscillator Smart Timing Trading Strategy
- Advanced Quantitative Trend Capture Strategy with Dynamic Range Filter
- TradingView signal execution policy (built-in HTTP service version)
- Advanced Five-Day Cross-Analysis Strategy Based on RSI and MACD Integration
- Adaptive Range Trading System Based on Dual RSI Indicators
- Dynamic Dual Supertrend Volume-Price Strategy
- Black Swan Volatility and Moving Average Crossover Momentum Tracking Strategy
- Intelligent Volatility Range Trading Strategy Combining Bollinger Bands and SuperTrend
- Multi-Indicator Synergistic Trend Following Strategy with Dynamic Stop-Loss System
- Enhanced Mean Reversion Strategy with MACD-ATR Implementation
- Quantitative Trading Signal Tracking and Multi-Exit Strategy Optimization System
- Dual Moving Average and MACD Combined Trend Following Dynamic Take Profit Smart Trading System
- Triple Standard Deviation Bollinger Bands Breakout Strategy with 100-Day Moving Average Optimization
- Dynamic EMA Trend Crossover Entry Quantitative Strategy
- Multi-Wave Trend Crossing Risk Management Quantitative Strategy
- Dual EMA Stochastic Trend Following Trading Strategy
- Dynamic Trend Following Multi-Period Moving Average Crossover Strategy
- Dual Momentum Breakthrough Confirmation Quantitative Trading Strategy
- MACD-RSI Trend Momentum Cross Strategy with Risk Management Model