概述
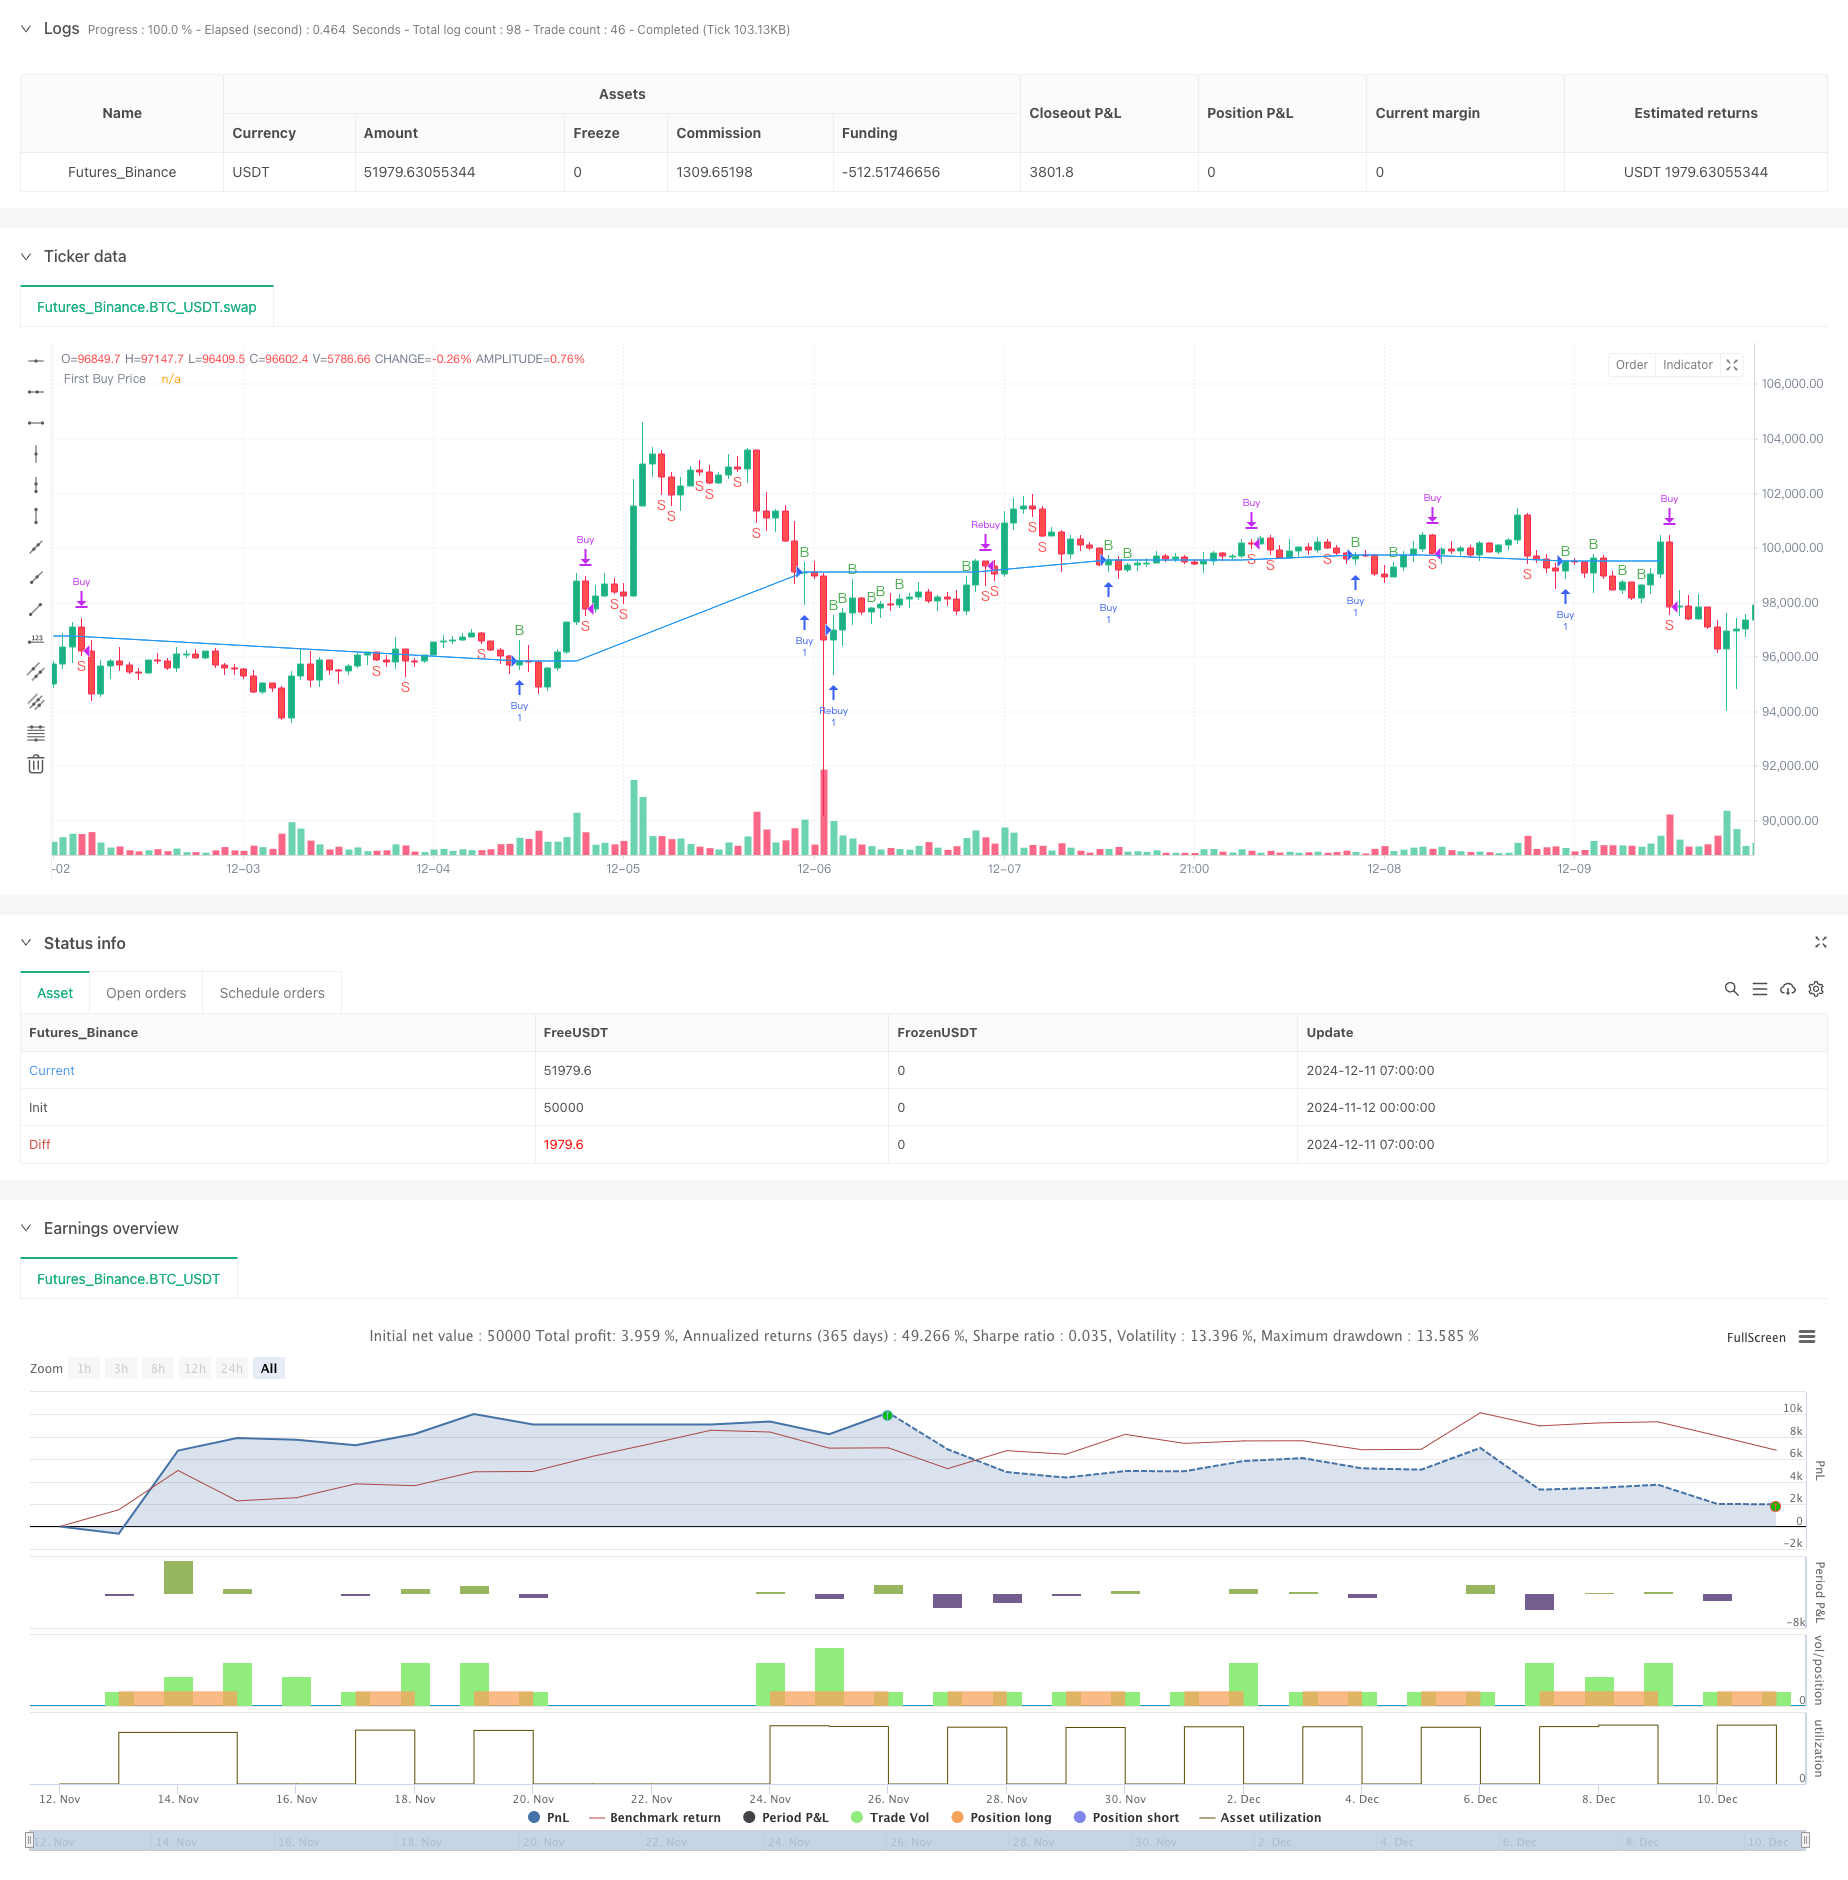
该策略是一个基于双重RSI(相对强弱指数)指标的自适应交易系统。它结合了不同时间周期的RSI指标来识别市场趋势和交易机会,并通过资金管理和风险控制机制来优化交易表现。该策略的核心在于通过多周期RSI的协同配合,在保证交易安全性的同时提高盈利能力。
策略原理
策略采用7周期的RSI指标作为主要交易信号,同时结合日线RSI作为趋势过滤器。当短周期RSI从40以下向上突破且日线RSI大于55时,系统会发出做多信号。如果持仓期间价格下跌低于首次建仓价格,系统会自动加仓以降低平均成本。当RSI从60以上向下突破时,系统平仓获利。同时设置了5%的止损以控制风险。策略还包含了资金管理模块,根据总资金和预设风险比例自动计算每次交易的仓位大小。
策略优势
- 多周期RSI配合提高了信号的可靠性
- 具备自适应的加仓机制,可以有效降低持仓成本
- 完善的资金管理系统,根据风险偏好自动调整仓位
- 固定止损保护,严格控制每笔交易的风险
- 考虑了交易成本,更符合实际交易环境
策略风险
- RSI指标可能在剧烈波动市场中产生虚假信号
- 加仓机制在持续下跌行情中可能导致较大损失
- 固定百分比止损可能在高波动率时期过于保守
- 交易成本可能在频繁交易时显著影响收益
- 需要充足的流动性支持策略执行
策略优化方向
- 引入波动率指标(如ATR)来动态调整止损位置
- 增加趋势强度过滤器以减少震荡市场中的虚假信号
- 优化加仓逻辑,考虑市场波动性进行动态调整
- 加入更多时间周期的RSI确认信号
- 开发自适应的仓位管理系统
总结
这是一个结合了技术分析和风险管理的完整交易系统。通过多周期RSI的协同作用提供交易信号,并通过资金管理和止损机制控制风险。该策略适合在趋势明显的市场中运行,但需要根据实际市场情况进行参数优化。系统的可扩展性良好,为进一步优化预留了空间。
策略源码
/*backtest
start: 2024-11-12 00:00:00
end: 2024-12-11 08:00:00
period: 1h
basePeriod: 1h
exchanges: [{"eid":"Futures_Binance","currency":"BTC_USDT"}]
*/

//@version=5
strategy("Dual RSI with Rebuy Logic + Capital, Commission, and Stop Loss", overlay=true)

// Parameter
rsi_length = input.int(7, title="RSI Length")
daily_rsi_length = input.int(7, title="Daily RSI Length")
capital = input.float(10000, title="Initial Capital", minval=0)  // Kapital
risk_per_trade = input.float(0.01, title="Risk per Trade (%)", minval=0.01, maxval=1.0)  // Risikogröße in Prozent
commission = input.float(0.1, title="Commission (%)", minval=0, maxval=100)  // Kommission in Prozent
stop_loss_pct = input.float(5, title="Stop Loss (%)", minval=0.1, maxval=100)  // Stop-Loss in Prozent

// Ordergröße berechnen
risk_amount = capital * risk_per_trade
order_size = risk_amount / close  // Größe der Order basierend auf Risikogröße und Preis

// Daily RSI
day_rsi = request.security(syminfo.tickerid, "D", ta.rsi(close, daily_rsi_length), lookahead=barmerge.lookahead_on)

// RSI auf aktuellem Timeframe
rsi = ta.rsi(close, rsi_length)

// Kauf- und Verkaufsbedingungen
buy_condition = rsi[1] < 40 and rsi > rsi[1] and day_rsi > 55
sell_condition = rsi[1] > 60 and rsi < rsi[1]

// Variablen, um den Preis des ersten Kaufs zu speichern
var float first_buy_price = na
var bool is_position_open = false

// Kauf-Logik
if buy_condition
    if not is_position_open
        // Initiales Kaufsignal
        strategy.entry("Buy", strategy.long, qty=1)
        first_buy_price := close
        is_position_open := true
    else if close < first_buy_price
        // Rebuy-Signal, nur wenn Preis niedriger als erster Kaufpreis
        strategy.entry("Rebuy", strategy.long, qty=1)

// Verkaufs-Logik
if sell_condition and is_position_open
    strategy.close("Buy")
    strategy.close("Rebuy")
    first_buy_price := na  // Zurücksetzen des Kaufpreises
    is_position_open := false

// Stop-Loss-Bedingung
if is_position_open
    // Stop-Loss-Preis berechnen (5% unter dem Einstiegspreis)
    stop_loss_price = first_buy_price * (1 - stop_loss_pct / 100)

    // Stop-Loss für "Buy" und "Rebuy" festlegen
    strategy.exit("Stop Loss Buy", from_entry="Buy", stop=stop_loss_price)
    strategy.exit("Stop Loss Rebuy", from_entry="Rebuy", stop=stop_loss_price)

// Performance-Metriken berechnen (mit Kommission)
gross_profit = strategy.netprofit / capital * 100
commission_cost = commission / 100 * strategy.closedtrades
net_profit = gross_profit - commission_cost

// Debug-Plots
plot(first_buy_price, title="First Buy Price", color=color.blue, linewidth=1)
plotchar(buy_condition, title="Buy Condition", char='B', location=location.abovebar, color=color.green)
plotchar(sell_condition, title="Sell Condition", char='S', location=location.belowbar, color=color.red)

// Debugging für Performance
相关推荐
- 增强型双重枢轴点反转交易策略
- 基于动态波动率调整的双均线交叉与RSI/ATR复合过滤交易系统
- 高胜率趋势均值回归交易策略
- 基于多重均线动量的交易策略结合成交量加权均价和相对强弱指标确认系统
- 动态均线交叉结合RSI动量和ATR波动率的多层级确认交易策略
- 基于多时间周期赫斯特指数与斐波那契回撤的动态趋势交易策略
- 多因子趋势价格行为策略与动态风险管理系统
- 动态RSI突破趋势跟踪交易策略结合风险收益比优化系统
- 动态风险管理的指数均线交叉策略
- RSI与Supertrend趋势跟踪型自适应波动策略
更多内容
- 多时间周期流动性枢纽热力图量化策略
- 多重时框趋势追踪与ATR止盈止损策略
- 高级趋势追踪与自适应跟踪止损策略
- 多重技术指标趋势跟踪与动量RSI过滤交易策略
- 动态风险管理的指数均线交叉策略
- 双指数移动平均线与相对强弱指数交叉策略
- 双重动量振荡器智能择时交易策略
- 高级量化趋势捕捉策略结合动态范围过滤器
- TradingView信号执行策略(内建Http服务版本)
- 基于RSI和MACD的五日内交叉灵活入场策略优化版本研究
- 动态双重超趋势量价策略
- 黑天鹅波动与均线交叉动量跟踪策略
- 布林带结合超级趋势的智能波动区间交易策略
- 多指标协同趋势跟踪策略与动态止损系统
- 基于波林格带动量突破的自适应趋势跟踪交易策略
- 均值回归增强型MACD-ATR策略
- 量化交易信号追踪与多样化退出策略优化系统
- 双移动平均线与MACD结合的趋势跟踪动态止盈智能交易系统
- 三倍标准差布林带突破量化交易策略结合百日均线优化
- EMA趋势交叉动态入场量化策略