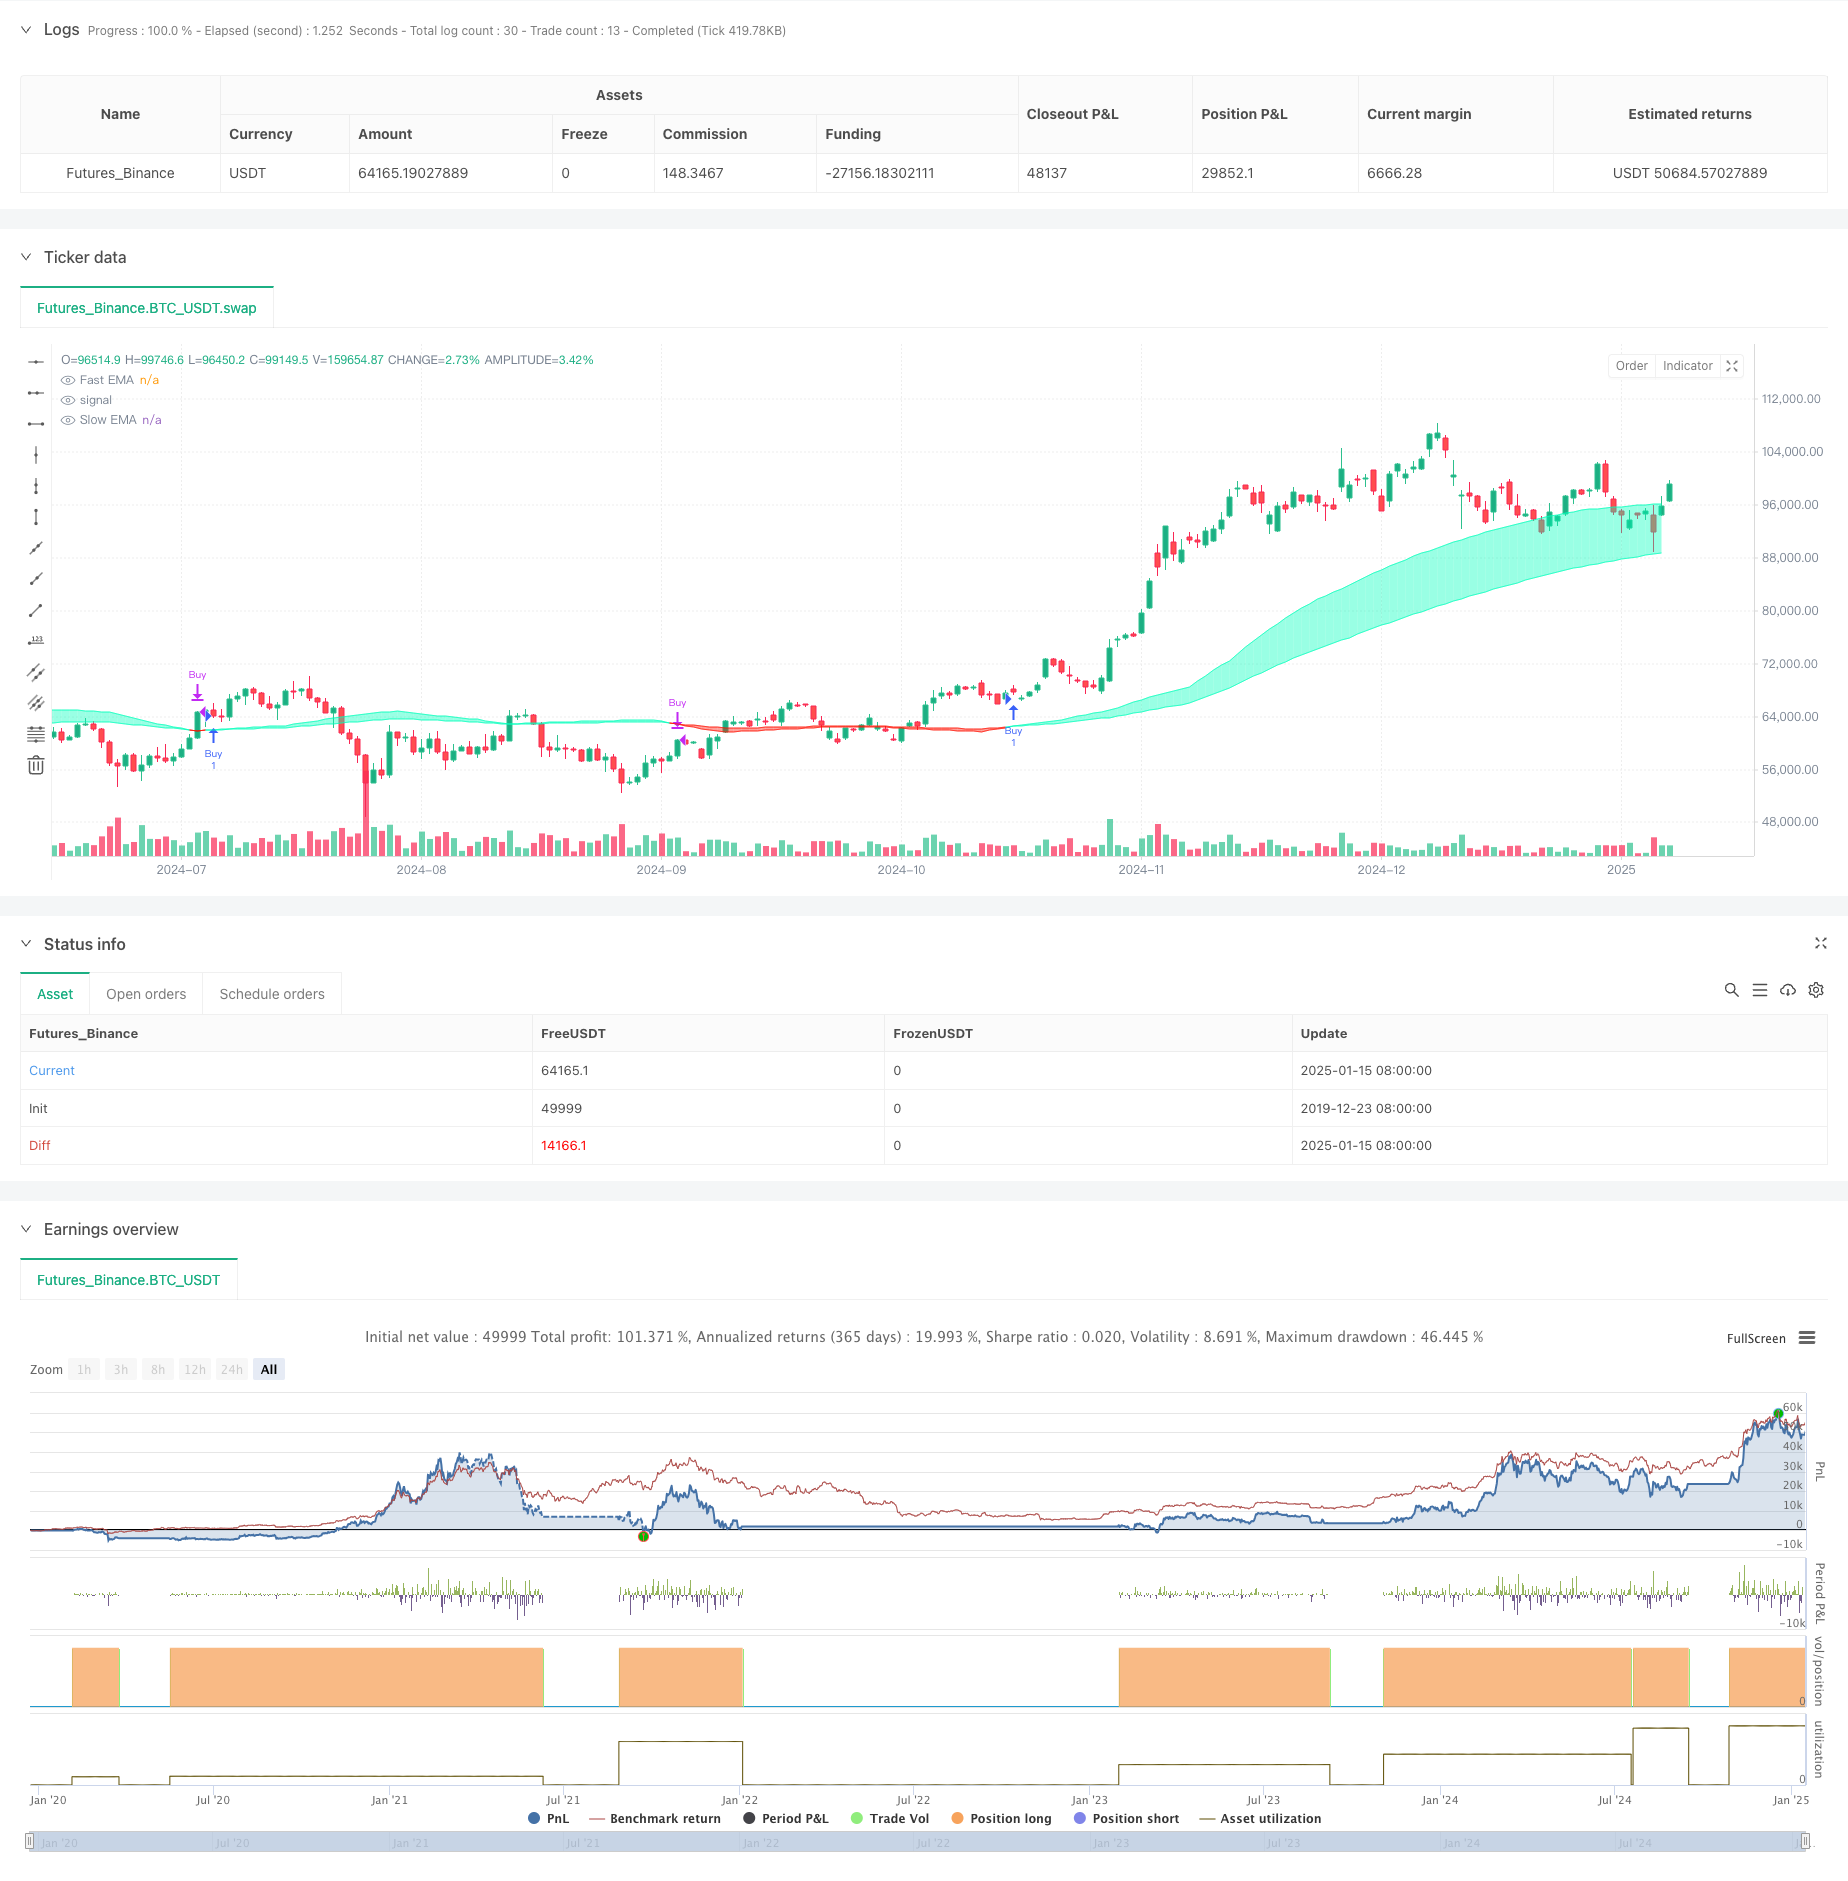
Overview
This strategy is a trading system based on liquidity-weighted moving averages, measuring market liquidity through the relationship between price movement and trading volume. It constructs fast and slow moving averages to generate buy signals when the fast line crosses above the slow line and sell signals when it crosses below. The strategy particularly focuses on abnormal liquidity events, recording key price levels in an array for more precise trading opportunities.
Strategy Principles
The core mechanism relies on measuring market liquidity through the ratio of volume to price movement. The implementation follows these steps: 1. Calculate liquidity indicator: Volume divided by absolute difference between close and open prices 2. Set liquidity boundary: Identify abnormal liquidity using EMA and standard deviation 3. Maintain price array: Record prices when liquidity boundary is breached 4. Construct moving averages: Calculate fast and slow EMAs based on liquidity events 5. Generate trading signals: Determine entry and exit points through moving average crossovers
Strategy Advantages
- Liquidity awareness: More accurately captures market activity by combining volume and price movement
- Event tracking: Records key price levels through array implementation, preventing missed opportunities
- Dynamic adaptation: EMA’s decreasing weights allow better market adjustment
- Risk control: Provides clear entry and exit signals through crossovers
- Customizability: Multiple adjustable parameters for different market conditions
Strategy Risks
- Parameter sensitivity: Strategy effectiveness heavily depends on parameter settings
- Lag: Inherent delay in moving average-based systems
- Market dependence: Unstable performance in certain timeframes and markets
- False breakouts: May generate incorrect signals during high volatility
- Transaction costs: Frequent trading may incur significant costs
Optimization Directions
- Implement filters:
- Add trend confirmation indicators like ADX
- Use volatility indicators to filter false signals
- Improve entry timing:
- Incorporate support and resistance levels
- Consider volume breakout confirmation
- Optimize parameter selection:
- Implement adaptive parameters
- Adjust dynamically based on market conditions
- Enhance risk management:
- Add stop-loss and take-profit mechanisms
- Implement position sizing system
Summary
This innovative strategy combines liquidity analysis with technical indicators, optimizing traditional moving average crossover systems by monitoring market liquidity anomalies. While it shows promising results in specific market conditions, further optimization is needed to improve stability and applicability. Traders should thoroughly test before live implementation and consider combining with other indicators for a more robust trading system.
/*backtest
start: 2019-12-23 08:00:00
end: 2025-01-16 00:00:00
period: 1d
basePeriod: 1d
exchanges: [{"eid":"Futures_Binance","currency":"BTC_USDT","balance":49999}]
*/

//Liquidity ignoring price location

//@version=6
strategy("Liquidity Weighted Moving Averages [AlgoAlpha]", overlay=true, commission_type=strategy.commission.percent, commission_value=0.1, slippage=3)

// Inputs
outlierThreshold = input.int(10, "Outlier Threshold Length")
fastMovingAverageLength = input.int(50, "Fast MA Length")
slowMovingAverageLength = input.int(100, "Slow MA Length")
start_date = input(timestamp("2018-01-01 00:00"), title="Start Date")
end_date = input(timestamp("2069-12-31 23:59"), title="End Date")

// Define liquidity based on volume and price movement
priceMovementLiquidity = volume / math.abs(close - open)

// Calculate the boundary for liquidity to identify outliers
liquidityBoundary = ta.ema(priceMovementLiquidity, outlierThreshold) + ta.stdev(priceMovementLiquidity, outlierThreshold)

// Initialize an array to store liquidity values when they cross the boundary
var liquidityValues = array.new_float(5)

// Check if the liquidity crosses above the boundary and update the array
if ta.crossover(priceMovementLiquidity, liquidityBoundary)
    array.insert(liquidityValues, 0, close)
    if array.size(liquidityValues) > 5
        array.pop(liquidityValues)

// Calculate the Exponential Moving Averages for the close price at the last liquidity crossover
fastEMA = ta.ema(array.size(liquidityValues) > 0 ? array.get(liquidityValues, 0) : na, fastMovingAverageLength)
slowEMA = ta.ema(array.size(liquidityValues) > 0 ? array.get(liquidityValues, 0) : na, slowMovingAverageLength)

// Trading Logic
in_date_range = true
buy_signal = ta.crossover(fastEMA, slowEMA) and in_date_range
sell_signal = ta.crossunder(fastEMA, slowEMA) and in_date_range

// Strategy Entry and Exit
if (buy_signal)
    strategy.entry("Buy", strategy.long)

if (sell_signal)
    strategy.close("Buy")

// Plotting
fastPlot = plot(fastEMA, color=fastEMA > slowEMA ? color.new(#00ffbb, 50) : color.new(#ff1100, 50), title="Fast EMA")
slowPlot = plot(slowEMA, color=fastEMA > slowEMA ? color.new(#00ffbb, 50) : color.new(#ff1100, 50), title="Slow EMA")

// Create a fill between the fast and slow EMA plots with appropriate color based on crossover
fill(fastPlot, slowPlot, fastEMA > slowEMA ? color.new(#00ffbb, 50) : color.new(#ff1100, 50))