概述
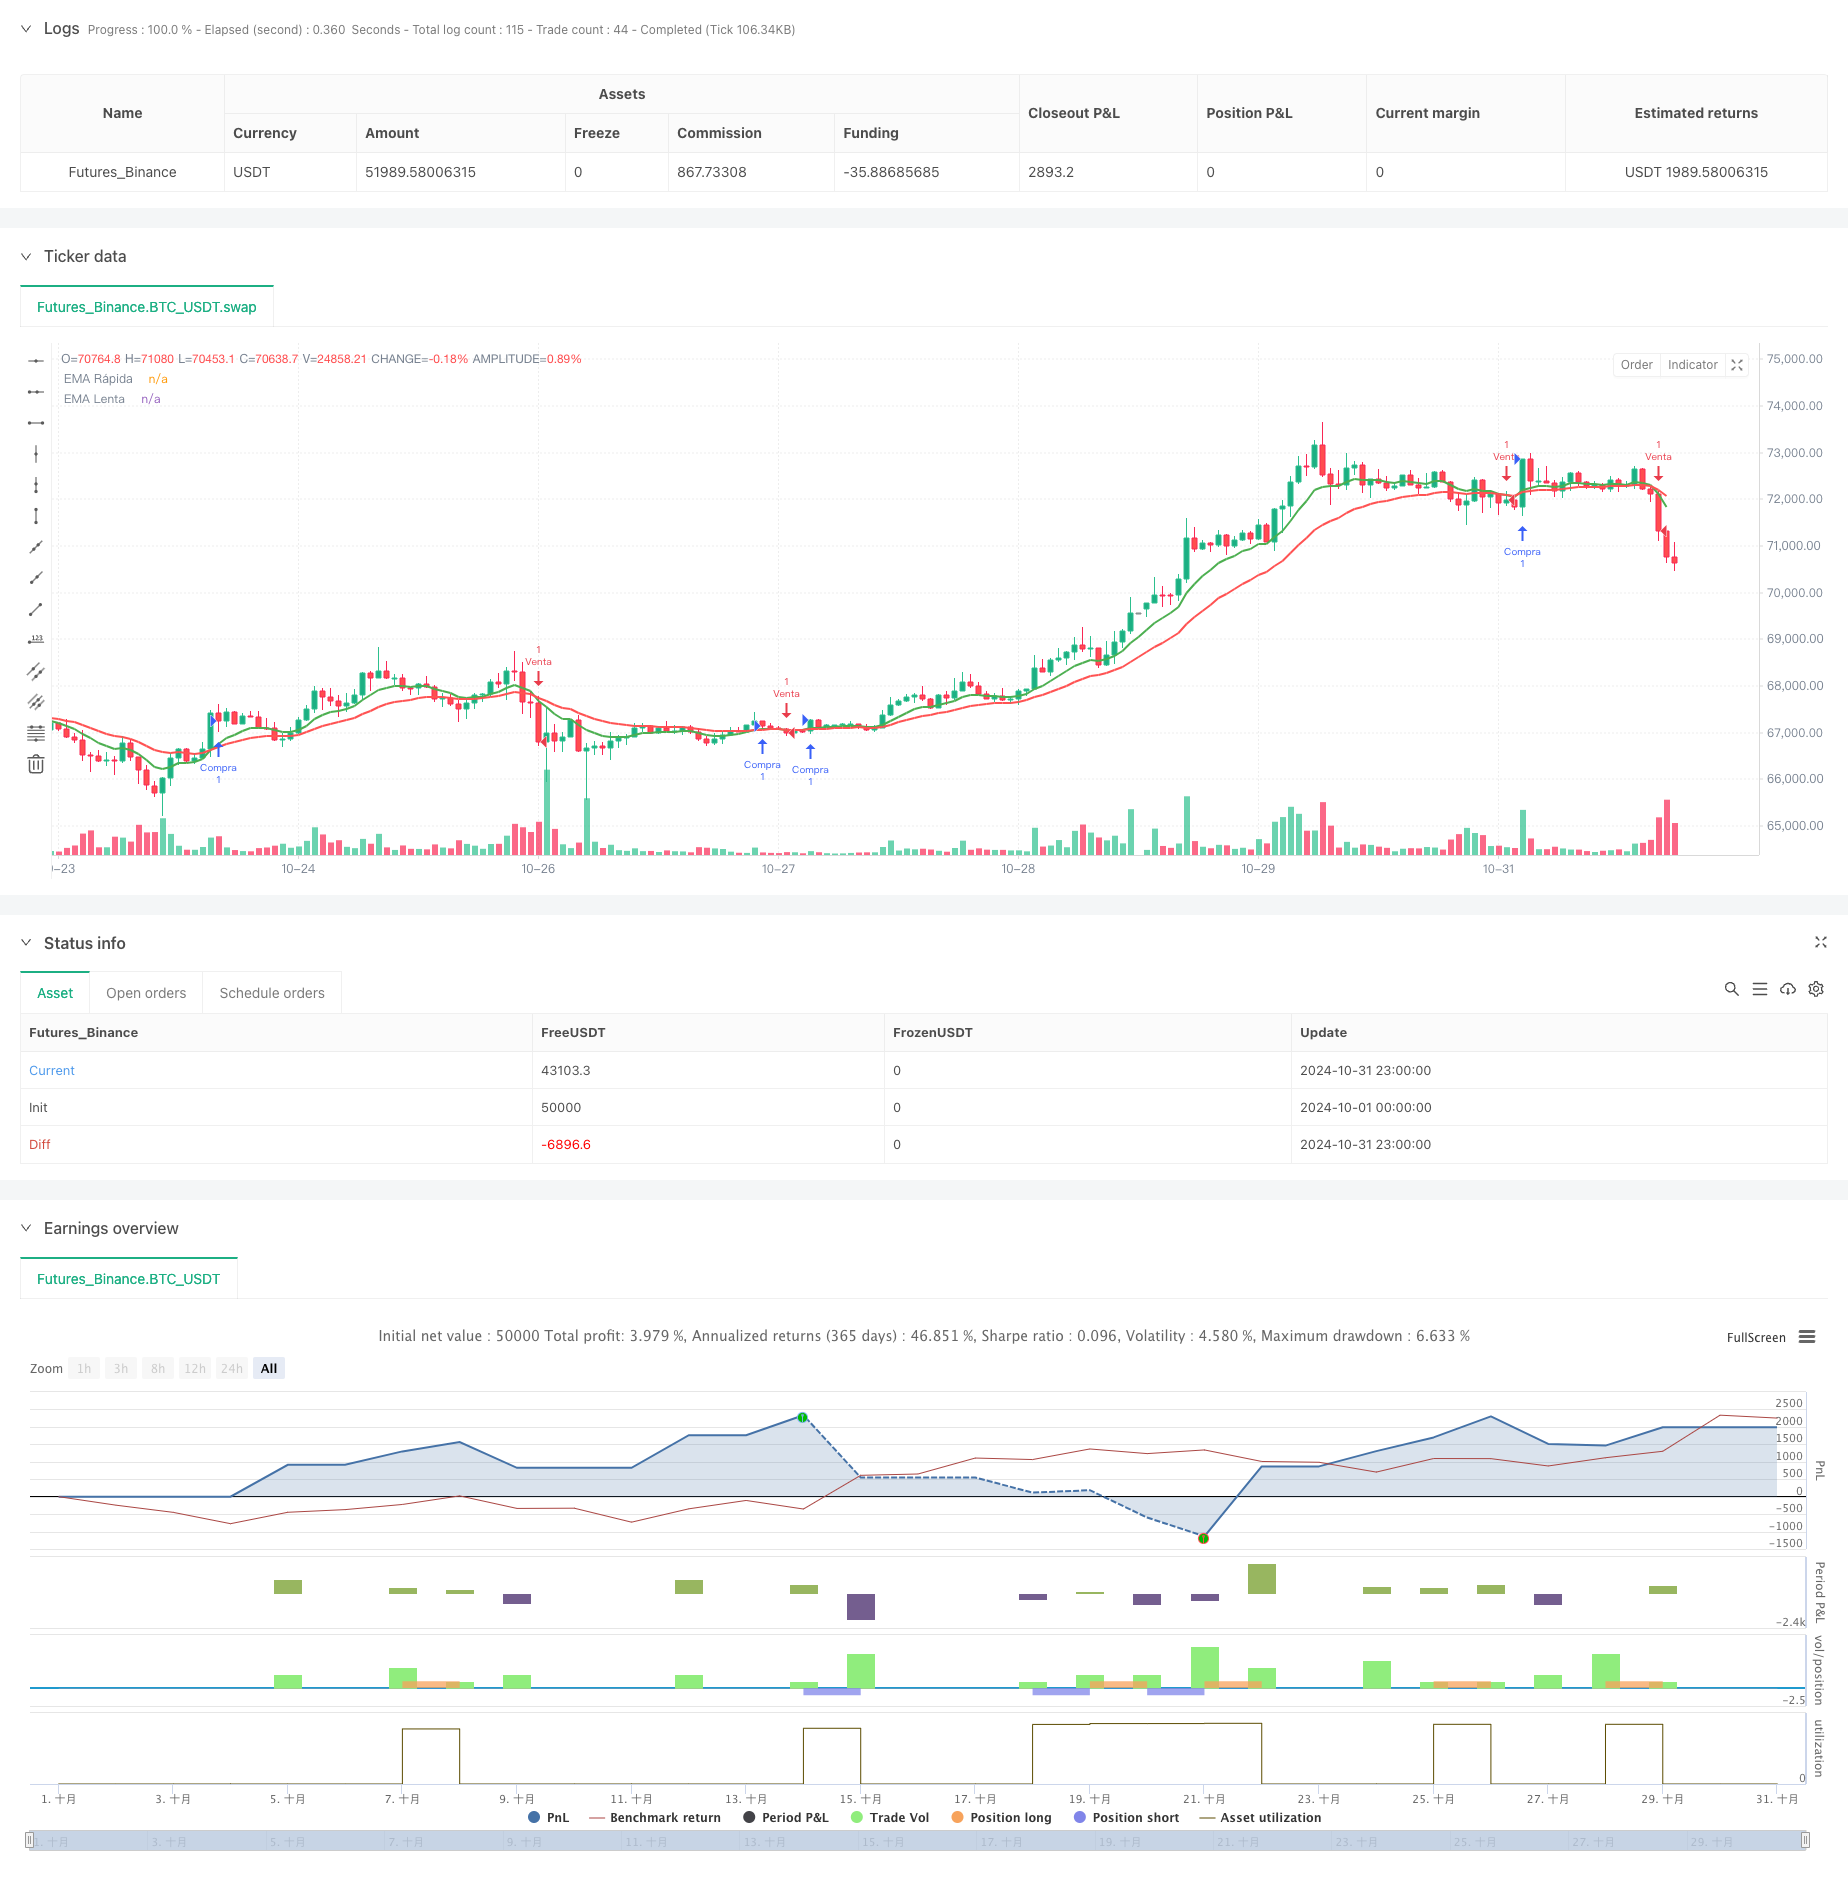
这是一个基于双均线交叉结合RSI指标的量化交易策略,同时集成了动态止盈止损机制。策略利用9周期和21周期的指数移动平均线(EMA)作为主要趋势判断指标,配合相对强弱指数(RSI)作为过滤条件,通过设定动态的止盈止损位来管理风险和收益。
策略原理
策略采用快速EMA(9周期)和慢速EMA(21周期)的交叉来捕捉趋势变化。当快线向上穿越慢线且RSI低于70时,开立多头仓位;当快线向下穿越慢线且RSI高于30时,开立空头仓位。每笔交易都设置了1.5%的止盈和1%的止损,这种动态止盈止损机制可以根据入场价格自动调整具体的止盈止损位置。
策略优势
- 趋势跟踪与震荡指标的结合提高了信号质量
- 动态止盈止损机制有效控制每笔交易的风险
- 避免在过度超买超卖区域入场
- 策略逻辑简单,易于理解和维护
- 参数配置灵活,可根据不同市场情况调整
策略风险
- 震荡市场可能产生频繁的假突破信号
- 固定比例的止盈止损可能不适合所有市场环境
- 双均线系统在趋势转折点反应较慢
- RSI过滤条件可能错过一些重要的趋势起点
- 没有考虑成交量等其他重要市场信息
策略优化方向
- 引入成交量指标验证趋势有效性
- 根据波动率动态调整止盈止损比例
- 增加趋势强度过滤器
- 优化均线周期选择,可考虑自适应周期
- 加入市场环境判断模块,在不同市场条件下使用不同参数
- 考虑引入定期止盈止损位置调整机制
总结
这是一个结构清晰、逻辑严谨的量化交易策略。通过均线交叉捕捉趋势,RSI过滤入场时机,动态止盈止损管理风险。虽然存在一定局限性,但通过建议的优化方向可以进一步提升策略的稳定性和盈利能力。策略适合作为基础框架,根据具体交易品种和市场情况进行针对性优化。
策略源码
/*backtest
start: 2024-10-01 00:00:00
end: 2024-10-31 23:59:59
period: 1h
basePeriod: 1h
exchanges: [{"eid":"Futures_Binance","currency":"BTC_USDT"}]
*/

//@version=5
strategy("Estrategia BTC/USDT - Ajustada", overlay=true)

// Definición de las EMAs
emaRapida = ta.ema(close, 9)
emaLenta = ta.ema(close, 21)

// Cálculo del RSI
rsi = ta.rsi(close, 14)

// Condiciones de compra y venta
longCondition = ta.crossover(emaRapida, emaLenta) and rsi < 70
shortCondition = ta.crossunder(emaRapida, emaLenta) and rsi > 30

// Ajustes de Take Profit y Stop Loss
takeProfitLong = close * 1.015 // Take Profit del 1.5% para Long
stopLossLong = close * 0.99 // Stop Loss del 1% para Long

takeProfitShort = close * 0.985 // Take Profit del 1.5% para Short
stopLossShort = close * 1.01 // Stop Loss del 1% para Short

// Ejecución de la estrategia
if (longCondition)
    strategy.entry("Compra", strategy.long)
    strategy.exit("Take Profit Long", "Compra", limit=takeProfitLong, stop=stopLossLong)

if (shortCondition)
    strategy.entry("Venta", strategy.short)
    strategy.exit("Take Profit Short", "Venta", limit=takeProfitShort, stop=stopLossShort)

// Visualización de las EMAs
plot(emaRapida, color=color.green, linewidth=2, title="EMA Rápida")
plot(emaLenta, color=color.red, linewidth=2, title="EMA Lenta")
相关推荐
- Low finder
- 双均线RSI趋势反转交易策略 - 基于EMA和RSI的动量突破系统
- EMA多头均线交叉策略
- 多周期RSI动量与三重EMA趋势跟踪复合策略
- 动态均线趋势跟踪与相对强弱指标确认交易策略
- 双均线RSI趋势发散策略:基于指数移动平均和相对强弱的趋势捕捉系统
- RSI与EMA结合的动态多周期量化交易策略
- crypto futures hourly scalping with ma & rsi - ogcheckers
- 均线交叉、相对强弱指标、成交量价格趋势、吞没形态策略
- 双指数移动平均线与相对强弱指数交叉策略
更多内容
- 基于玻林格带与蜡烛图形态的高级趋势交易策略
- 基于ATR波动率和均线的自适应趋势跟踪退出策略
- 双均线动量趋势交易策略结合满实体烛线信号系统
- 双时间周期超级趋势与RSI策略优化系统
- 双均线交叉趋势追踪策略结合动态止盈止损系统
- 多重时间框架趋势跟踪交易系统(MTF-ATR-MACD)
- 双时间周期超趋势RSI智能交易策略
- 双重MACD价格行为突破追踪策略
- 多重均线趋势动量识别与止损交易系统
- 双均线成交量趋势确认量化交易策略
- 增强型多周期动态自适应趋势跟踪交易系统
- 大幅波动突破型双向交易策略:基于点位阈值的多空进场系统
- 强化波林格均值回归量化策略
- 动态达瓦斯箱体突破与均线趋势确认交易系统
- EMA双均线交叉动态止盈止损量化交易策略
- 多重EMA交叉趋势跟踪与动态止盈止损优化策略
- 双均线交叉自适应动态止盈止损策略
- 双平台对冲平衡策略
- 双均线交叉动态止盈止损量化策略
- 多重均线趋势强度捕捉与波动获利策略