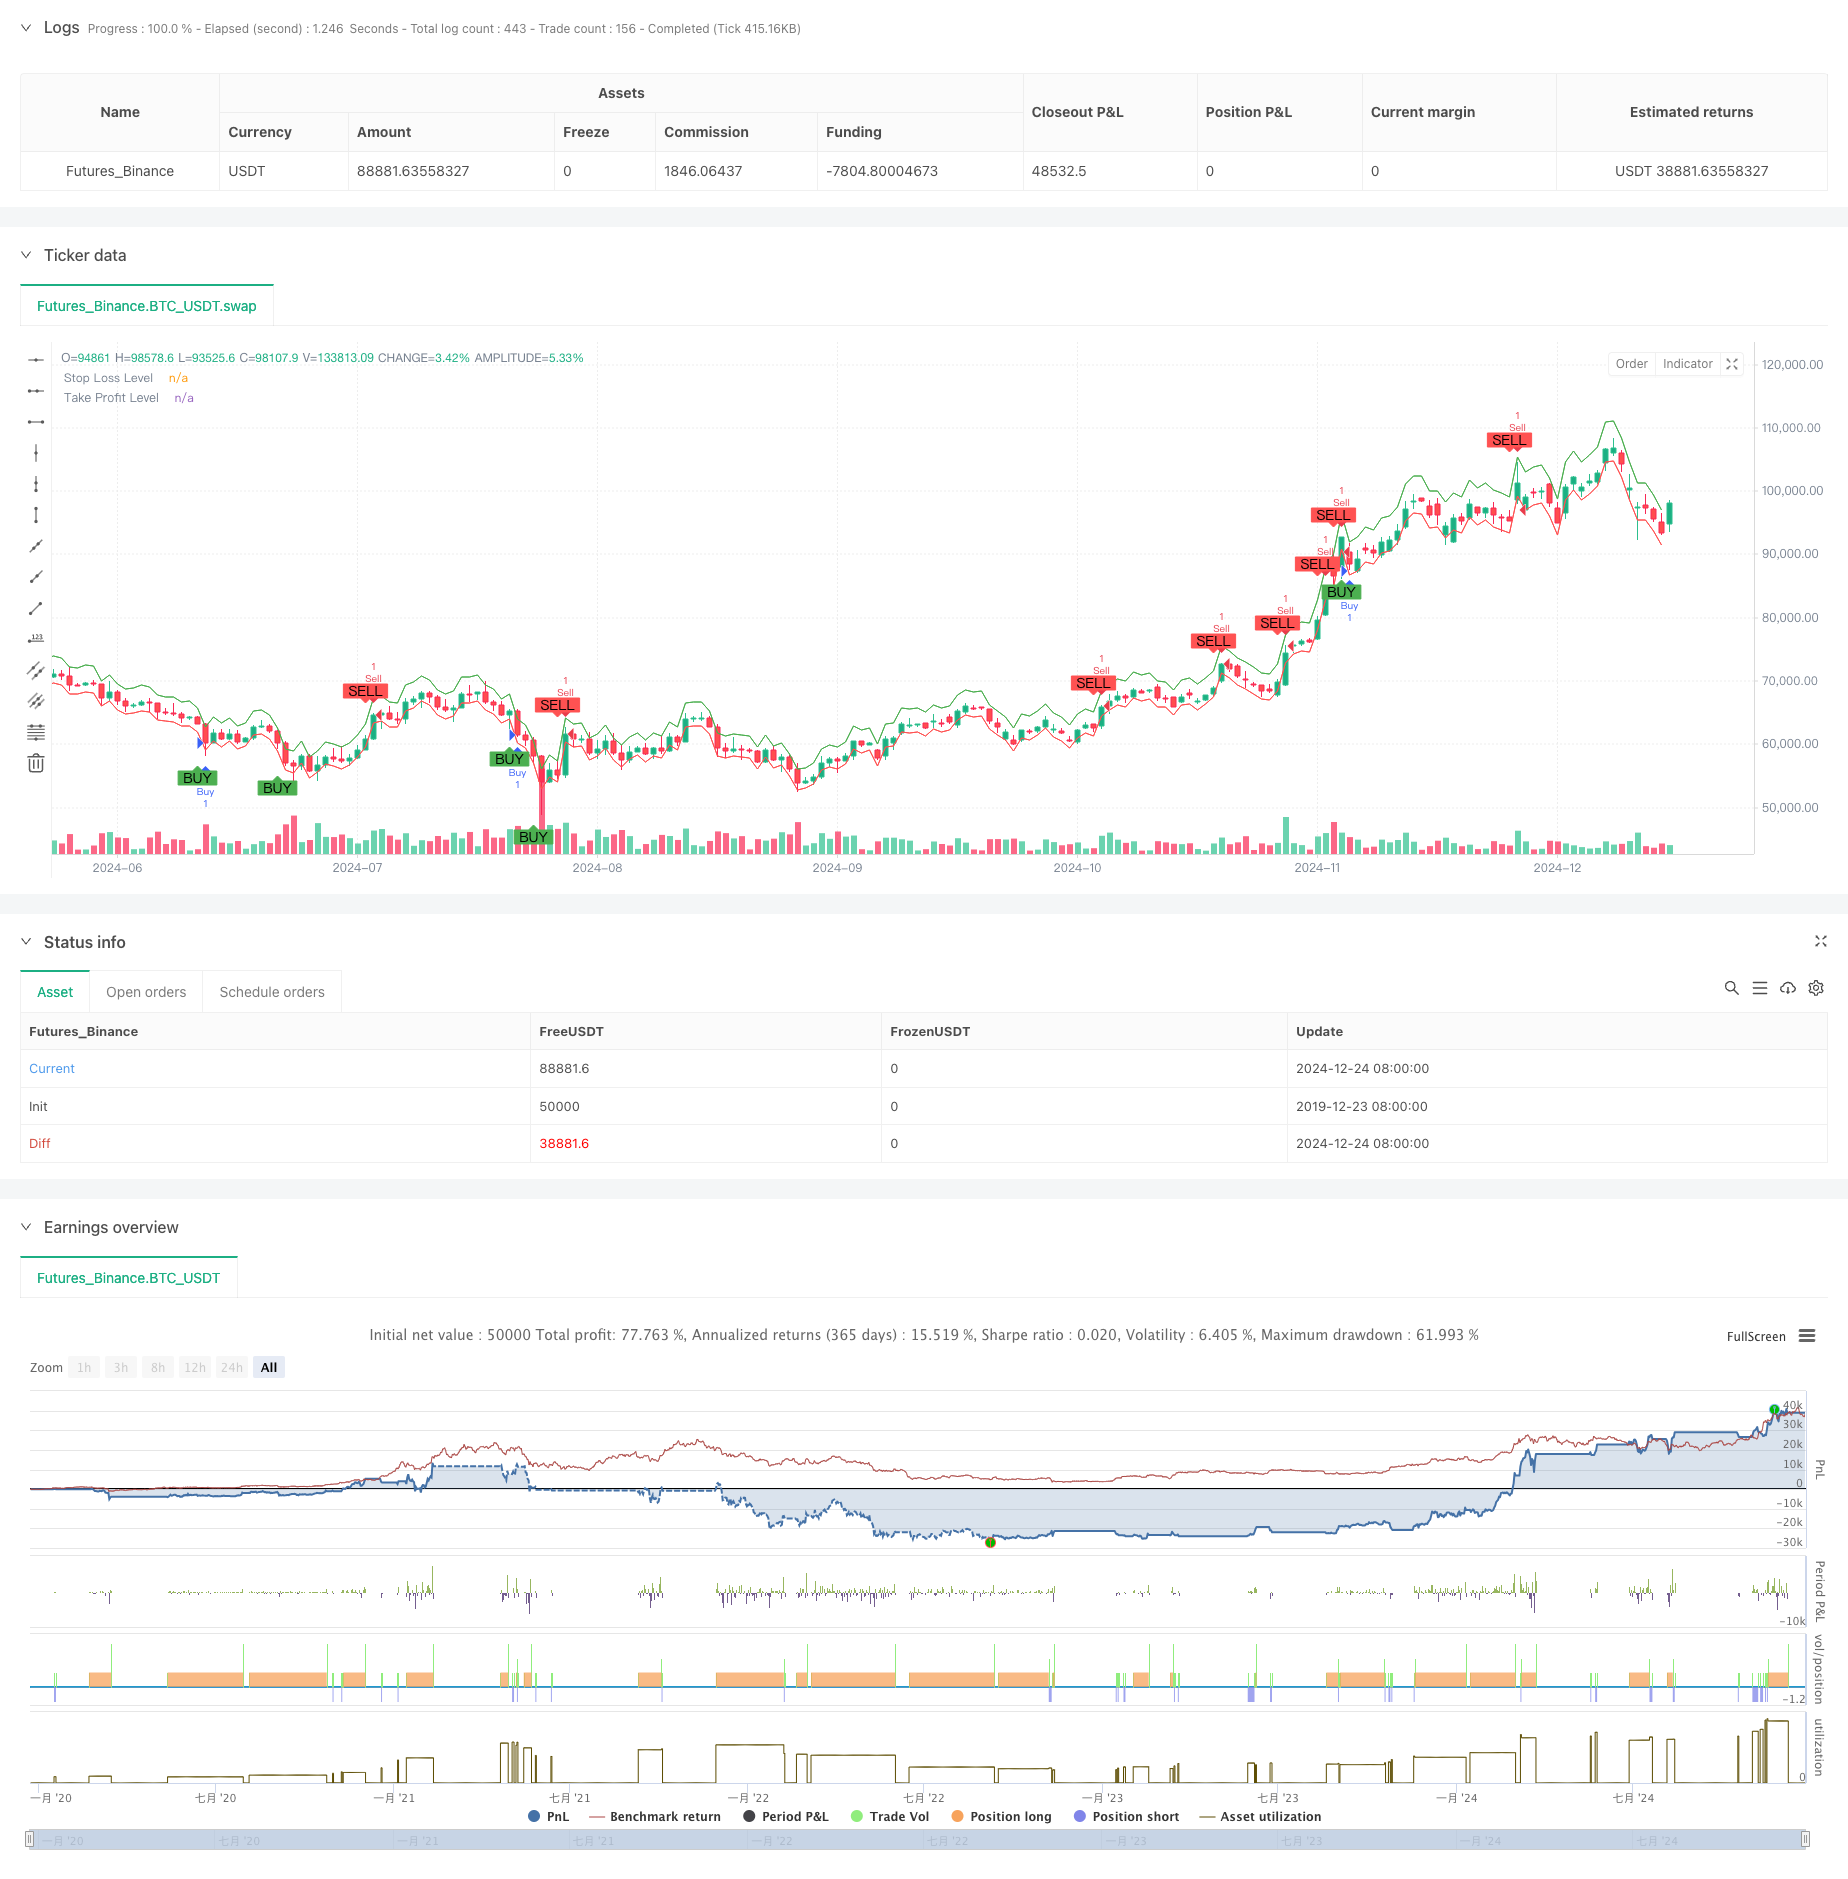
Aperçu
La stratégie est un système de trading auto-adaptatif basé sur l’indice Shiryaev-Zhou (SZI). Il identifie les états de survente et de survente du marché en calculant des scores normalisés de rendement logarithmique, afin de capturer les opportunités de retour au cours moyen. La stratégie combine des objectifs de stop-loss et de profit dynamiques pour un contrôle précis du risque.
Principe de stratégie
Le cœur de la stratégie est de construire des indicateurs normalisés à partir de caractéristiques statistiques de roulement du taux de rendement symétrique. Les étapes sont les suivantes:
- Calculer le rendement pair afin d’obtenir un traitement normalisé du rendement
- Calcul de la moyenne et de l’écart type à 50 cycles
- Construction de l’indicateur SZI: (Return de l’arithmétique - moyenne mobile) / écart de la norme mobile
- Le SZI produit un signal de co-option quand il est inférieur à -2,0 et un signal de co-option quand il est supérieur à 2.0
- 2 pour cent de stop loss et 4 pour cent de stop loss basé sur le prix d’entrée
Avantages stratégiques
- Une base théorique solide: basée sur l’hypothèse de la distribution orthogonale symétrique, avec un bon soutien statistique
- Adaptabilité: capacité à s’adapter aux changements de caractéristiques de la fluctuation du marché grâce à des calculs de fenêtre roulante
- Contrôle des risques: une stratégie de stop loss pour un contrôle précis des risques de chaque transaction
- Amitié visuelle: marque clairement sur le graphique les signaux de négociation et le niveau de contrôle des risques
Risque stratégique
- Sensitivité des paramètres: la longueur de la fenêtre de défilement et le choix des valeurs de seuil ont un impact significatif sur la performance de la stratégie
- Dépendance aux conditions du marché: les faux signaux peuvent être fréquents dans les marchés en tendance
- Effets des points de glissement: pendant les périodes de forte volatilité, les prix de transaction réels peuvent être considérablement éloignés des niveaux idéaux
- Délai de calcul: le calcul des statistiques en temps réel peut entraîner un certain retard de signal
Orientation de l’optimisation de la stratégie
- Tige dynamique: il est possible d’envisager d’ajuster la valeur du signal dynamiquement en fonction de la volatilité du marché
- Périodes de temps multiples: un mécanisme de confirmation de signal introduit plusieurs périodes de temps
- Filtrage de la volatilité: suspendre les transactions ou ajuster les positions pendant les périodes de volatilité extrême
- Confirmation du signal: augmentation de la quantité de trafic, de la puissance et autres indicateurs auxiliaires pour confirmer le signal
- Gestion des positions: une gestion dynamique des positions basée sur la volatilité
Résumer
Il s’agit d’une stratégie de négociation quantitative basée sur des statistiques solides qui capte les opportunités de fluctuation des prix par la normalisation des gains symétriques. Les principaux avantages de la stratégie résident dans sa capacité d’adaptation et sa bonne maîtrise des risques, mais il reste encore de la place pour l’optimisation en termes de sélection des paramètres et d’adaptation au contexte du marché. La stabilité et la fiabilité de la stratégie devraient être encore améliorées par l’introduction d’un mécanisme de confirmation de signaux dynamiques et multidimensionnels.
/*backtest
start: 2019-12-23 08:00:00
end: 2024-12-25 08:00:00
period: 1d
basePeriod: 1d
exchanges: [{"eid":"Futures_Binance","currency":"BTC_USDT"}]
*/

//@version=5
strategy("Jalambi Paul model", overlay=true)

// Define the length for the rolling window
window = input.int(50, title="Window Length", minval=1)
threshold = 2.0 // Fixed threshold value
risk_percentage = input.float(1.0, title="Risk Percentage per Trade", step=0.1) / 100

// Calculate the logarithmic returns
log_return = math.log(close / close[1])

// Calculate the rolling mean and standard deviation
rolling_mean = ta.sma(log_return, window)
rolling_std = ta.stdev(log_return, window)

// Calculate the Shiryaev-Zhou Index (SZI)
SZI = (log_return - rolling_mean) / rolling_std

// Generate signals based on the fixed threshold
long_signal = SZI < -threshold
short_signal = SZI > threshold

// Plot the signals on the main chart (overlay on price)
plotshape(series=long_signal, location=location.belowbar, color=color.green, style=shape.labelup, title="Buy Signal", text="BUY", offset=-1)
plotshape(series=short_signal, location=location.abovebar, color=color.red, style=shape.labeldown, title="Sell Signal", text="SELL", offset=-1)

// Strategy logic: Buy when SZI crosses below the negative threshold, Sell when it crosses above the positive threshold
if (long_signal)
    strategy.entry("Buy", strategy.long, comment="Long Entry")

if (short_signal)
    strategy.entry("Sell", strategy.short, comment="Short Entry")

// Calculate the stop loss and take profit levels based on the percentage of risk
stop_loss_pct = input.float(2.0, title="Stop Loss (%)") / 100
take_profit_pct = input.float(4.0, title="Take Profit (%)") / 100

// Set the stop loss and take profit levels based on the entry price
strategy.exit("Take Profit / Stop Loss", "Buy", stop=close * (1 - stop_loss_pct), limit=close * (1 + take_profit_pct))
strategy.exit("Take Profit / Stop Loss", "Sell", stop=close * (1 + stop_loss_pct), limit=close * (1 - take_profit_pct))

// Plot the stop loss and take profit levels for visualization (optional)
plot(stop_loss_pct != 0 ? close * (1 - stop_loss_pct) : na, color=color.red, linewidth=1, title="Stop Loss Level")
plot(take_profit_pct != 0 ? close * (1 + take_profit_pct) : na, color=color.green, linewidth=1, title="Take Profit Level")