Strategi Kuantitatif Crossover Trend Momentum Multi-Indikator
Penulis:ChaoZhang, Tanggal: 2024-12-11 15:00:51Tag:EMARSIATRSMA

Gambaran umum
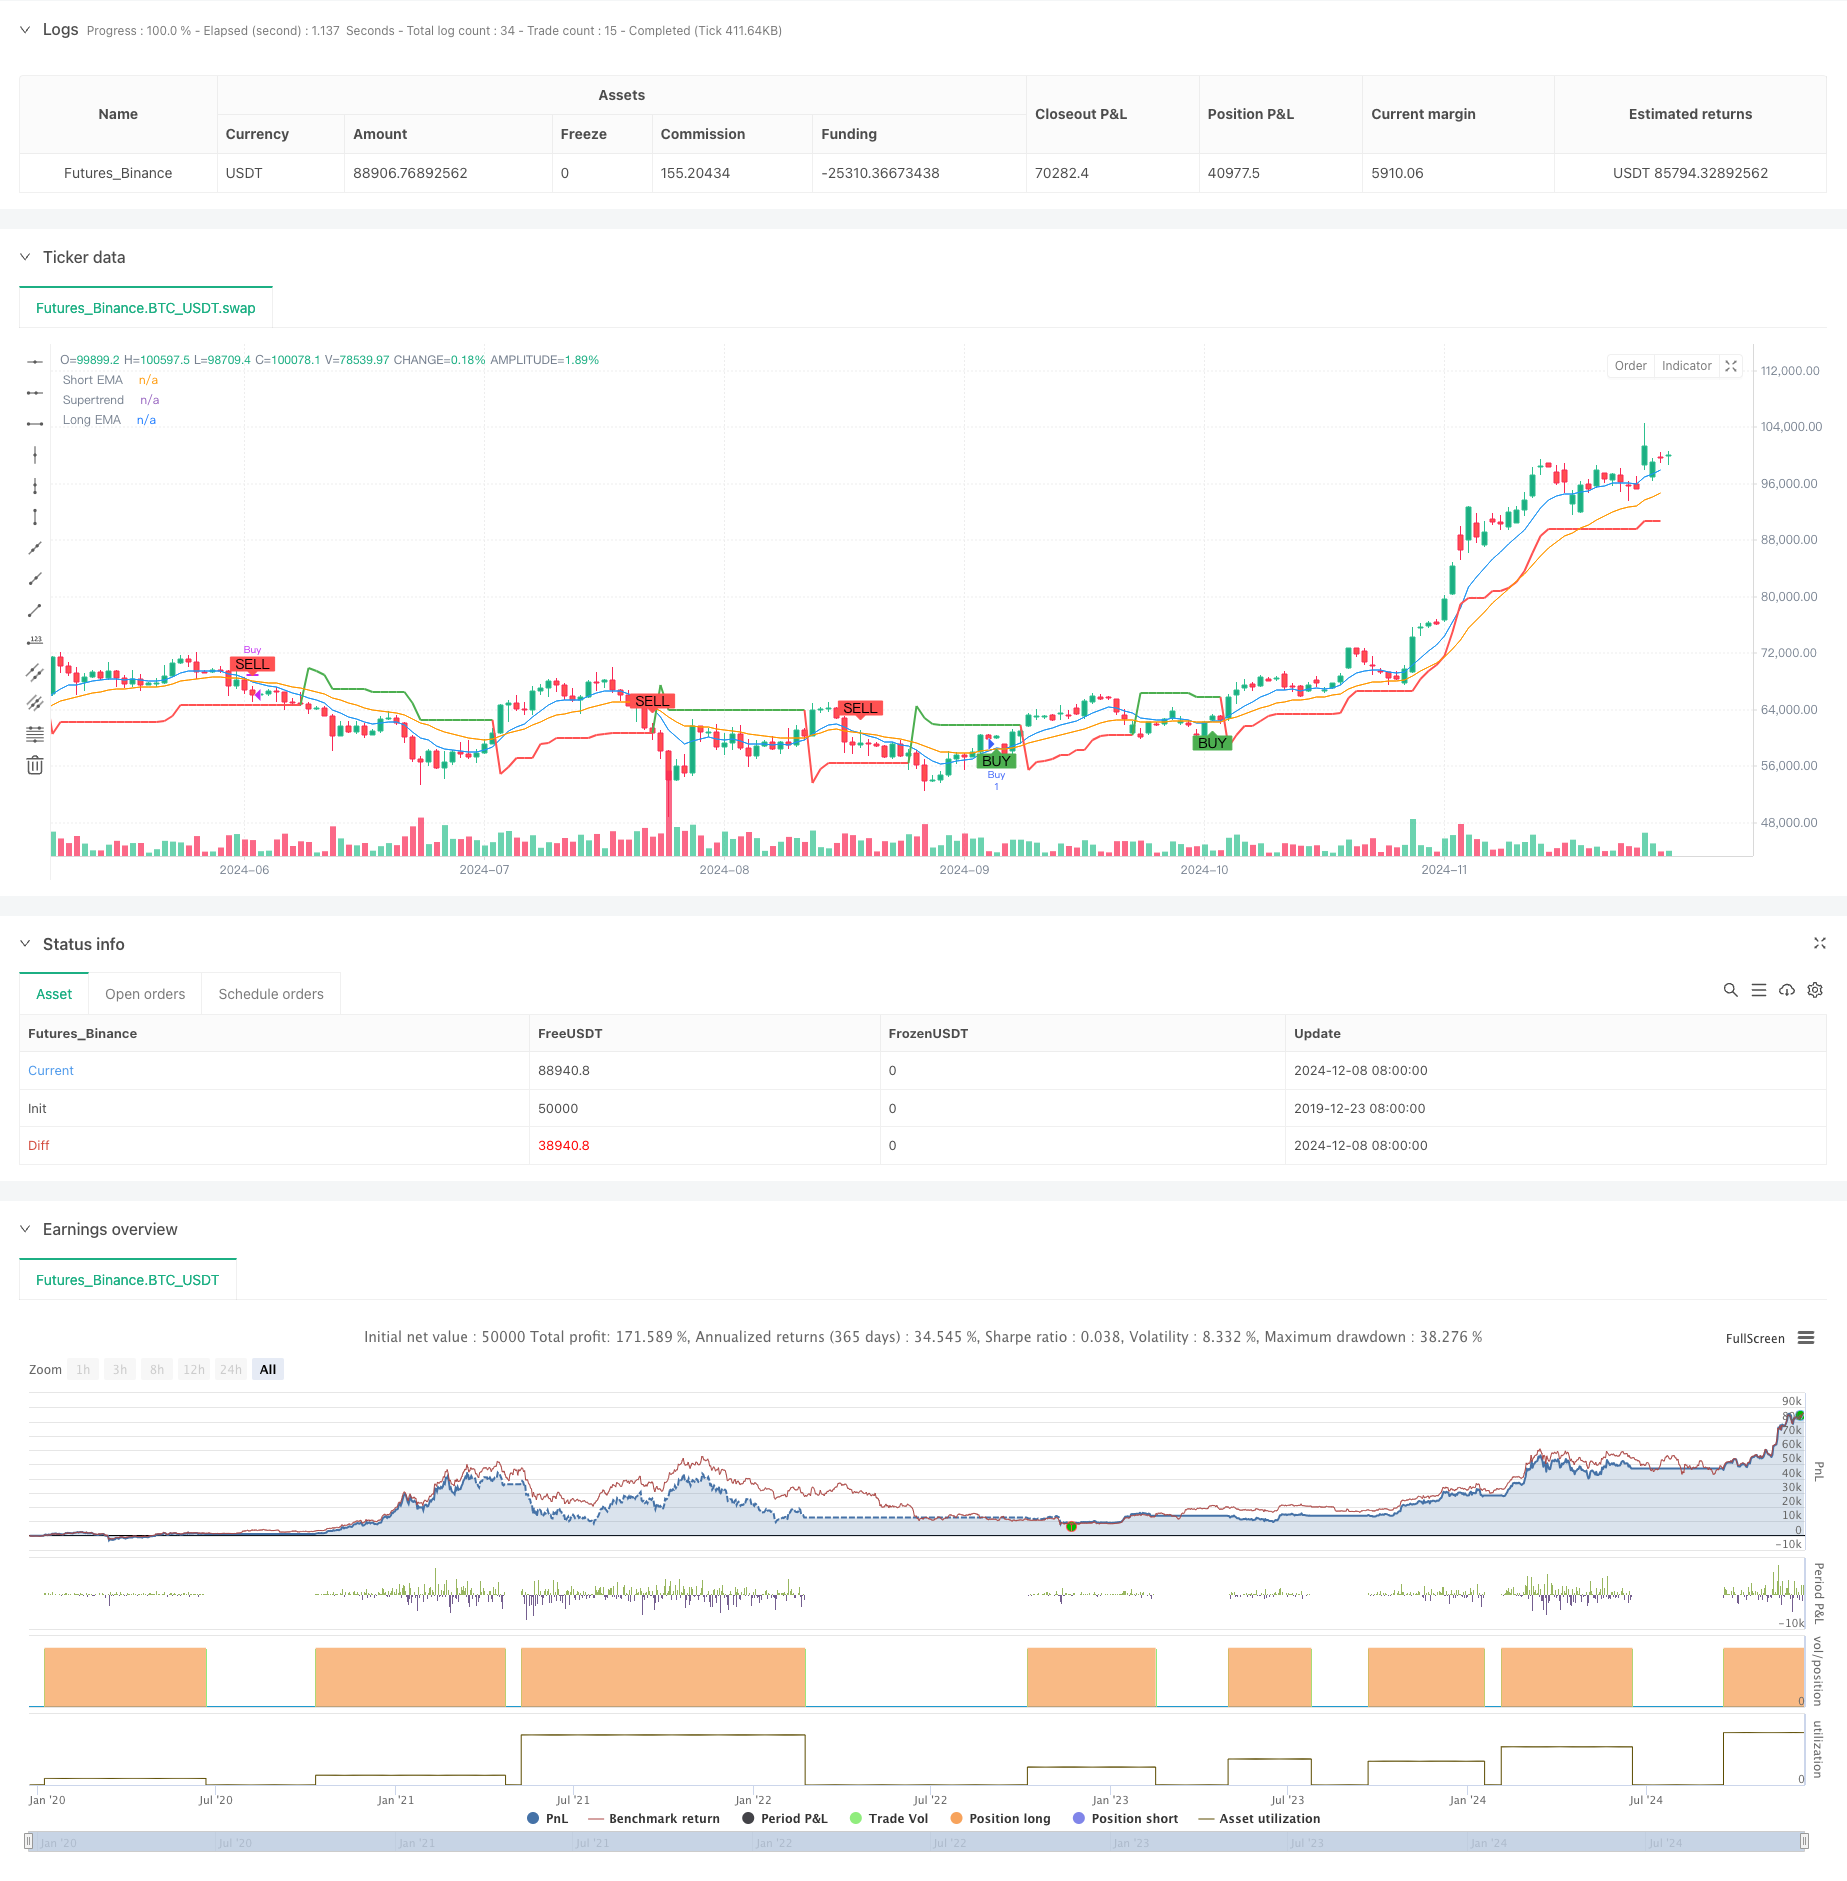
Ini adalah strategi perdagangan multi-indikator yang menggabungkan Supertrend, Exponential Moving Average (EMA), dan Relative Strength Index (RSI). Strategi ini mengidentifikasi tren pasar, momentum, dan titik pembalikan potensial melalui sinyal silang dan tingkat overbought / oversold dari ketiga indikator teknis ini, mencari peluang perdagangan optimal di pasar. Strategi ini memanfaatkan keuntungan dari beberapa indikator untuk meningkatkan akurasi dan keandalan perdagangan melalui analisis pasar dari berbagai dimensi.
Prinsip Strategi
Logika inti didasarkan pada analisis gabungan dari tiga indikator teknis utama: Indikator Supertrend menentukan arah tren secara keseluruhan menggunakan volatilitas ATR untuk penyesuaian garis tren dinamis. Crossover EMA jangka pendek (9 periode) dan jangka panjang (21-periode) menangkap perubahan momentum harga. 3. Indikator RSI mengidentifikasi kondisi pasar yang terlalu banyak dibeli atau terlalu banyak dijual.
Sinyal beli membutuhkan semua kondisi berikut: - Supertrend menunjukkan tren bullish (harga di atas garis Supertrend) - EMA jangka pendek melintasi EMA jangka panjang - RSI tidak overbought (di bawah 70)
Sinyal jual membutuhkan semua kondisi berikut: - Supertrend menunjukkan tren penurunan (harga di bawah garis Supertrend) - EMA jangka pendek melintasi EMA jangka panjang - RSI tidak oversold (di atas 30)
Keuntungan Strategi
- Validasi silang multi-indikator meningkatkan keandalan sinyal
- Menggabungkan manfaat dari mengikuti tren dan analisis momentum
- RSI menyaring sinyal palsu potensial
- Parameter strategi dapat disesuaikan secara fleksibel untuk kondisi pasar yang berbeda
- Aturan masuk dan keluar yang jelas mengurangi pengaruh penilaian subjektif
- Menggabungkan mekanisme pengendalian risiko yang kuat
Risiko Strategi
- Dapat menghasilkan sinyal palsu yang sering di berbagai pasar
- Beberapa indikator
keterlambatan dapat menunda waktu masuk dan keluar - Pemilihan parameter yang tidak tepat dapat mempengaruhi kinerja strategi
- Perubahan pasar yang tiba-tiba dapat menyebabkan penarikan yang signifikan
- Biaya perdagangan harus dipertimbangkan untuk profitabilitas strategi
Arah Optimasi Strategi
- Memperkenalkan mekanisme parameter adaptif untuk menyesuaikan parameter indikator secara dinamis berdasarkan volatilitas pasar
- Menambahkan indikator analisis volume-harga untuk meningkatkan keandalan sinyal
- Mengembangkan modul pengenalan lingkungan pasar untuk menggunakan kombinasi parameter yang berbeda dalam kondisi pasar yang berbeda
- Menerapkan mekanisme stop-loss dan take-profit untuk mengoptimalkan manajemen uang
- Pertimbangkan untuk menambahkan filter volatilitas untuk menghindari overtrading di lingkungan volatilitas rendah
Ringkasan
Ini adalah strategi perdagangan kuantitatif multi-indikator yang terstruktur dengan baik dan logis yang membangun sistem perdagangan yang komprehensif dengan menggabungkan indikator trend, analisis momentum, dan indikator overbought/oversold. Kekuatan strategi ini terletak pada validasi silang multi-indikator untuk meningkatkan keandalan sinyal dan mekanisme kontrol risiko yang jelas.
/*backtest
start: 2019-12-23 08:00:00
end: 2024-12-09 08:00:00
period: 1d
basePeriod: 1d
exchanges: [{"eid":"Futures_Binance","currency":"BTC_USDT"}]
*/

// This Pine Script™ code is subject to the terms of the Mozilla Public License 2.0 at https://mozilla.org/MPL/2.0/
// © satyakipaul3744

//@version=6
//@version=6
strategy("Supertrend + EMA Crossover + RSI Strategy", overlay=true)

// --- Input Parameters ---
supertrend_length = input.int(10, title="Supertrend Length", minval=1)
supertrend_multiplier = input.float(3.0, title="Supertrend Multiplier", step=0.1)
short_ema_length = input.int(9, title="Short EMA Length")
long_ema_length = input.int(21, title="Long EMA Length")
rsi_length = input.int(14, title="RSI Length")
rsi_overbought = input.int(70, title="RSI Overbought Level")
rsi_oversold = input.int(30, title="RSI Oversold Level")

// --- Indicator Calculations ---
// Supertrend calculation
[supertrend, direction] = ta.supertrend(supertrend_multiplier, supertrend_length)

// EMA calculations
short_ema = ta.ema(close, short_ema_length)
long_ema = ta.ema(close, long_ema_length)

// RSI calculation
rsi = ta.rsi(close, rsi_length)

// --- Buy/Sell Conditions ---
// Buy condition: Supertrend bullish, EMA crossover, RSI not overbought
buy_condition = direction > 0 and ta.crossover(short_ema, long_ema) and rsi < rsi_overbought

// Sell condition: Supertrend bearish, EMA crossunder, RSI not oversold
sell_condition = direction < 0 and ta.crossunder(short_ema, long_ema) and rsi > rsi_oversold

// --- Plot Buy/Sell signals ---
plotshape(buy_condition, title="Buy Signal", location=location.belowbar, color=color.green, style=shape.labelup, text="BUY")
plotshape(sell_condition, title="Sell Signal", location=location.abovebar, color=color.red, style=shape.labeldown, text="SELL")

// --- Strategy Orders for Backtesting ---
if buy_condition
    strategy.entry("Buy", strategy.long)

if sell_condition
    strategy.close("Buy")

// --- Plot Supertrend ---
plot(supertrend, color=direction > 0 ? color.green : color.red, linewidth=2, title="Supertrend")

// --- Plot EMAs ---
plot(short_ema, color=color.blue, title="Short EMA")
plot(long_ema, color=color.orange, title="Long EMA")

// --- Strategy Performance ---
// You can see the strategy performance in the "Strategy Tester" tab.
- Strategi Trading Volatilitas Multi-Indikator RSI-EMA-ATR
- Multi-Indicator Dynamic Adaptive Position Sizing dengan Strategi Volatilitas ATR
- Strategi perdagangan trend rata-rata bergerak multi-frame dan RSI
- Trend Indikator Multi-Teknis Mengikuti Strategi dengan RSI Momentum Filter
- Golden Momentum Capture Strategy: Sistem Crossover Rata-rata Bergerak Eksponensial Multi-Timeframe
- Strategi Penjualan Pendek Jangka Pendek untuk Pasangan Mata Uang Liquiditas Tinggi
- Tren Multi-EMA Mengikuti Strategi dengan Target ATR Dinamis
- Strategi crossover rata-rata bergerak multi-indikator frekuensi tinggi
- Multi-Periode Eksponensial Moving Average Crossover Strategy dengan Sistem Saran Trading Options
- Strategi Trading Momentum Tren Multi-EMA dengan Sistem Manajemen Risiko
- Strategi perdagangan EMA-Squeeze Stop-Loss Dinamis Multi-Timeframe
- MACD dan Strategi Perdagangan Cerdas Sinyal Ganda Regresi Linear
- Tren Multi-EMA Mengikuti Strategi Perdagangan
- Tren Heikin Ashi yang Diatasi Berbagai Jangka Waktu Mengikuti Sistem Perdagangan Kuantitatif
- Osilator RSI Dinamis Indikator Kecocokan Polinomial Tren Strategi Perdagangan Kuantitatif
- Strategi Perdagangan Satu Arah Penembusan Jangkauan Harian
- SMA-RSI-MACD Multi-Indicator Dynamic Limit Order Trading Strategy
- EMA/SMA Trend Following dengan Swing Trading Strategy Combined Volume Filter and Percentage Take-Profit/Stop-Loss System
- VWAP Standar Deviasi Rata-rata Reversi Strategi Perdagangan
- Strategi Perdagangan Breakout Zona Harga Dinamis Berdasarkan Sistem Kuantitatif Dukungan dan Resistensi
- Perhentian Trailing Dinamis Lanjutan dengan Strategi Penargetan Risiko-Penghargaan
- Strategi Breakout Trendline Dinamis Lang-Only Advanced
- Strategi Stop Trailing Dynamic Multi-Level yang cerdas berdasarkan Bollinger Bands dan ATR
- Strategi Crossover EMA Dual Dinamis dengan Kontrol Keuntungan/Hilang yang Adaptif
- Bollinger Bands dan RSI Combined Dynamic Trading Strategy
- RSI-ATR Momentum Volatilitas Strategi Perdagangan Gabungan
- Dual EMA Trend-Following Strategy dengan Limit Buy Entry
- Sistem Perdagangan Analisis Teknis Multi-Strategi
- Strategi perdagangan pengakuan pola candlestick gabungan multi-frame
- Triple Bollinger Bands Mencapai Tren Mengikuti Strategi Perdagangan Kuantitatif