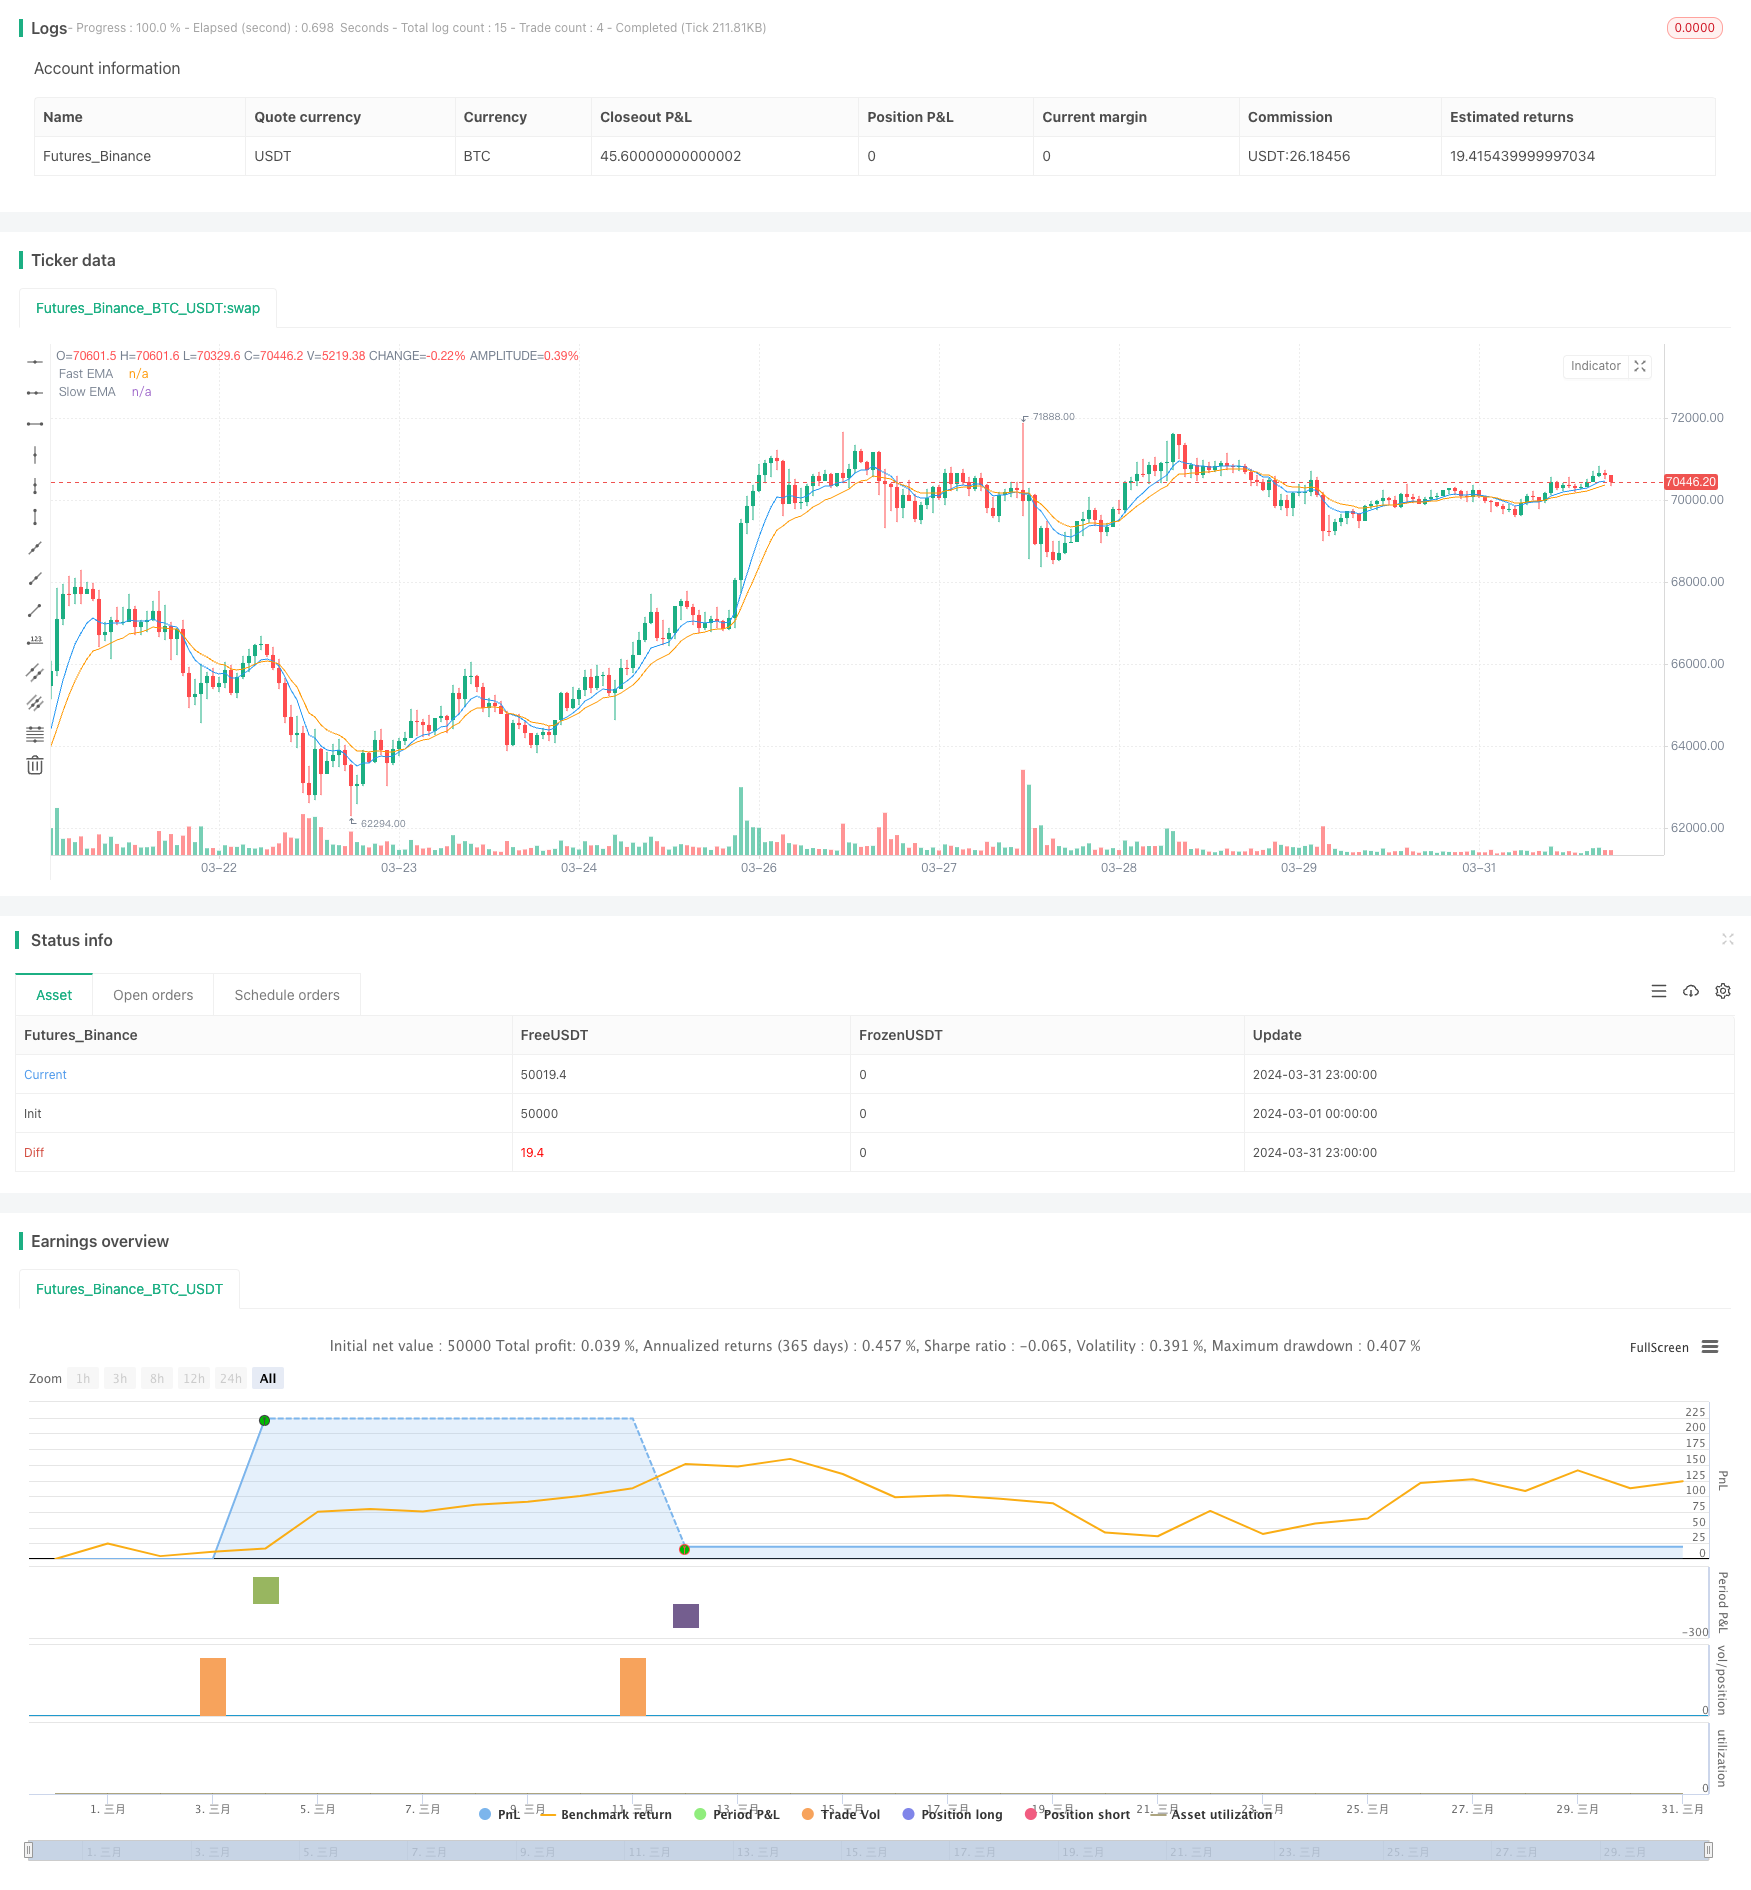
RSI/MACD/ATRとの強化されたEMAクロスオーバー戦略
作者: リン・ハーンチャオチャン開催日:2024年4月29日 17:33:05タグ:エイマRSIマックドATR

概要
この戦略は,トレードシグナルの信頼性を向上させるために,相対力指数 (RSI),移動平均収束差 (MACD),平均真差 (ATR) と組み合わせて,2つの指数指数移動平均値 (EMA) のクロスオーバーを主な取引信号として使用する.高速EMAが遅いEMAを超えると,RSIが70を下回り,MACD線が信号線を超えると,ATR値が前期と比較して10%以上上昇すると,ロング信号が生成される.逆に,高速EMAが遅いEMAを下回ると,RSIが30を超えると,MACD線が信号線を下回り,ATR値が前期と比較して10%以上上昇すると,ショート信号が生成される.また,固定ポイントストップ・ロスト戦略は,リスクと利益コントロールを短くする.
戦略原則
- 8 期間の EMA と 14 期間の EMA は,高速線と遅い線として計算する.
- 14期間のRSIとMACD指標を計算し,MACDのパラメータとして12,26,9を使用する.
- 14 期間のATR値を計算する.
- 速いEMAがスローEMAを超えると,RSIが70を下回り,MACD線がシグナル線上にあり,ATR値が前期と比較して10%以上上昇すると,ロングシグナルが生成されます.
- 急速EMAがスローEMAを下回り,RSIが30を超えると,MACD線がシグナル線を下回り,ATR値が前期と比較して10%以上上昇すると,ショートシグナルが生成されます.
- 100ポイントのストップ・ロストと 200ポイントの 利得を設定します
- ストップ・ロストと収益設定に従って,取引信号に基づいて取引を行い,脱出取引を行います.
戦略 の 利点
- 取引シグナルの信頼性を高めるために複数の技術指標を組み合わせます.
- ATRをフィルタリング条件として利用し,市場変動が増加するときにのみ取引し,低変動範囲での頻繁な取引を避ける.
- リスクを効果的にコントロールするために 固定ポイントストップ・ロスを設定し 利益を取ります
- このコードは簡潔で分かりやすいので 分かりやすく最適化できます
戦略リスク
- 横向市場やトレンド逆転の初期段階などの特定の市場条件下で,戦略はより多くの誤った信号を生む可能性があります.
- 固定ポイントストップ・ロードとテイク・プロフィートは,異なる市場の波動性状況に適応できない場合があり,時には早期ストップ・ロードまたは遅延したテイク・プロフィートにつながります.
- この戦略は市場の根本的な要素を考慮せず,技術指標に完全に依存しており,一部の場合,市場からの切り離しにつながる可能性があります.
戦略の最適化方向
- 信号の信頼性をさらに向上させるために,ボリンジャー帯,取引量など,より多くの技術指標や市場情勢指標を導入することを検討する.
- ストップ・ロスの設定を最適化し,ダイナミック・ストップ・ロスの利用や波動性に基づくストップ・ロスの利用や/または/または/または/または/または/または/または/または/または/または/または/または/または/または/または/または/または/または/または/または/または/または/または/または/または/または/または/または/または/または/または/または/または/または/または/または/または/または/または/または/または/または/または/または/または/または/または/または/または/または/または/または/または/または/または/または/または/または/または/または/または/または/または/または/または/または/または/または/または/または/または/または/または/または/または/または/または/または/または/または/または/または/または/または/または/または/または/または/または/または/または/または/または/または/または/または/または/または/または/または/または/または/または/または/または/または/または/または/または/または/
- 経済データや主要なイベントなどの基本分析を組み合わせて,取引信号をフィルタリングし,特定の特殊な状況で誤った信号を避ける.
- EMA 期間,RSI,MACD パラメータなど,パラメータを最適化して,現在の市場に最適なパラメータの組み合わせを見つけます.
概要
この戦略は,EMA,RSI,MACD,ATRなどの複数の技術指標を組み合わせることで,比較的信頼性の高い取引信号を生成し,固定ポイントストップ損失と利益を引き取りを設定することでリスクを制御する.この戦略には依然としていくつかの欠点があるが,より多くの指標を導入し,ストップ損失と利益を引き取りを最適化し,基本的な分析を組み合わせることなど,さらなる最適化によって改善することができる.全体として,この戦略は論理的には明確で,理解し実行しやすく,初心者が学び使用するのに適している.
/*backtest
start: 2024-03-01 00:00:00
end: 2024-03-31 23:59:59
period: 1h
basePeriod: 15m
exchanges: [{"eid":"Futures_Binance","currency":"BTC_USDT"}]
*/

//@version=4
strategy("Enhanced EMA Crossover Strategy", overlay=true)

// Indicators
ema_fast = ema(close, 8)
ema_slow = ema(close, 14)
rsi = rsi(close, 14)

// Correcting the MACD variable definitions
[macd_line, signal_line, _] = macd(close, 12, 26, 9)
atr_value = atr(14)

// Entry conditions with additional filters
long_condition = crossover(ema_fast, ema_slow) and rsi < 70 and (macd_line > signal_line) and atr_value > atr_value[1] * 1.1
short_condition = crossunder(ema_fast, ema_slow) and rsi > 30 and (macd_line < signal_line) and atr_value > atr_value[1] * 1.1

// Adding debug information
plotshape(series=long_condition, color=color.green, location=location.belowbar, style=shape.xcross, title="Long Signal")
plotshape(series=short_condition, color=color.red, location=location.abovebar, style=shape.xcross, title="Short Signal")

// Risk management based on a fixed number of points
stop_loss_points = 100
take_profit_points = 200

// Order execution
if (long_condition)
    strategy.entry("Long", strategy.long, comment="Long Entry")
    strategy.exit("Exit Long", "Long", stop=close - stop_loss_points, limit=close + take_profit_points)

if (short_condition)
    strategy.entry("Short", strategy.short, comment="Short Entry")
    strategy.exit("Exit Short", "Short", stop=close + stop_loss_points, limit=close - take_profit_points)

// Plotting EMAs for reference
plot(ema_fast, color=color.blue, title="Fast EMA")
plot(ema_slow, color=color.orange, title="Slow EMA")
関連性
- 多期動的ATRトレンド追跡戦略
- 多指標性高レバレッジの短期取引戦略
- ダイナミックリスク管理戦略を踏まえた多指標の動向
- 多期市場動向のクロスオーバー戦略
- MACDバレー検出器戦略
- 多指標総合的なモメンタム・トレーディング戦略
- EMA/MACD/RSIのクロスオーバー戦略
- 双 EMA トレンド モメンタム 取引戦略
- ギャウス・クロス EMA トレンド・リトレースメント戦略
- RSIモメントフィルタを搭載した戦略をフォローするマルチテクニカル指標傾向
もっと
- トリプルEMAクロスオーバー戦略
- 移動平均値とRSIの包括的な取引戦略
- 指数関数移動平均のクロスオーバーレバレッジ戦略
- 価格アクション ピラミッド 利益目標 5% ストップ損失 3%
- ターンオーバー火曜日の戦略 (週末フィルター)
- ボリンジャー・バンド ダブル標準偏差フィルタリング 5分量的な取引戦略
- ピボット・エグジットによるピボット・リバース戦略
- カレッド・タミムのアヴェレネダ・ストイコフ戦略
- GM-8 と ADX の 双重 移動 平均 戦略
- 複数のタイムフレームのビットコイン,バイナンスコイン,およびイーサリアムのプルバック・トレード戦略
- フィボナッチ金比率 リトラセシオン 購入戦略
- Zスコア 戦略をフォローする傾向
- MA99 タッチとダイナミックストップ・ロスの戦略
- ドンチアン・ブレイク・トレード・戦略
- イチモク リード スパンB 脱出戦略
- 長期入札は,EMAのリスク管理戦略と交差する
- MACD と RSI の組み合わせた長期取引戦略
- DCAの二重移動平均のトレード戦略
- VWAPの取引戦略
- 多指標組み合わせ戦略 (CCI,DMI,MACD,ADX)