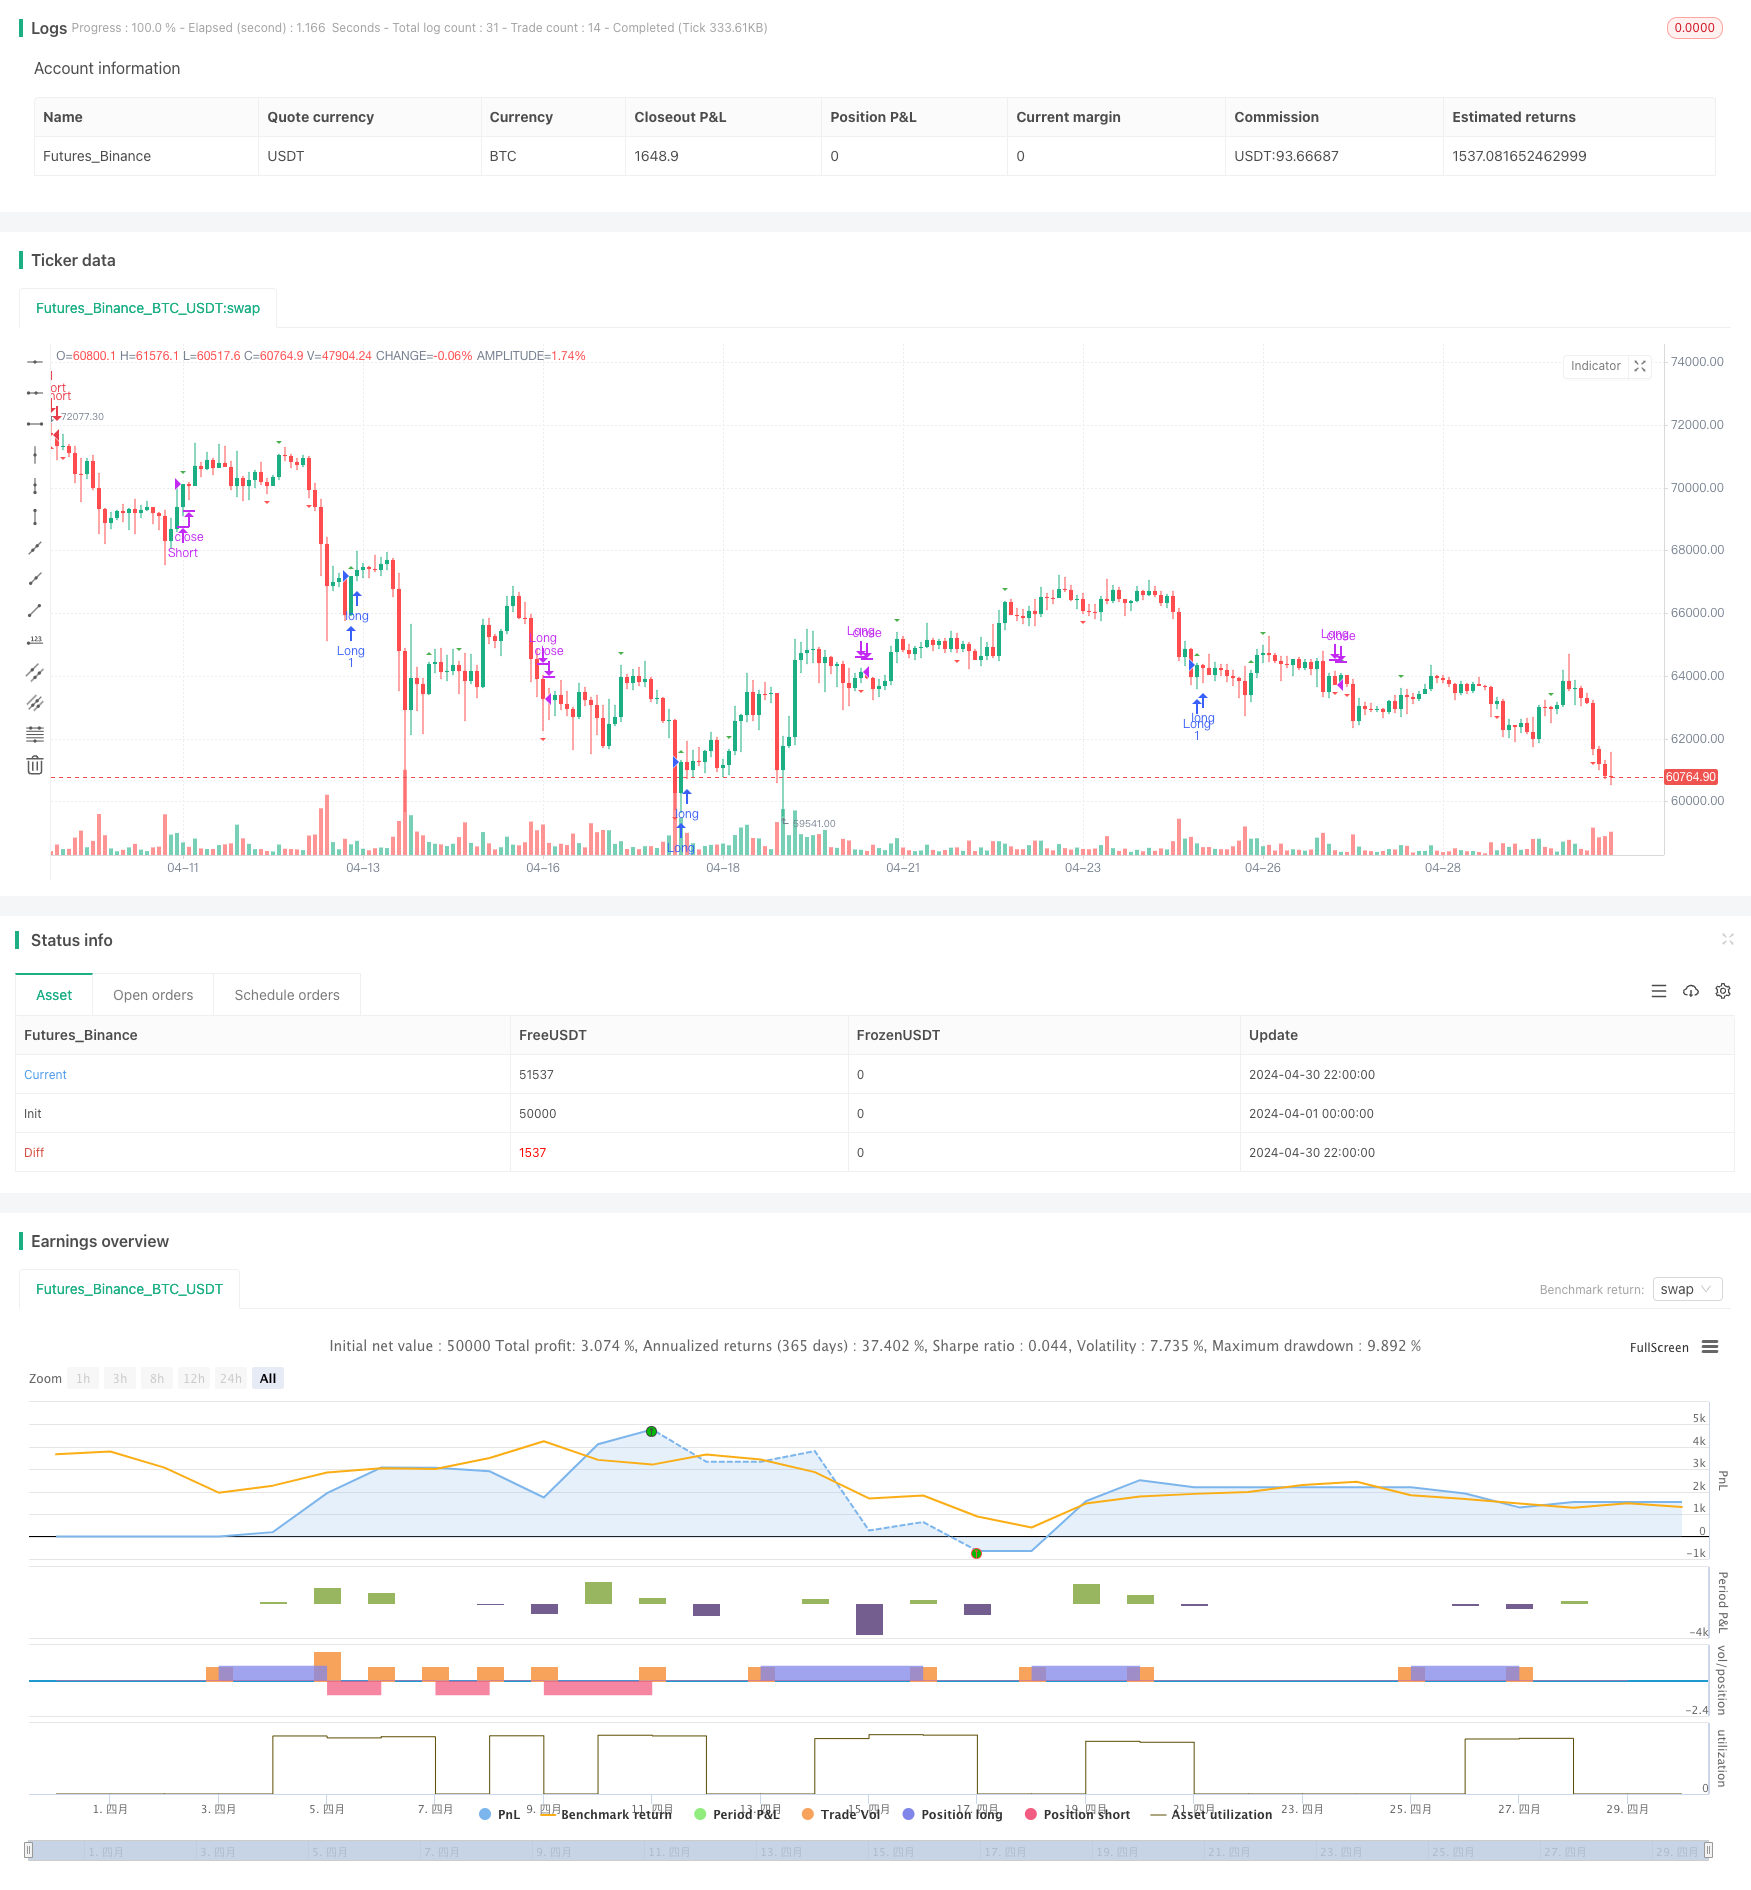
RSI と MACD の組み合わせた長期短期戦略
作者: リン・ハーンチャオチャン開催日:2024年5月17日 11:04:03タグ:RSIマックド

概要
この戦略は,相対強度指数 (RSI) と移動平均収束分差 (MACD) の2つの技術指標を組み合わせます.RSIを使用してオーバーバイトとオーバーセール条件を決定し,MACDを使用してトレンド方向を特定し,完全なロングショート戦略を形成します.RSIがオーバーバイトになったとき,セールシグナルが生成され,MACDの速いラインがスローラインを越えるとポジションが閉鎖されます.RSIがオーバーセールしたとき,買いシグナルが生成され,MACDの速いラインがスローラインを下回るとポジションが閉鎖されます.ストップ・ロスは資産の平均価格変化の半分を計算することによって設定されます.
戦略原則
- RSI指標を計算し,過剰購入と過剰販売の条件を決定します.
- RSIが70を超えて70線を下回ると,売り信号が生成されます.
- RSIが30を下回って30線を越えると,買い信号が生成されます.
- トレンド方向を特定するためのMACD指標を計算する:
- MACD の快線がスローラインを横切ると,ショートポジションを閉じる信号が生成されます.
- MACDの速い線がスローラインを下回ると,ロングポジションを閉じる信号が生成されます.
- ストップ・ロスの設定:
- 資産の平均価格変化を計算し,その半分をストップ・ロストポイントとして
RSIを使用して過買い・過売り状態を決定することで,戦略は逆転の開始時に入力される.MACDを使用してトレンド方向を特定することで,トレンドの開始時にポジションを閉鎖し,効果的にトレンドを把握する.この2つの指標は互いを補完し,完全な取引システムを形成する.
戦略 の 利点
- この戦略は,過買い/過売りとトレンドフォローのアプローチを組み合わせ,トレンドが形成されたときに逆転の始まりに突入し,タイミングで退場することを可能にし,市場の変動による損失を効果的に回避します.
- ストップ・ロスは資産の波動性の特徴に基づいて設定され,引き上げを制御し,資本効率を改善します.
- コードロジックは明確で,モジュール式プログラミングアプローチを使用し,理解し最適化するのが簡単です.
戦略リスク
- RSIとMACDパラメータの選択は戦略のパフォーマンスに大きく影響し,パラメータの最適化が異なる資産や時間枠に必要になる可能性があります.
- 予想外の出来事による急激な変化などの極端な市場状況では,戦略は大きな引き下げを伴う可能性があります.
- この戦略は,範囲限定市場ではうまく機能しない可能性があります.その結果,取引が頻繁になり,取引コストが高くなります.
戦略の最適化方向
- RSIとMACDのパラメータを最適化し,現在の資産と時間枠に最も適した組み合わせを見つけ,戦略の安定性と収益性を向上させる.
- 取引頻度を減らして信号品質を向上させるため,ボリュームと変動指標などのより多くのフィルタリング条件を追加します.
- ポジション管理モジュールを導入し,市場動向と業績に基づいてポジションを動的に調整し,引き下げを制御する.
- 他の戦略 (トレンドフォローや平均逆転など) と組み合わせて,多戦略のポートフォリオを形成し,適応性を向上させる.
概要
この戦略は,過剰購入および過剰販売条件を決定するためにRSIとトレンド方向を特定するためにMACDを使用し,完全なロングショート取引システムを形成する. 戦略の論理は明確で,利点も明らかですが,一定のリスクもあります. パラメータ最適化,フィルタリング条件を追加,ポジション管理,および他の戦略と組み合わせることで,この戦略のパフォーマンスをさらに向上させ,堅牢な取引戦略になります.
/*backtest
start: 2024-04-01 00:00:00
end: 2024-04-30 23:59:59
period: 2h
basePeriod: 15m
exchanges: [{"eid":"Futures_Binance","currency":"BTC_USDT"}]
*/

//@version=5
strategy(title="RSI & MACD Strategy", shorttitle="RSI & MACD", overlay=true)

// Définition des entrées
rsi_length = 14
rsi_overbought = 70
rsi_oversold = 30
macd_fast_length = 12
macd_slow_length = 26
macd_signal_length = 9

// Fonction pour calculer le RSI
calculate_rsi(source, length) =>
    price_change = ta.change(source)
    up = ta.rma(price_change > 0 ? price_change : 0, length)
    down = ta.rma(price_change < 0 ? -price_change : 0, length)
    rs = up / down
    rsi = 100 - (100 / (1 + rs))
    rsi

// Fonction pour calculer le MACD
calculate_macd(source, fast_length, slow_length, signal_length) =>
    fast_ma = ta.ema(source, fast_length)
    slow_ma = ta.ema(source, slow_length)
    macd = fast_ma - slow_ma
    signal = ta.ema(macd, signal_length)
    hist = macd - signal
    [macd, signal, hist]

// Calcul des indicateurs
rsi_value = calculate_rsi(close, rsi_length)
[macd_line, signal_line, _] = calculate_macd(close, macd_fast_length, macd_slow_length, macd_signal_length)

// Conditions d'entrée et de sortie
// Entrée en vente : RSI passe de >= 70 à < 70
sell_entry_condition = ta.crossunder(rsi_value, rsi_overbought)

// Sortie en vente : MACD fast MA croise au-dessus de slow MA
sell_exit_condition = ta.crossover(macd_line, signal_line)

// Entrée en achat : RSI passe de <= 30 à > 30
buy_entry_condition = ta.crossover(rsi_value, rsi_oversold)

// Sortie en achat : MACD fast MA croise en-dessous de slow MA
buy_exit_condition = ta.crossunder(macd_line, signal_line)

// Affichage des signaux sur le graphique
plotshape(series=sell_entry_condition, title="Sell Entry", location=location.belowbar, color=color.red, style=shape.triangleup, size=size.small)
plotshape(series=sell_exit_condition, title="Sell Exit", location=location.abovebar, color=color.green, style=shape.triangledown, size=size.small)
plotshape(series=buy_entry_condition, title="Buy Entry", location=location.abovebar, color=color.green, style=shape.triangleup, size=size.small)
plotshape(series=buy_exit_condition, title="Buy Exit", location=location.belowbar, color=color.red, style=shape.triangledown, size=size.small)

// Entrées et sorties de la stratégie
if (sell_entry_condition)
    strategy.entry("Short", strategy.short)

if (sell_exit_condition)
    strategy.close("Short")

if (buy_entry_condition)
    strategy.entry("Long", strategy.long)

if (buy_exit_condition)
    strategy.close("Long")
関連性
- ダルバスのボックス 脱出とリスク管理戦略
- 価格格差戦略 v1.0
- RSIとMACD統合に基づく高度な5日間のクロス分析戦略
- トレンドをフォローするクラウド・モメンタム・ディバージェンスの戦略
- 多指標のダイバージェンス・トレーディング・戦略,適応性のある取利益とストップ・ロスを用いる
- ダイナミック・トレンド・モメント・オプティマイゼーション・戦略
- ダイナミックストップ管理付きのRSI-MACDマルチシグナル取引システム
- MACD と RSI の組み合わせた長期取引戦略
- 複数の指標を備えた インテリジェントピラミッド戦略
- Bollinger Bands と RSI 統合による適応性振動トレンド取引戦略
もっと
- 逆波動性ブレイクアウト戦略
- ニフティ50 3分間のオープンレンジブレイアウト戦略
- ダイナミックストップ・ロスト&テイク・プロフィート ボリンガー・バンド戦略
- 改善されたスウィング・ハイ/ロー・ブレイクアウト戦略
- ADX フィルタリング・トレード・シグナル戦略のRSI
- 価格とボリュームブレイク購入戦略
- K 連続キャンドル ブール・ベア戦略
- 超移動平均値と上帯のクロスオーバー戦略
- RSI,ADX,そしてイチモク・クラウドに基づいた定量的な取引戦略をフォローする多要素トレンド
- イチモク雲と移動平均戦略
- ウィリアム・アリガター 移動平均トレンドキャッチャー戦略
- ダイナミックMACDとイチモク・クラウド・トレーディング・戦略
- ADXフィルターによるMA拒絶戦略
- ボリンジャー・バンド戦略: 最大利益のための精密取引
- ATR平均脱出戦略
- KNN機械学習戦略:K-近隣アルゴリズムに基づくトレンド予測取引システム
- CCI+RSI+KC トレンドフィルター 二方向取引戦略
- BMSBの脱出戦略
- SR 脱退戦略