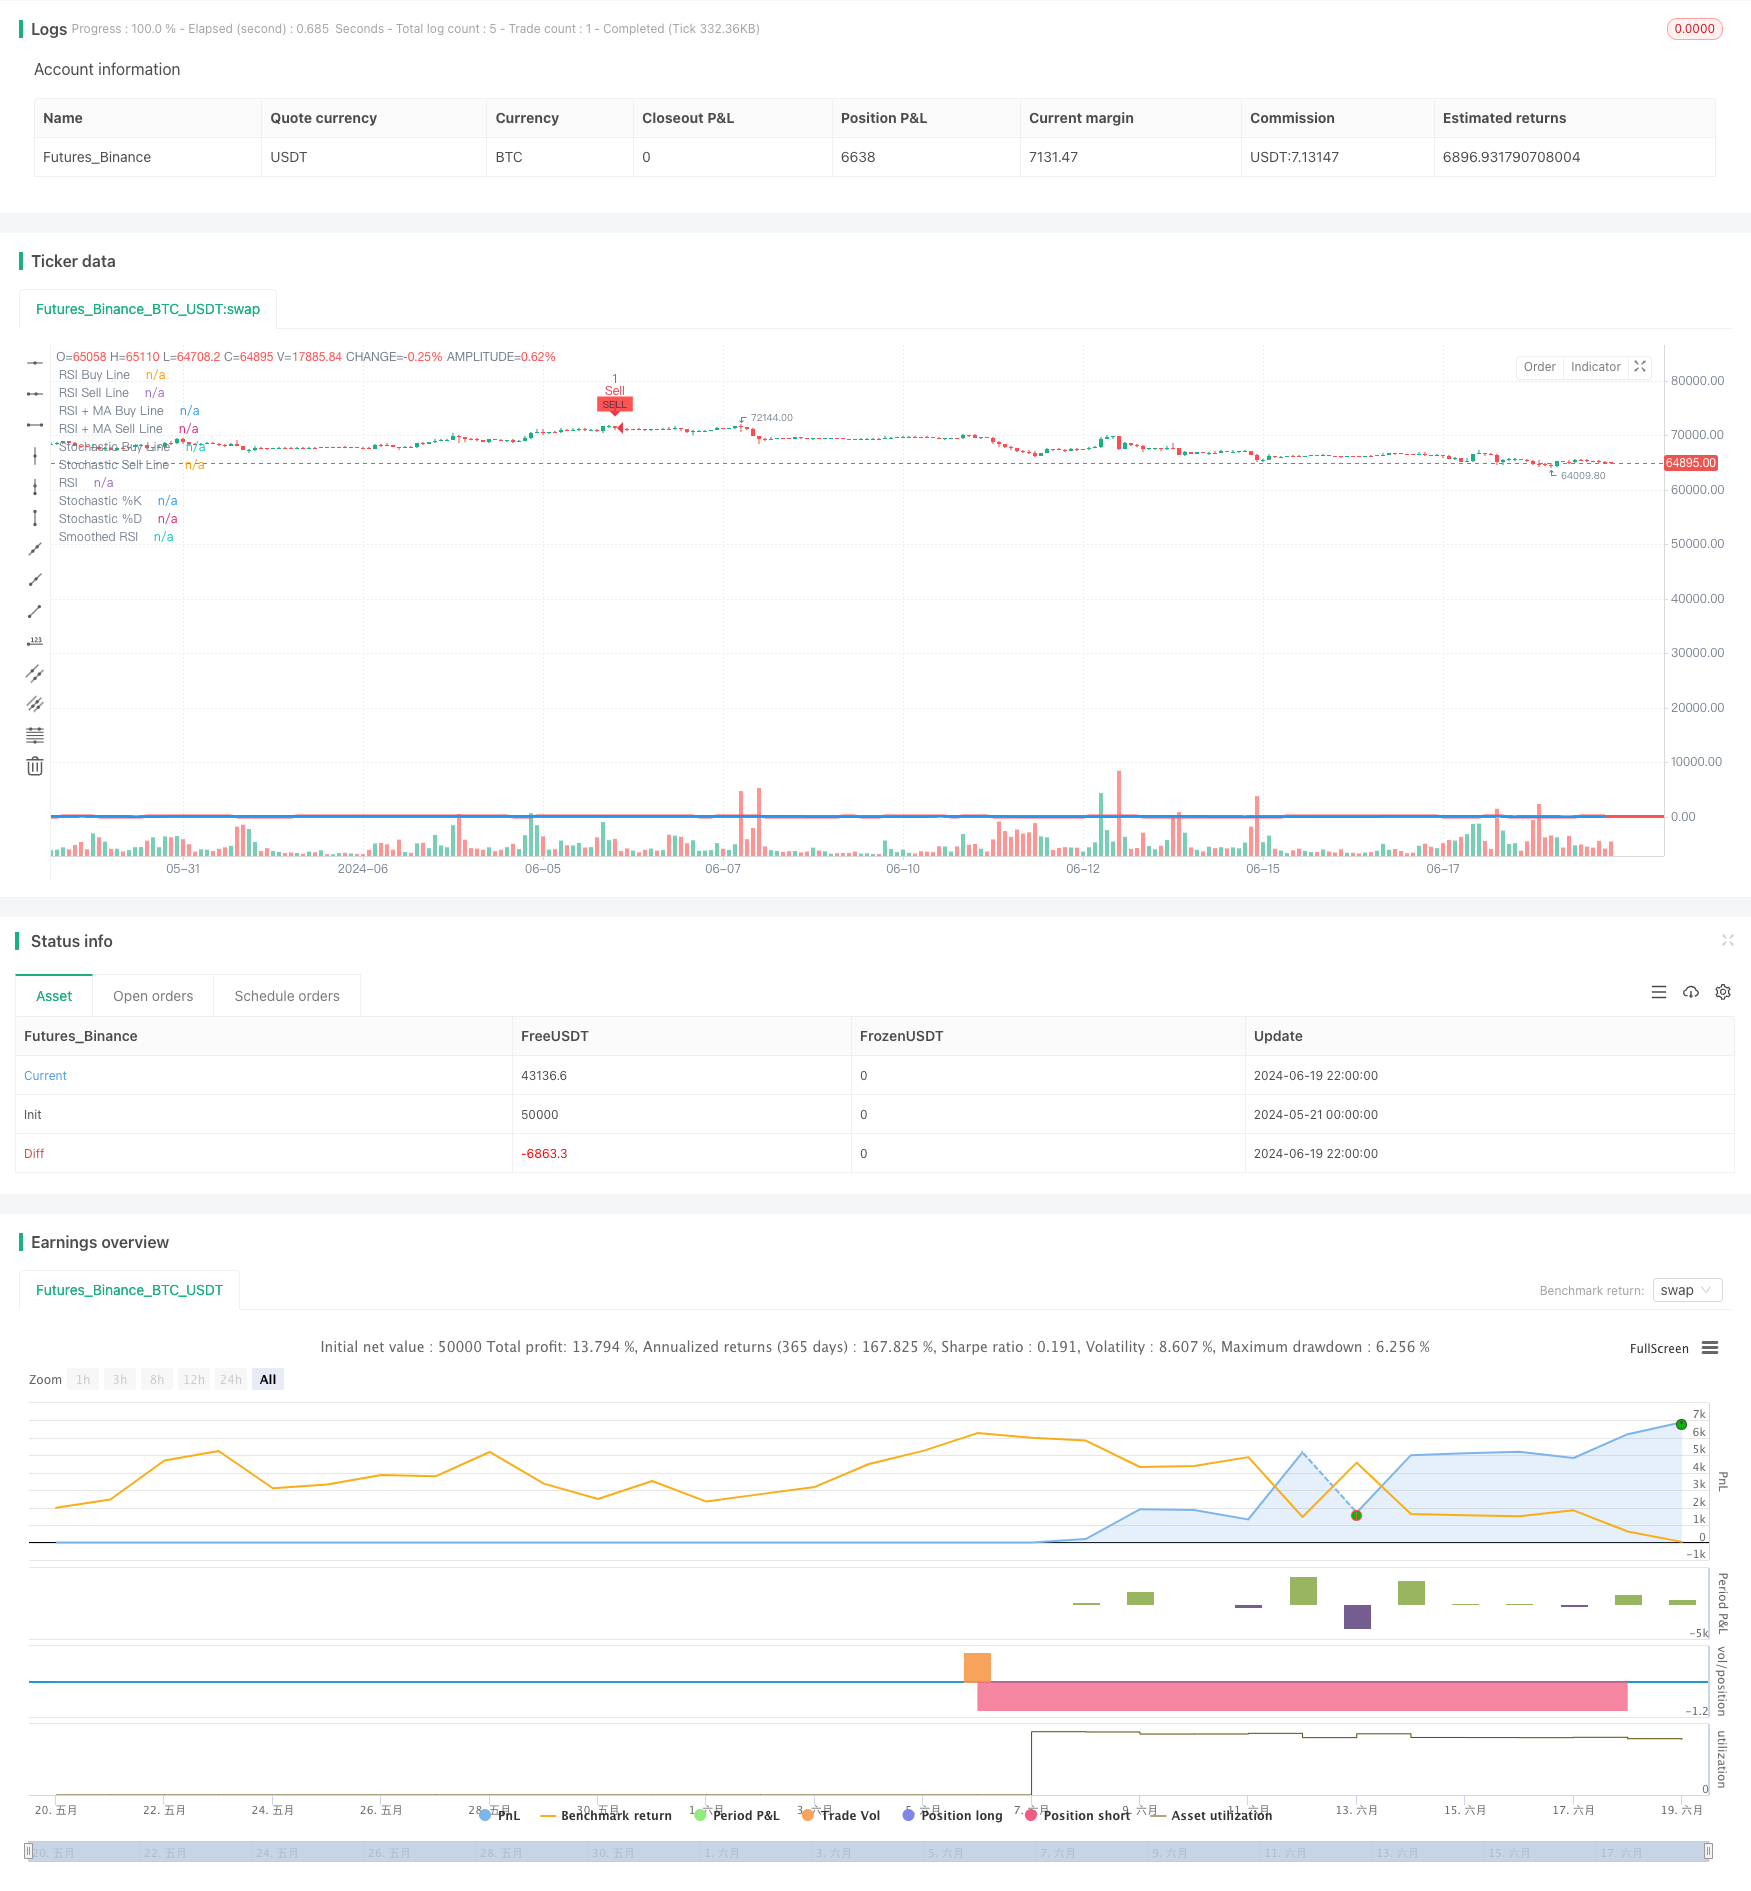
RSIとストカスティック・フュージョン・クロス・戦略
作者: リン・ハーンチャオチャンタグ:RSIストックSMAエイマWMASMMAVMMA

概要
この戦略は,主に相対強度指数 (RSI) とストカスティックオシレーター (Stochastic Oscillator) の特徴を組み合わせ,移動平均 (MA) の概念も組み込む包括的な技術分析システムである.この戦略の核心理念は,複数のモメント指標のクロスオーバーと
戦略の原則
-
RSI 分析
- 標準的な14期RSIを使います
- セット 購入 (37) 販売 (49) 限界値
- RSIが上昇して買い値を下回ると,上昇シグナルの1つと考えられます.
- RSIが売り値を下回り,売り値を超えると,下落シグナルの1つと考えられます.
-
調整されたRSI:
- RSIに移動平均値が適用され,SMA,EMA,WMA,SMMA,またはVMMAのオプションがあります.
- RSIとその滑らかな線間のクロスオーバーは,追加の信号確認のために使用されます.
-
ストカスティックオシレーター分析:
- 標準ストキャスティック設定 (14,3,3) を使います.
- 超買い値 (80) と超売値 (20) を設定します.
- %Kと%Dの線の黄金十字と死十字は,取引信号の重要な構成要素である.
-
全面的な信号生成:
- 購入信号:RSIが上昇し,購入限界を下回る,ストカスティック%Kがオーバーセールラインを下回り,黄色のクロスで,RSIがスムーズなRSI上に横断し,RSI+MA購入ラインを下回る.
- 売る信号:RSIが売る値を下り,売る値を超え,ストカスティック%Kがデッドクロスで過買い線を超え,RSIがスムーズなRSIを下り,RSI+MA売る線を超え.
戦略 の 利点
-
マルチインジケーター融合: RSI,ストカスティック,移動平均を組み合わせることで,戦略は複数の角度から市場の勢いを分析し,誤った信号を減らすことができます.
-
ダイナミック適応性: RSI とストカスティックからのクロスオーバー信号を使用することで,異なる市場環境により良い適応が可能になります.
-
トレンド 確認: RSI と 滑らかな 線 の 交差 は,不確実 な 信号 を フィルタリング する こと に 役立つ 追加の トレンド 確認 を 提供 し ます.
-
柔軟性: この戦略は,RSI長度や購入/販売の限界値などの複数のパラメータをユーザーにカスタマイズできるようにし,異なる市場や個人の好みに合わせて調整できます.
-
ビジュアルフィードバック: 戦略は豊かなチャート機能を提供し,トレーダーは直感的に市場状況と信号生成プロセスを理解するのに役立ちます.
戦略リスク
-
過剰取引:多種多様な条件により,頻繁に信号が生成され,取引コストが上昇する可能性があります.
-
パラメータ感度: 戦略は複数の調整可能なパラメータに依存する. 適切なパラメータ設定は戦略のパフォーマンスが低下する可能性があります.
-
市場環境依存性: 明確な傾向や範囲限定条件のない市場では,戦略は多くの誤った信号を生む可能性があります.
-
テクニカル指標への過度な依存: 基本値や市場情勢などの他の重要な要因を無視すると判断が誤る可能性があります.
戦略の最適化方向
-
トレンドフィルターを追加: 長期移動平均値やADX指標を組み込み,強いトレンドでの取引のみを保証します.
-
音量分析を導入する.信号の信頼性を向上させるため,音量指標を意思決定プロセスに統合する.
-
脱出戦略を最適化する.ATRベースのトライリングストップやダイナミックストップなどの,より洗練された利益とストップ・ロスのメカニズムを開発する.
-
タイムフレームコーディネーション: 誤った信号を減らして精度を向上させるために,複数のタイムフレームで信号を検証する.
-
機械学習統合: マシン学習アルゴリズムを使用してパラメータ選択と信号生成プロセスを最適化します.
結論
RSIとストーカスティック・フュージョン・クロス戦略は,複数のモメント指標と移動平均を組み合わせて重要な市場転換点を把握することを目的とした包括的な技術分析システムである.この戦略の強みは,多次元分析アプローチと柔軟なパラメータ設定にあります.これは異なる市場環境に適応することを可能にします.しかし,この戦略は,過剰取引やパラメータ敏感性などのリスクにも直面しています.将来の最適化は,戦略の適応能力を改善し,より多くの市場情報を組み込み,リスク管理メカニズムを強化することに焦点を当てるべきです.継続的な改善とテストを通じて,この戦略は,取引決定を支援するための強力なツールになる可能性があります.
/*backtest
start: 2024-05-21 00:00:00
end: 2024-06-20 00:00:00
period: 2h
basePeriod: 15m
exchanges: [{"eid":"Futures_Binance","currency":"BTC_USDT"}]
*/

//@version=5
strategy("-VrilyaSS-RSI&SToch-Cross+2xRSI+2xStoch-Lines+RSI-SMA-Cross-V4-", overlay=true)

// RSI settings
rsiLength = input.int(14, title="RSI Length")
rsiSource = input.source(ohlc4, title="RSI Source")
rsiBuyLine = input.int(37, title="RSI Buy Line", minval=0, maxval=100)
rsiSellLine = input.int(49, title="RSI Sell Line", minval=0, maxval=100)
rsi = ta.rsi(rsiSource, rsiLength)

// Smoothed RSI (Gleitender Durchschnitt von RSI)
smaLength = input.int(14, title="MA Length for RSI")
smaSource = input.source(ohlc4, title="MA Source for RSI")
maTypeRSI = input.string(title="MA Type for RSI", defval="SMA", options=["SMA", "EMA", "WMA", "SMMA (RMA)", "VMMA"])
f_get_ma_rsi(source, length, type) =>
    switch type
        "SMA" => ta.sma(source, length)
        "EMA" => ta.ema(source, length)
        "WMA" => ta.wma(source, length)
        "SMMA (RMA)" => ta.rma(source, length) // Smoothed Moving Average (Simple Moving Average)
        "VMMA" => ta.vwma(source, length) // Volume Weighted Moving Average (VMMA)
smoothedRsi = f_get_ma_rsi(ta.rsi(smaSource, rsiLength), smaLength, maTypeRSI)
rsiSmaBuyLine = input.int(40, title="RSI + MA Buy Line", minval=0, maxval=100)
rsiSmaSellLine = input.int(60, title="RSI + MA Sell Line", minval=0, maxval=100)

// Stochastic settings
kLength = input.int(14, title="Stochastic K Length")
kSmoothing = input.int(3, title="Stochastic K Smoothing")
dSmoothing = input.int(3, title="Stochastic D Smoothing")
stochBuyLine = input.int(20, title="Stochastic Buy Line", minval=0, maxval=100)
stochSellLine = input.int(80, title="Stochastic Sell Line", minval=0, maxval=100)
stochK = ta.sma(ta.stoch(close, high, low, kLength), kSmoothing)
stochD = ta.sma(stochK, dSmoothing)

// Stochastic Crosses
bullishCross = ta.crossover(stochK, stochD)
bearishCross = ta.crossunder(stochK, stochD)

// RSI Direction and Crosses
rsiUp = ta.change(rsi) > 0
rsiDown = ta.change(rsi) < 0
rsiCrossAboveSMA = ta.crossover(rsi, smoothedRsi) and rsi < rsiSmaBuyLine
rsiCrossBelowSMA = ta.crossunder(rsi, smoothedRsi) and rsi > rsiSmaSellLine

// Buy Signal (RSI geht hoch und ist unter der Buy-Line, Stochastic unter Buy-Line mit bullischem Cross, und RSI kreuzt über SMA unterhalb der RSI+SMA Buy Line)
buySignal = rsiUp and rsi < rsiBuyLine and bullishCross and stochK < stochBuyLine and rsiCrossAboveSMA

// Sell Signal (RSI geht runter und ist über der Sell-Line, Stochastic über Sell-Line mit bärischem Cross, und RSI kreuzt unter SMA oberhalb der RSI+SMA Sell Line)
sellSignal = rsiDown and rsi > rsiSellLine and bearishCross and stochK > stochSellLine and rsiCrossBelowSMA

// Plot RSI, Smoothed RSI, and Stochastic for reference with default visibility off
plot(rsi, title="RSI", color=color.yellow, linewidth=2, display=display.none)
plot(smoothedRsi, title="Smoothed RSI", color=color.blue, linewidth=2, display=display.none)
hline(rsiBuyLine, "RSI Buy Line", color=color.green, linewidth=2, linestyle=hline.style_solid, display=display.none)
hline(rsiSellLine, "RSI Sell Line", color=color.red, linewidth=2, linestyle=hline.style_solid, display=display.none)
hline(rsiSmaBuyLine, "RSI + MA Buy Line", color=color.purple, linewidth=2, linestyle=hline.style_solid, display=display.none)
hline(rsiSmaSellLine, "RSI + MA Sell Line", color=color.orange, linewidth=2, linestyle=hline.style_solid, display=display.none)
plot(stochK, title="Stochastic %K", color=color.aqua, linewidth=2, display=display.none)
plot(stochD, title="Stochastic %D", color=color.red, linewidth=3, display=display.none)
hline(stochBuyLine, "Stochastic Buy Line", color=color.green, linewidth=2, linestyle=hline.style_solid, display=display.none)
hline(stochSellLine, "Stochastic Sell Line", color=color.red, linewidth=2, linestyle=hline.style_solid, display=display.none)

// Alert conditions
alertcondition(buySignal, title="Buy Signal", message="Buy Signal: RSI and Stochastic conditions met.")
alertcondition(sellSignal, title="Sell Signal", message="Sell Signal: RSI and Stochastic conditions met.")

// Plot buy and sell signals for visual reference
plotshape(series=buySignal, location=location.belowbar, color=color.new(color.green, 0), style=shape.labelup, text="BUY", textcolor=color.black, size=size.tiny)
plotshape(series=sellSignal, location=location.abovebar, color=color.new(color.red, 0), style=shape.labeldown, text="SELL", textcolor=color.black, size=size.tiny)

// Strategy orders
if (buySignal)
    strategy.entry("Buy", strategy.long)
if (sellSignal)
    strategy.entry("Sell", strategy.short)
- RSIのダイバージェンスと移動平均を組み合わせた高度な定量取引戦略
- ダイナミック RSI スマートタイム スウィング トレーディング 戦略
- 多指標シネージストラテジーはボリンジャーバンド,フィボナッチ,MACD,RSI
- RSI,MACDおよびボリュームに基づく多指標適応型取引戦略
- SSSについて
- クロドルのスーパートレンド
- リスク管理システム付きのマルチEMAトレンド・モメンタム・トレード戦略
- Scalping EMA ADX RSI 購入/売却
- スーパースカルパー - 5分 15分
- 先進的な柔軟な多期移動平均のクロスオーバー戦略
- RSIのダイバージェンスと移動平均を組み合わせた高度な定量取引戦略
- EMA/SMA 多指標総合動向 戦略をフォローする
- テスト戦略 インタラクションコントローラ
- テスト戦略 インターフェースパラメータ
- ボリンジャー・バンドは,ボリュームフィルター付きのリバーション・トレーディング・戦略を意味する.
- 多指標性高レバレッジの短期取引戦略
- 戦略をフォローする多指標複合動向
- 多期フィボナッチ・RSI 金十字トレンド 定量的な取引戦略
- ダイナミックストップ・ロストとテイク・プロフィート 双重移動平均トレンド キャンドルスティック反応の戦略に従う
- 機械学習に基づく移動平均クロスオーバー量的な取引戦略
- マルチEMAクロスオーバートレンド 戦略をフォローする
- 動的振動傾向の捉え方
- VAWSIと動的長度計算多指標分析システムによるトレンド持続逆転戦略
- ダイナミックチャネルの割合 封筒戦略
- スーパートレンド戦略最適化: ダイナミック・ボラティリティ・トラッキングと強化された取引シグナルシステム
- 機械学習にインスパイアされた二重移動平均RSI取引戦略
- 多指標高周波取引戦略: 指数関数移動平均値と動向指標を組み合わせた短期取引システム
- トリプルスタンダードデバイエーション・インパルス・リバース・トレーディング・戦略
- 多期指数指数移動平均のクロスオーバー戦略とオプション取引提案システム
- ダブル・スーパートレンド・マルチステップ・トラッキング・テイク・プロフィート戦略