PVT-EMA トレンド・クロスオーバー・ボリューム・価格戦略
作者: リン・ハーンチャオチャン開催日:2024年11月27日 15:01:02タグ:PVTエイマ

概要
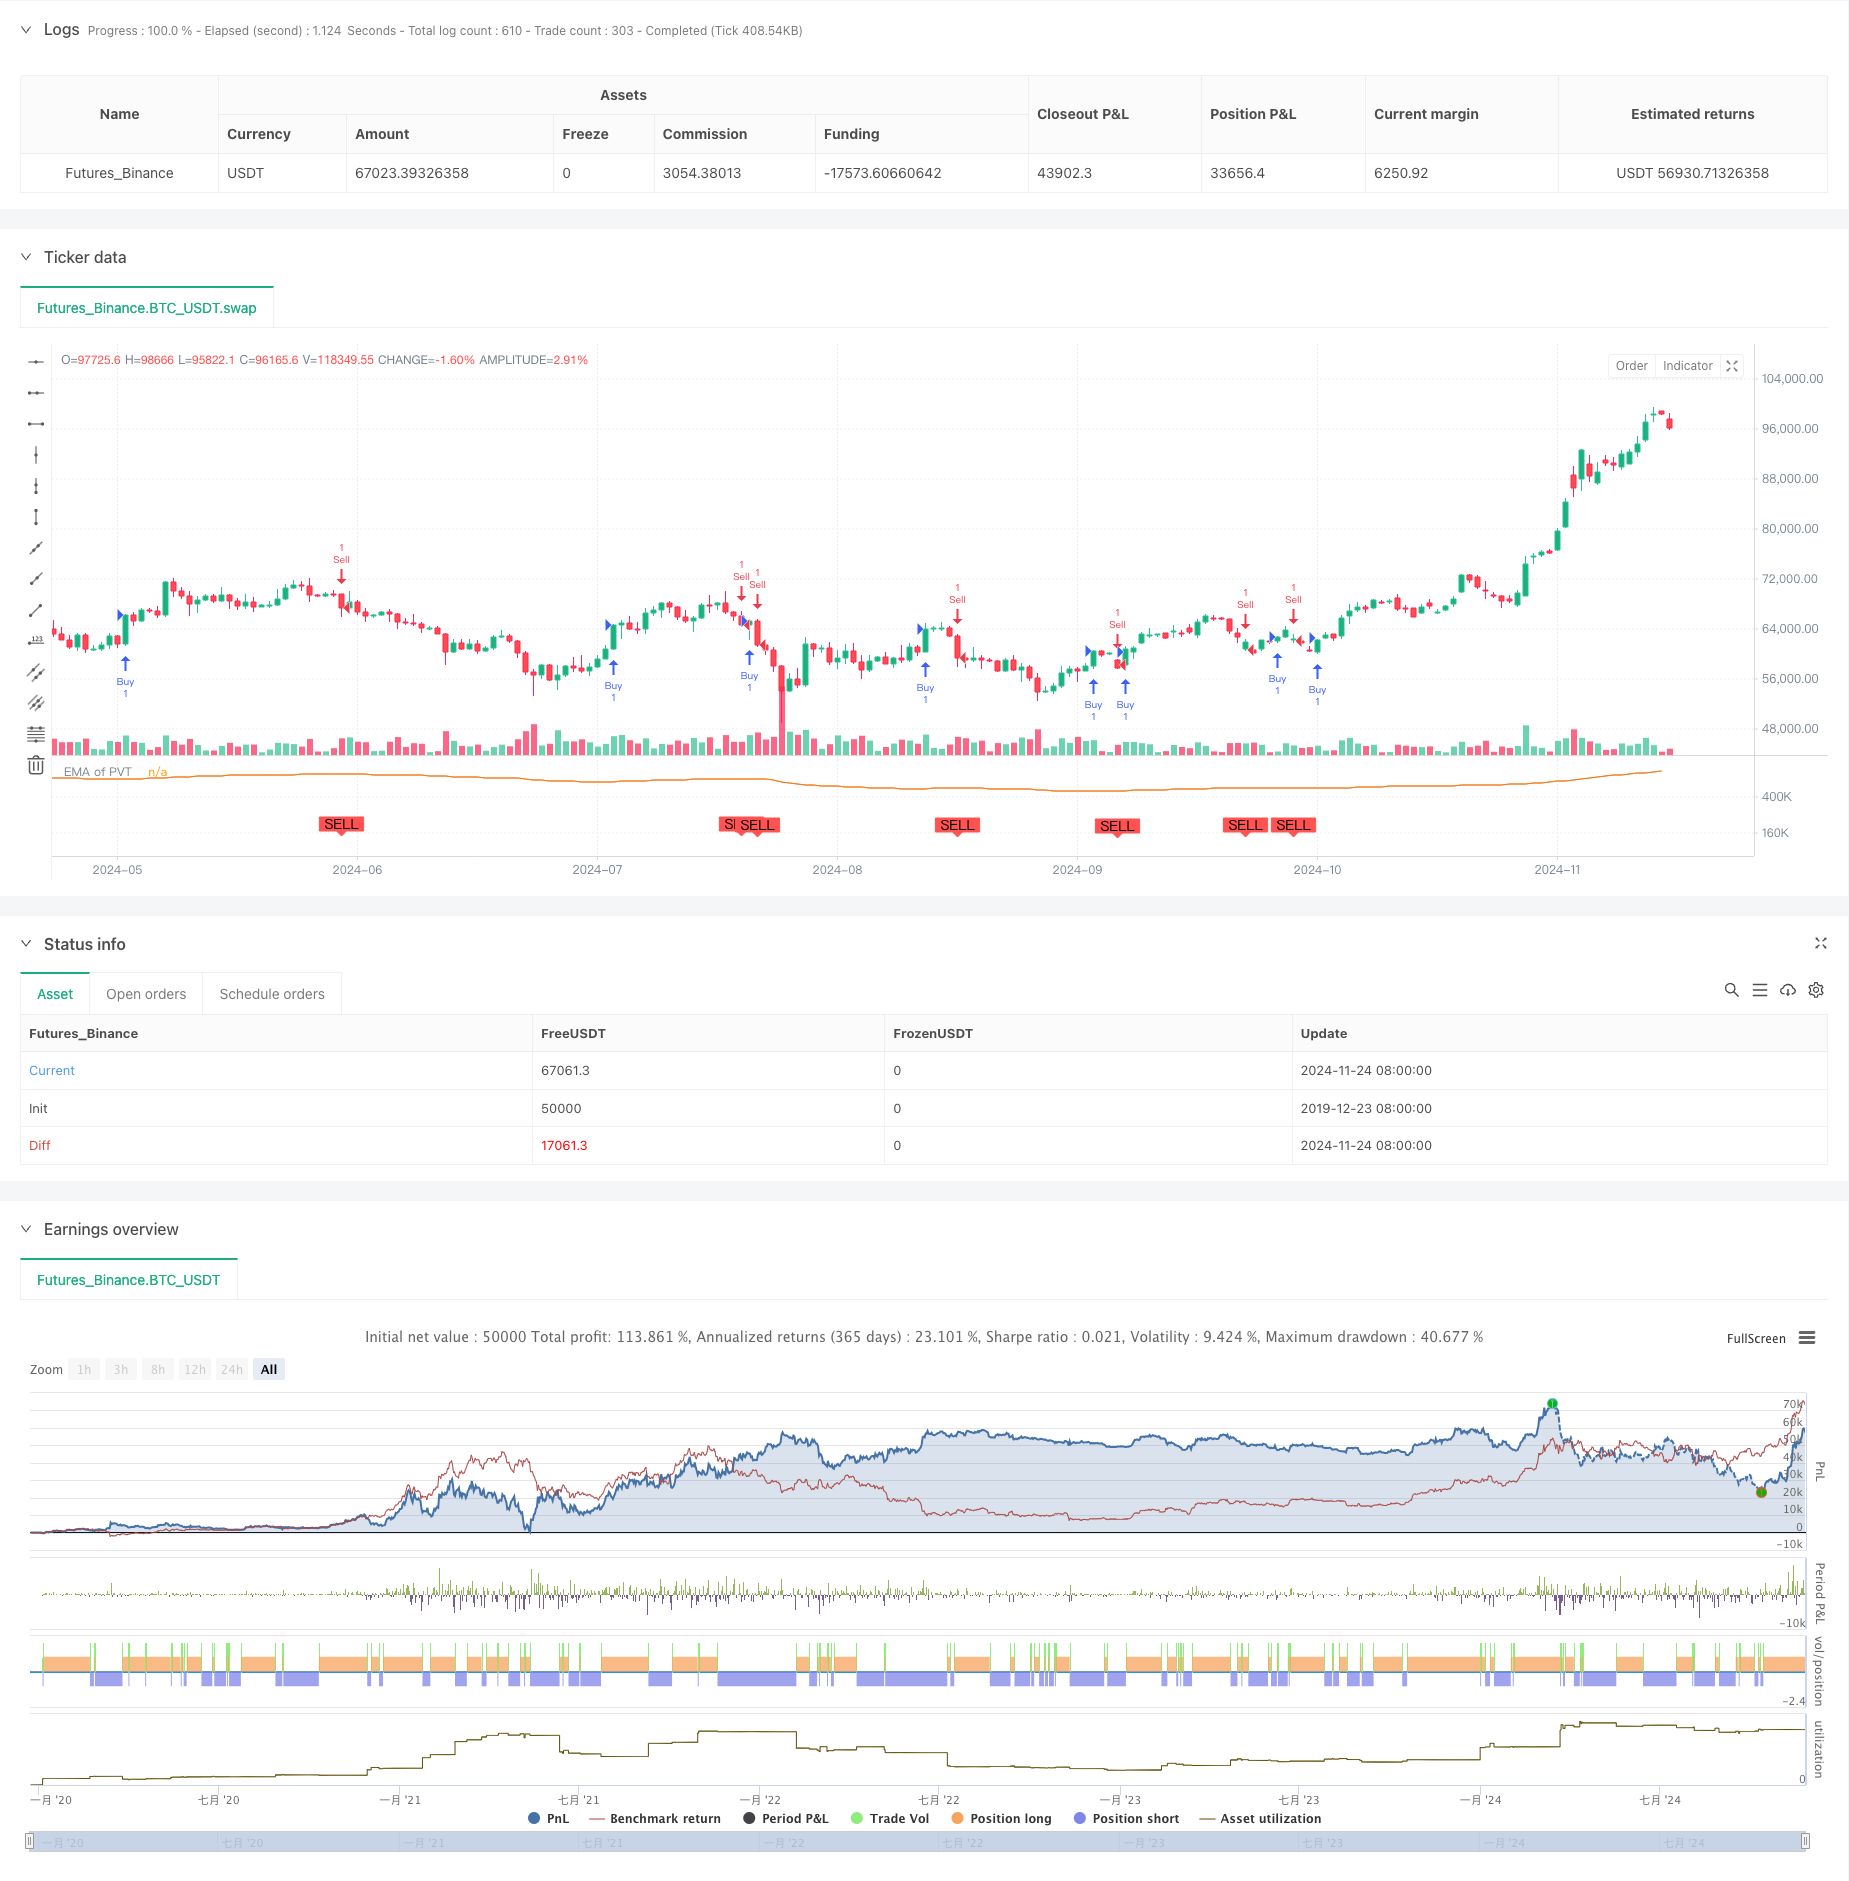
この戦略は,価格ボリュームトレンド (PVT) インジケーターとその指数指数移動平均 (EMA) のクロスオーバーをベースとしたトレンドフォローする取引システムである.この戦略は,PVTとEMAのクロスオーバー状況をモニタリングすることによって市場のトレンド変化を特定し,それによって潜在的な取引機会を把握する.この方法は,価格動向とボリューム変化を組み合わせて,実際の市場のトレンドをより正確に反映する.
戦略原則
戦略の核心は,PVT指標を使用し,価格動向と取引量とを組み合わせて市場動向を追跡する.具体的には,PVT値は,日々の価格変化パーセントと日々のボリュームの積を積んで計算される.PVTの20期 EMAは,基準線として計算される.PVTがEMAを超えると購入信号が生成され,PVTがEMAを下回ると販売信号が生成される.これらのクロスオーバー信号は,市場のトレンドターニングポイントを決定するために使用される.
戦略 の 利点
- 価格と量の統合: 戦略は価格と量のデータを統合することによってより包括的な市場分析を提供します.
- トレンド確認: EMA をフィルターとして使用することで,誤った信号が減少し,取引の信頼性が向上します.
- クリア・シグナル:クロスオーバー・シグナルは明確で実行が簡単です.
- 高度な適応性: この戦略は,異なる市場環境に適用され,特に量の変動が大きい市場ではうまく機能します.
- 調整可能なパラメータ: EMA 期間は,異なる取引時間枠と市場特性に応じて調整できます.
戦略リスク
- 遅延: EMA の使用により,シグナルが遅延する可能性があります.
- 変動市場での不良業績: 横向市場では頻繁に誤った信号を生む可能性があります.
- マネーマネジメント: 戦略自体はストップ・ロストやテイク・プロフィートのレベルを設定していないため,トレーダーは独立してリスクを管理する必要があります.
- 量依存性: 戦略の有効性は,量データの質と信頼性に大きく依存する.
- トランザクションコスト: 頻繁に取引信号が送信されれば,高い取引コストが発生する可能性があります.
戦略の最適化方向
- ストップ・ロスの最適化:ATRまたは固定パーセントストップを使用して動的ストップ・ロスのメカニズムを追加することを提案します.
- シグナルフィルタリング: 誤った信号を減らすために,より長い期間の移動平均値などのトレンドフィルターを追加できます.
- ポジション管理: 信号強さと市場変動に基づいてポジションサイズを動的に調整することを提案します.
- 時間フィルター: 取引時間のフィルタを組み込み,非常に不安定な期間の取引を避ける.
- 複数のタイムフレームの確認:信号の信頼性を向上させるために複数のタイムフレームの確認メカニズムを追加することを検討する.
結論
PVT-EMAトレンドクロスオーバー戦略は,価格,ボリューム,トレンド分析を組み合わせた完全な取引システムである.特定の遅れと偽信号リスクがある一方で,適切な最適化とリスク管理を通じて信頼できる取引ツールになることができます.トレーダーはライブ実装前に徹底的なバックテストを行い,特定の市場特性に合わせてパラメータを調整することをお勧めします.
/*backtest
start: 2019-12-23 08:00:00
end: 2024-11-25 08:00:00
period: 1d
basePeriod: 1d
exchanges: [{"eid":"Futures_Binance","currency":"BTC_USDT"}]
*/

// This Pine Script™ code is subject to the terms of the Mozilla Public License 2.0 at https://mozilla.org/MPL/2.0/
// © PakunFX

//@version=5
strategy(title="PVT Crossover Strategy", shorttitle="PVT Strategy", overlay=false, calc_on_every_tick=true)

// PVTの計算
var cumVol = 0.
cumVol += nz(volume)
if barstate.islast and cumVol == 0
    runtime.error("No volume is provided by the data vendor.")
src = close
pvt = ta.cum(ta.change(src) / src[1] * volume)

// EMAの計算(PVTをソースに使用)
emaLength = input.int(20, minval=1, title="EMA Length")
emaPVT = ta.ema(pvt, emaLength)
// プロットをオフにする
plot(emaPVT, title="EMA of PVT", color=#f37f20, display=display.none)

// クロスオーバー戦略
longCondition = ta.crossover(pvt, emaPVT)
shortCondition = ta.crossunder(pvt, emaPVT)

// シグナル表示もオフにする
plotshape(series=longCondition, title="Buy Signal", location=location.belowbar, color=color.green, style=shape.labelup, text="BUY", display=display.none)
plotshape(series=shortCondition, title="Sell Signal", location=location.abovebar, color=color.red, style=shape.labeldown, text="SELL", display=display.none)

// 戦略エントリー
if (longCondition)
    strategy.entry("Buy", strategy.long)
if (shortCondition)
    strategy.entry("Sell", strategy.short)
関連性
- ダイナミックストップ・ロスのシステムによる戦略をフォローする多指標シネージーシート
- コンボ 2/20 EMA & バンドパスフィルター
- EMA トレンドクラウド
- トレンドスカルプ-フラクタルボックス-3EMA
- 短期シグナル戦略と EMAのクロスオーバー
- イチモク雲スムーズオシレーター
- 複数のEMAのゴールデンクロス戦略
- ダイナミック・デュアル・EMA・クロスオーバー・量子的取引戦略
- バックテスト - 指標
- 全体キャンドルシグナルシステムとダブルEMAモメンタムトレンド・トレード戦略
もっと
- ストップ・ロストとテイク・プロフィート最適化システムによるEMAクロスオーバー戦略
- VWAP-MACD-RSI 多要素量的な取引戦略
- トリプル・ムービング・メアディア トレンドフォローとモメント・インテグレーション 定量取引戦略
- Zスコアとスーパートレンドベースのダイナミック・トレーディング戦略: ロング・ショート・スイッチングシステム
- アダプティブ・ボリンジャー・ブレイクと移動平均量的な戦略システム
- 複数の技術指標の統合を備えたAI最適化された適応型ストップ損失取引システム
- 多期移動平均のクロスオーバーと量分析システム
- 二重移動平均勢力の追跡量的な戦略
- 調整可能なストップ・ロストとテイク・プロフィートを持つ二重移動平均クロスオーバー戦略
- 動向オシレーターに基づく戦略をフォローする適応傾向
- MACD-EMA 多期動的クロスオーバー量的な取引システム
- MACD ダイナミック・オシレーション・クロスプレジクション戦略
- VWAP-ATR ダイナミック・プライス・アクション・トレーディング・システム
- Bollinger Bands と RSI クロス ベース ダイナミック トレンド 定量 戦略
- Bollinger Bands,RSI,ATRベースのダイナミックストップ・ロース・システムによる平均逆転戦略
- パラボリックSAR指標に基づくダイナミック取引戦略システム
- アダプティブ・ボラティリティ・アンド・モメント・量子トレード・システム (AVMQTS)
- Bollinger Bands と Candlestick パターンに基づく高度なトレンド取引戦略
- 脱出戦略の後にATR波動性と移動平均に基づく適応傾向
- 全体キャンドルシグナルシステムとダブルEMAモメンタムトレンド・トレード戦略