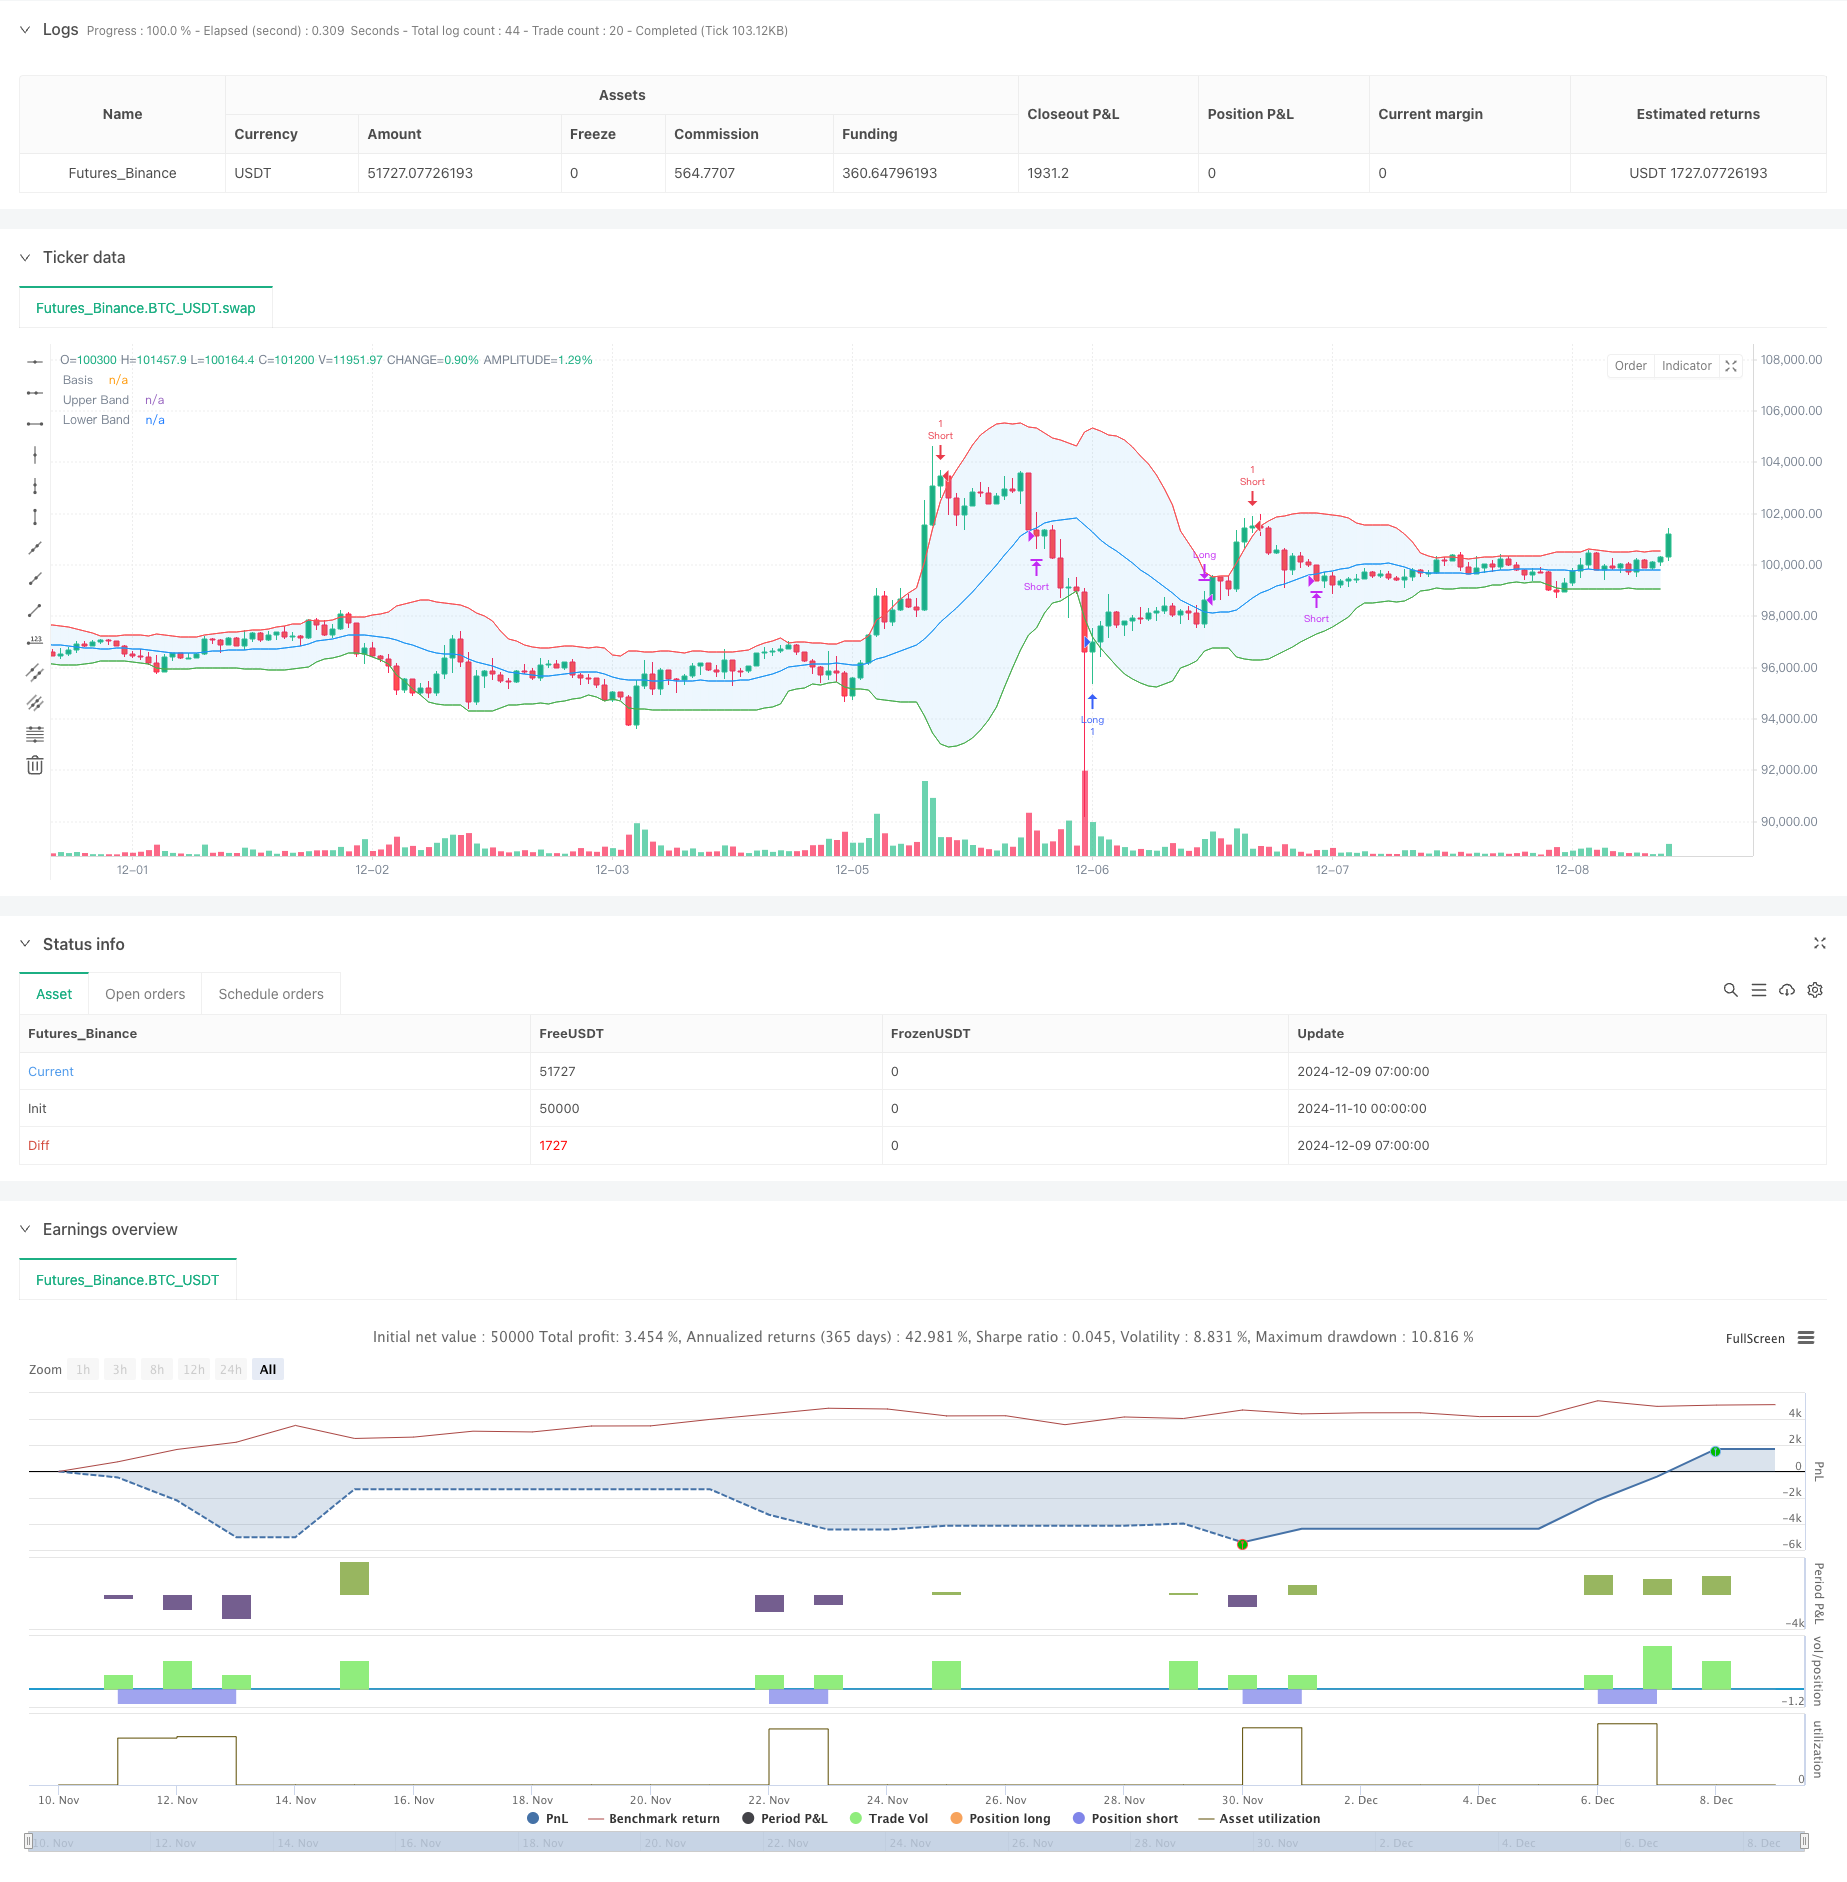
トリプル・ボリンガー・バンドは,定量的な取引戦略を踏まえて,トレンドに触れる.
作者: リン・ハーンチャオチャン開催日:2024年12月11日 11:01:52タグ:BBSMASDクロス

概要
この戦略は,伝統的なボリンジャーバンドのトレンドフォローシステムによる改良版である.トレンド信頼性を確認するために,ボリンジャーバンドの3回の連続的なタッチで価格アクションをモニターし,結果としてより高い勝ち率が得られる.この戦略は,中間帯として20期移動平均と上下帯の2つの標準偏差を使用する.帯の境界との価格関係の詳細な分析を通じて,ユニークな利点を持つ取引システムを達成する.
戦略の原則
基本論理は,ボリンジャーバンドの境界線における持続的な価格変動を特定するためのカウントメカニズムに依存している. 価格は3回連続して下帯を下回るときに長い信号,上帯を下回るときに3回連続して短い信号を生成する. このメカニズムは誤ったブレイクを効果的にフィルタリングし,取引の信頼性を向上させる. 戦略は中帯 (20期移動平均) を出口信号として使用し,価格が中帯に戻ると取引を完了する. このデザインはトレンドキャプチャとタイムリーな利益を取ることを保証する.
戦略 の 利点
- 高い信頼性: 取引信号の確認のためにバンド境界を連続して3回触る必要があることは,誤ったブレイクの影響を大幅に軽減します.
- リスク管理:移動平均を出口ポイントとして使用すると,トレンドが逆転するときに時速ストップロスを可能にします.
- 優れた適応性: 戦略パラメータは,異なる市場条件に調整され,良い普遍性を提供します.
- 適度な取引頻度: 厳格なエントリー条件により,過剰取引が防止される.
- 理性的なマネーマネジメント: 口座の自己資本の割合に基づくポジションのサイズ設定は,制御されたリスクを確保します.
戦略リスク
- 市場リスク: 横向市場では頻繁に誤った信号を生む可能性があります.
- 変動リスク: 変動する市場状況下で重大な変動損失の可能性.
- パラメータ感度: 戦略のパフォーマンスがボリンジャーバンドのパラメータ設定に大きく依存します.
- トレンド逆転リスク: 急激なトレンド逆転で重大な損失を伴う可能性があります.
戦略の最適化方向
- 音量指標を組み込む:音量分析を組み合わせることで信号の信頼性が向上する.
- ダイナミックパラメータ調整:市場変動に基づいてボリンジャーバンドのパラメータを調整する.
- トレンド確認指標を追加する: トレンド方向性を確認するための追加の技術指標を追加する.
- ストップ・ロスのメカニズムの最適化: 異なる市場環境のためにより柔軟なストップ・ロスのアプローチを設計する.
- ポジション管理を向上させる 信号強度に基づいてポジションサイズを動的に調整する
概要
この戦略は,高度に信頼性の高いトレンドフォローアプローチを実装することで,伝統的なボリンジャーバンド取引システムに優れています.そのユニークなトリプルタッチ確認メカニズムは,有効に勝利率を増加させ,移動平均ベースの退出メカニズムは合理的な利益を得るソリューションを提供します.固有のリスクが存在しているにもかかわらず,提案された最適化方向は戦略の安定性と収益性をさらに向上させることができます.
/*backtest
start: 2024-11-10 00:00:00
end: 2024-12-09 08:00:00
period: 1h
basePeriod: 1h
exchanges: [{"eid":"Futures_Binance","currency":"BTC_USDT"}]
*/

//@version=6
strategy("Bollinger Bands Strategy - 3 Crossings", overlay=true)

// Input Parameters
length = input.int(20, title="Bollinger Bands Length", minval=1)
src = input(close, title="Source")
mult = input.float(2.0, title="Multiplier", step=0.1)

// Calculate Bollinger Bands
basis = ta.sma(src, length)
dev = mult * ta.stdev(src, length)
upper = basis + dev
lower = basis - dev

// Plot Bollinger Bands
plotBasis = plot(basis, color=color.blue, title="Basis")
plotUpper = plot(upper, color=color.red, title="Upper Band")
plotLower = plot(lower, color=color.green, title="Lower Band")
fill(plot1=plotUpper, plot2=plotLower, color=color.new(color.blue, 90), title="Band Fill")

// Counter Variables
var int longCrossCount = 0
var int shortCrossCount = 0

// Detect Crossings
longCondition = close < lower  // Price closes below the lower band
shortCondition = close > upper  // Price closes above the upper band

if longCondition
    longCrossCount += 1  // Increment the counter for long
    shortCrossCount := 0  // Reset the short counter

if shortCondition
    shortCrossCount += 1  // Increment the counter for short
    longCrossCount := 0  // Reset the long counter

if not longCondition and not shortCondition
    longCrossCount := 0  // Reset if no crossing
    shortCrossCount := 0

// Entry and Exit Rules
if longCrossCount >= 3 and strategy.position_size <= 0
    strategy.entry("Long", strategy.long)
    longCrossCount := 0  // Reset the counter after entering

if shortCrossCount >= 3 and strategy.position_size >= 0
    strategy.entry("Short", strategy.short)
    shortCrossCount := 0  // Reset the counter after entering

// Exit Condition (When Price Returns to the Middle Band)
exitCondition = ta.crossover(src, basis) or ta.crossunder(src, basis)

if exitCondition and strategy.position_size > 0
    strategy.close("Long")
if exitCondition and strategy.position_size < 0
    strategy.close("Short")
関連性
- ボリンジャー・バンド 勢力の逆転 定量戦略
- ボリンジャー・バンドス ブレイク量的な取引戦略
- ボリンジャー・バンドは,ダイナミックなサポートを持つリバース・トレーディング・戦略を意味する.
- ボリンジャー・バンド 精密なクロスオーバー量的な戦略
- トリプルスタンダードデバイエーション ボリンガー帯 100日移動平均最適化によるブレイクアウト戦略
- 強化されたダイナミック・ボリンガー・バンド取引戦略
- Bollinger Bands と RSI の組み合わせた取引戦略
- Bollinger Bands と RSI のクロスオーバー 取引 戦略
- アダプティブ・ボリンガー・バンド ダイナミック・ポジション・マネジメント・戦略
- 多期ボリンガー帯 触動トレンド逆転 定量取引戦略
もっと
- 多指標トレンド・モメント・クロスオーバー量的な戦略
- リスクと報酬のターゲット戦略を備えた高度なダイナミックトレーリングストップ
- 先進的な長期のみ動的トレンドラインブレイク戦略
- Bollinger Bands と ATR に基づく多レベルインテリジェント・ダイナミック・トレリングストップ戦略
- ダイナミック・デュアル・EMA・クロスオーバー・ストラテジー
- Bollinger Bands と RSI の組み合わせたダイナミック・トレーディング・戦略
- RSI-ATR モメント・ボラティリティ コンビネード・トレーディング・ストラテジー
- 2つのEMAトレンドフォロー戦略と制限購入エントリー
- 多戦略技術分析取引システム
- 複数のタイムフレームを組み合わせたキャンドルスティックパターン認識取引戦略
- Bollinger Bands と RSI に基づく多次元ダイナミック・ブレイクアウト・トレーディング・システム
- RSI 平均逆転ブレイクストラテジー
- 戦略をフォローするダブル・EMA・クロスオーバー・モメンタム・トレンド
- 多段階のATR取引戦略とダイナミックな利益採取
- 2つのタイムフレームダイナミックサポート取引システム
- 多期移動平均値とRSIモメントの交差トレンド 戦略に従う
- 金融資産 MFI ベースオーバーセールゾーン エグジットとシグナル平均化システム
- マルチEMA・クロスオーバーとモメンタム・インディケーターの取引戦略
- MACD-KDJ 組み合わせたマルティンゲール・ピラミディング量的な取引戦略
- 複数のパターン認識とSRレベル取引戦略