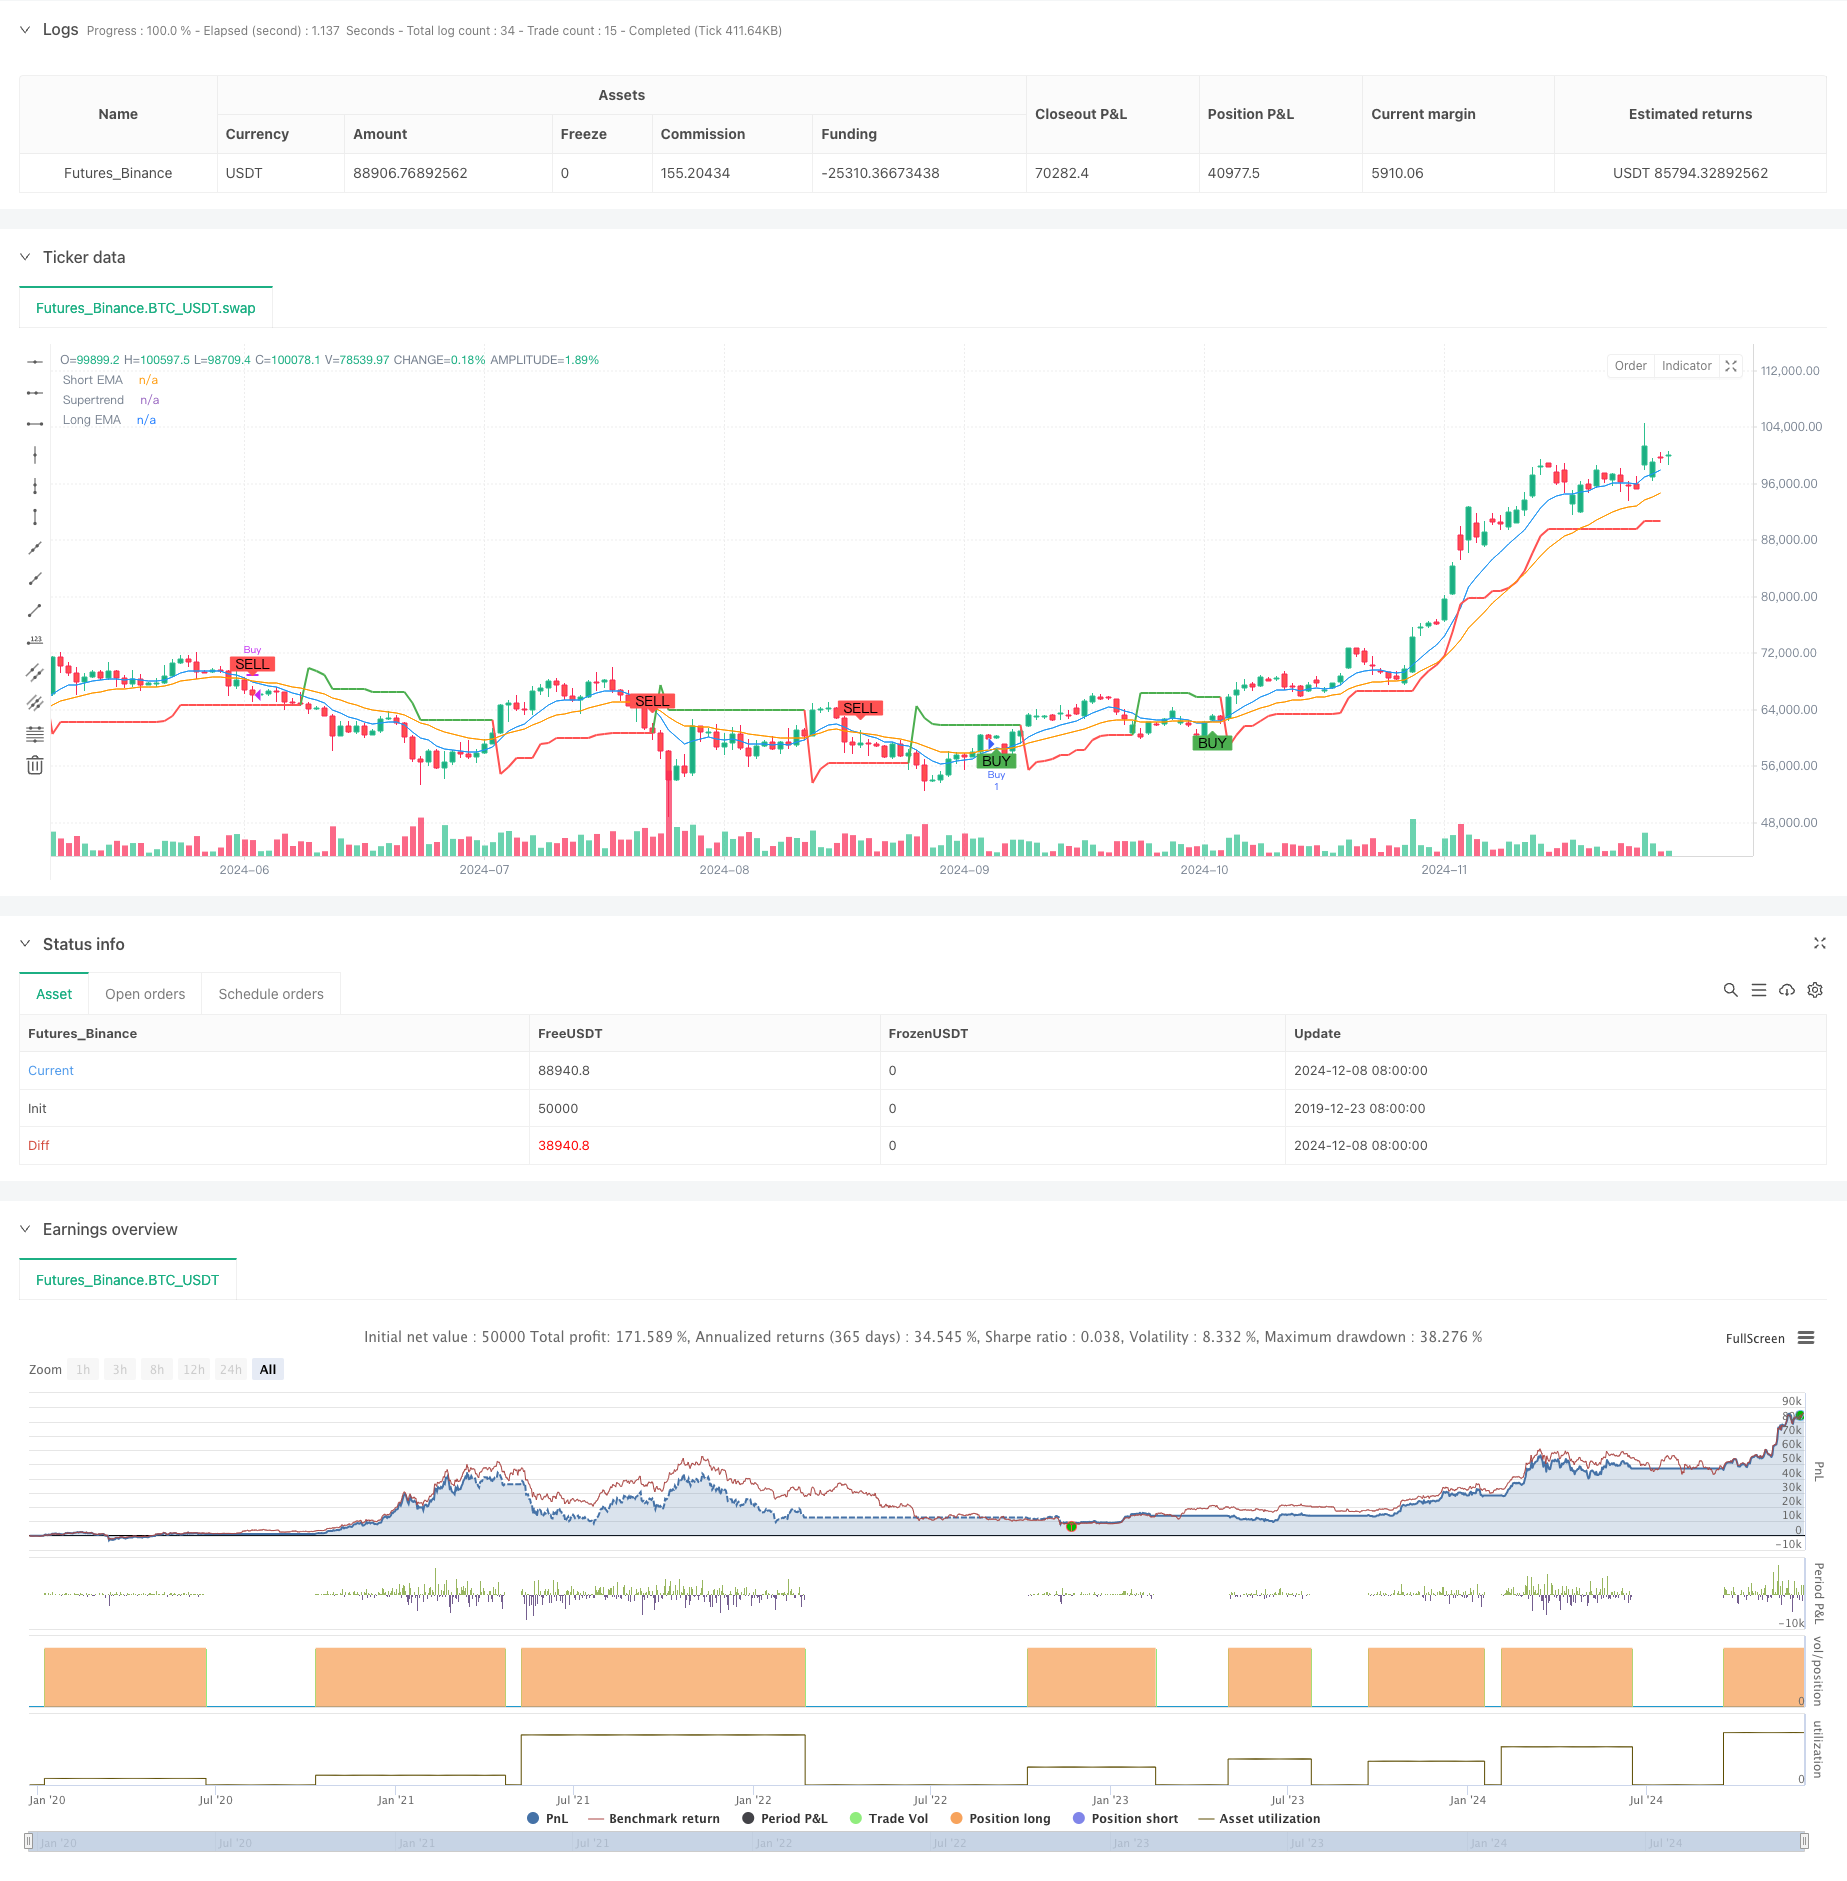
多指標トレンド・モメント・クロスオーバー量的な戦略
作者: リン・ハーンチャオチャン開催日:2024年12月11日15時51分タグ:エイマRSIATRSMA

概要
超トレンド (Supertrend),指数移動平均 (EMA),相対強度指数 (RSI) を組み合わせたマルチインジケーター取引戦略である.この戦略は,これらの3つの技術指標のクロスオーバー信号とオーバーバイト/オーバーセールレベルを通じて市場のトレンド,勢い,潜在的な逆転点を特定し,市場で最適な取引機会を探している.この戦略は,さまざまな次元からの市場分析を通じて取引の正確性と信頼性を高めるために複数の指標の利点を利用する.
戦略の原則
基本論理は,3つの主要な技術指標の組み合わせ分析に基づいています. 1. スーパートレンド指標は,動的トレンドライン調整のためのATR波動性を用いて,全体的なトレンド方向を決定する. 2. 短期 (9 期) と長期 (21 期) の EMA のクロスオーバーは,価格の動向の変化を把握する. 3. RSI インディケーターは,過剰購入または過剰販売の市場状況を特定します.
購入シグナルには次の条件がすべて必要です - スーパートレンドは上昇傾向を示しています (スーパートレンド線上の価格) - 短期EMAは長期EMAを上回る - RSIは過買いではない (70以下)
売り信号には次の条件がすべて必要です - スーパートレンドは下落傾向を示している (スーパートレンド線以下価格) - 短期EMAは長期EMAを下回る - RSIは過売れではない (30度以上)
戦略 の 利点
- 多指標のクロスバリダーションは信号の信頼性を向上させる
- トレンドフォローとモメント分析の利点を組み合わせます
- RSI は 潜在 的 な 誤り の 信号 を フィルタリング し て い ます
- 戦略パラメータは,異なる市場状況に柔軟に調整できます
- 明確な入国・退出規則は主観的な判断に影響を減らし
- 堅牢なリスク管理メカニズムを含んでいる
戦略リスク
- 異なる市場で頻繁に誤った信号を生む可能性があります
- 複数の指標の遅延は,エントリーと出路のタイミングを遅らせる可能性があります.
- 間違ったパラメータ選択は戦略のパフォーマンスに影響を与える
- 市場が急変すると,大幅な引き上げが起こり得る
- 戦略の収益性のために取引コストを考慮する必要がある
戦略の最適化方向
- 市場変動に基づいて指標パラメータを動的に調整するための適応パラメータメカニズムを導入する
- シグナル信頼性を高めるため,ボリューム価格分析指標を追加
- 市場環境認識モジュールを開発し,異なる市場条件で異なるパラメータの組み合わせを使用する
- 資金管理を最適化するために,ストップ・ロストと利益引き取りのメカニズムを導入する
- 低変動環境での過剰取引を避けるため,波動性フィルターを追加することを検討する.
概要
これは,トレンドフォロー,モメンタム分析,オーバーバイト/オーバーセール指標を組み合わせて包括的な取引システムを構築する,構造的で論理的に健全な多指標量的な取引戦略である.この戦略の強みは,シグナル信頼性の向上と明確なリスク管理メカニズムのための多指標クロスバリダーションにあります.固有のリスクが存在するものの,継続的な最適化と精製は,異なる市場環境で安定したパフォーマンスを維持するのに役立ちます.
/*backtest
start: 2019-12-23 08:00:00
end: 2024-12-09 08:00:00
period: 1d
basePeriod: 1d
exchanges: [{"eid":"Futures_Binance","currency":"BTC_USDT"}]
*/

// This Pine Script™ code is subject to the terms of the Mozilla Public License 2.0 at https://mozilla.org/MPL/2.0/
// © satyakipaul3744

//@version=6
//@version=6
strategy("Supertrend + EMA Crossover + RSI Strategy", overlay=true)

// --- Input Parameters ---
supertrend_length = input.int(10, title="Supertrend Length", minval=1)
supertrend_multiplier = input.float(3.0, title="Supertrend Multiplier", step=0.1)
short_ema_length = input.int(9, title="Short EMA Length")
long_ema_length = input.int(21, title="Long EMA Length")
rsi_length = input.int(14, title="RSI Length")
rsi_overbought = input.int(70, title="RSI Overbought Level")
rsi_oversold = input.int(30, title="RSI Oversold Level")

// --- Indicator Calculations ---
// Supertrend calculation
[supertrend, direction] = ta.supertrend(supertrend_multiplier, supertrend_length)

// EMA calculations
short_ema = ta.ema(close, short_ema_length)
long_ema = ta.ema(close, long_ema_length)

// RSI calculation
rsi = ta.rsi(close, rsi_length)

// --- Buy/Sell Conditions ---
// Buy condition: Supertrend bullish, EMA crossover, RSI not overbought
buy_condition = direction > 0 and ta.crossover(short_ema, long_ema) and rsi < rsi_overbought

// Sell condition: Supertrend bearish, EMA crossunder, RSI not oversold
sell_condition = direction < 0 and ta.crossunder(short_ema, long_ema) and rsi > rsi_oversold

// --- Plot Buy/Sell signals ---
plotshape(buy_condition, title="Buy Signal", location=location.belowbar, color=color.green, style=shape.labelup, text="BUY")
plotshape(sell_condition, title="Sell Signal", location=location.abovebar, color=color.red, style=shape.labeldown, text="SELL")

// --- Strategy Orders for Backtesting ---
if buy_condition
    strategy.entry("Buy", strategy.long)

if sell_condition
    strategy.close("Buy")

// --- Plot Supertrend ---
plot(supertrend, color=direction > 0 ? color.green : color.red, linewidth=2, title="Supertrend")

// --- Plot EMAs ---
plot(short_ema, color=color.blue, title="Short EMA")
plot(long_ema, color=color.orange, title="Long EMA")

// --- Strategy Performance ---
// You can see the strategy performance in the "Strategy Tester" tab.
- 複数の指標による変動取引のRSI-EMA-ATR戦略
- ATR波動性戦略を用いた多指標動的適応位置サイズ化
- 多期移動平均値とRSIトレンド取引戦略
- RSIモメントフィルタを搭載した戦略をフォローするマルチテクニカル指標傾向
- ゴールデン・モメント・キャプチャー・戦略: 多時間枠指数関数移動平均クロスオーバーシステム
- 高流動性通貨ペアの短期短期短期販売戦略
- 動的ATR目標を持つ多EMAトレンド戦略に従う
- 高周波ダイナミックマルチインジケータ移動平均クロスオーバー戦略
- 多期指数指数移動平均のクロスオーバー戦略とオプション取引提案システム
- リスク管理システム付きのマルチEMAトレンド・モメンタム・トレード戦略
- 複数の時間枠で動的ストップ・ロスのEMA・スクリーズ・トレーディング戦略
- MACDと線形回帰の二重信号インテリジェント取引戦略
- 取引戦略をフォローするマルチEMA傾向
- 多期調整されたハイキン・アシ・トレンド 定量取引システム
- 動的RSIオシレーター 多項式フィッティング指標 トレンド 定量取引戦略
- 日々の範囲のブレイク・シングルダイレクト・トレーディング・戦略
- SMA-RSI-MACD マルチインジケータ ダイナミック・リミット・オーダー・トレーディング・戦略
- EMA/SMA トレンドフォロー スウィング・トレーディング戦略 総量フィルターとパーセントのテイク・プロフィート/ストップ・ロース・システム
- VWAP 標準偏差 平均逆転取引戦略
- サポートとレジスタンスの量的なシステムに基づいたダイナミック価格ゾーンブレークアウト取引戦略
- リスクと報酬のターゲット戦略を備えた高度なダイナミックトレーリングストップ
- 先進的な長期のみ動的トレンドラインブレイク戦略
- Bollinger Bands と ATR に基づく多レベルインテリジェント・ダイナミック・トレリングストップ戦略
- ダイナミック・デュアル・EMA・クロスオーバー・ストラテジー
- Bollinger Bands と RSI の組み合わせたダイナミック・トレーディング・戦略
- RSI-ATR モメント・ボラティリティ コンビネード・トレーディング・ストラテジー
- 2つのEMAトレンドフォロー戦略と制限購入エントリー
- 多戦略技術分析取引システム
- 複数のタイムフレームを組み合わせたキャンドルスティックパターン認識取引戦略
- トリプル・ボリンガー・バンドは,定量的な取引戦略を踏まえて,トレンドに触れる.