1
フォロー
1627
フォロワー

概要
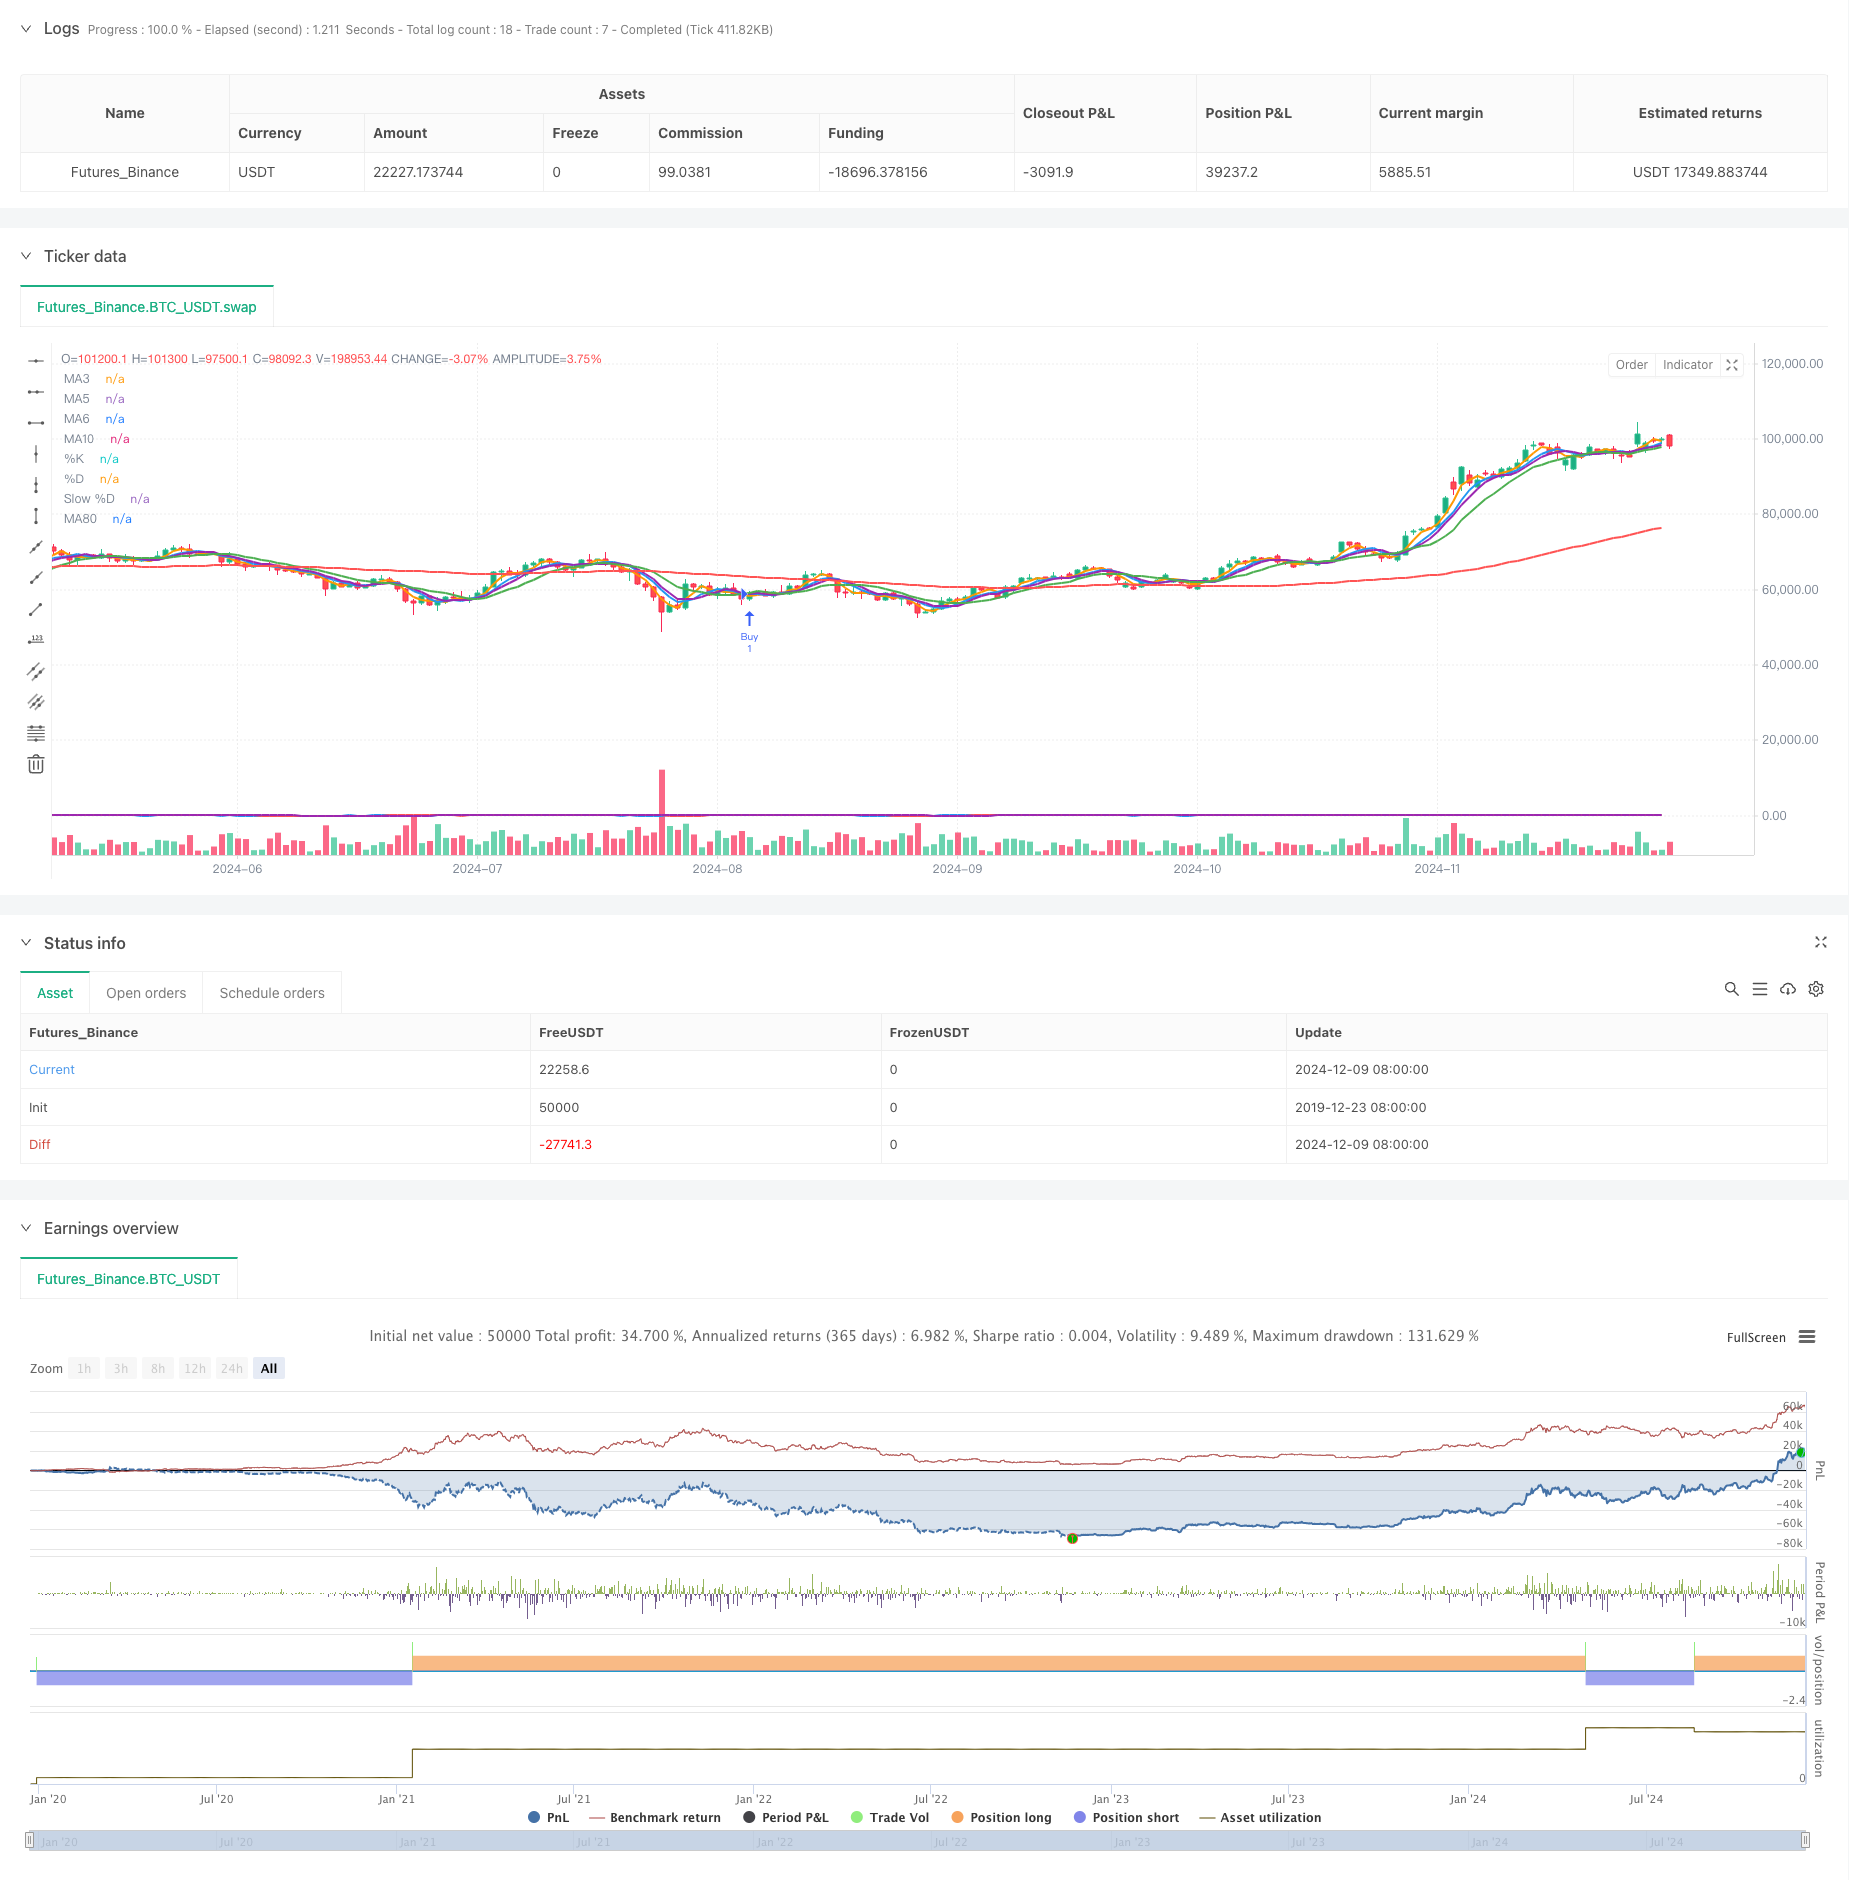
この戦略は,複数の移動平均とランダムな振動指標の交差信号に基づく量化取引戦略である.戦略は,短期,中期,および長期の移動平均を総合的に使用し,ランダムな振動指標の超買い超売り特性を組み合わせて,市場トレンドの転換点と取引機会を複数の信号確認によって捉える.戦略の核心は,複数の技術指標の交差確認によって取引信号の信頼性を向上させることにある.
戦略原則
この戦略は,5つの移動平均,3日目,5日目,6日目,10日目および80日目,およびランダムな振動指標であるストキャスティックオシレータを使用しています.取引シグナルのトリガーは以下の条件に基づいています.
- 買取信号:MA10上でMA5とMA6を穿い,同時にランダムな振動指標のK線でD線を穿いるときに触発する.
- 売出信号:MA5の下のMA10とMA6を通過し,同時にランダムな振動指標のD線の下のK線を通過するときに触発する. 策略は15周期の%K値と9周期の%D値を使用して,スライディング平均によってさらにシグナルを滑らかにする.
戦略的優位性
- 複数の確認メカニズム:複数の移動平均とランダムな振動指標のクロス確認により,偽突破のリスクを効果的に軽減します.
- トレンドトラッキングは,トレンドを捉えるだけでなく,超買超売の領域を特定し,取引の正確性を向上させます.
- 信号の安定性:複数の移動平均の交差確認により,市場のノイズをフィルターできます.
- 適応性:異なる市場環境と時間周期に適用できます.
戦略リスク
- 遅滞リスク:移動平均は本質的に遅滞の指標であり,入場と出場のタイミングをわずかに遅らせることが可能である.
- 不安定な市場のリスク: 横ばいで不安定な市場では、誤ったシグナルが頻繁に発生する可能性があります。
- パラメータの感受性:複数の指標のパラメータ設定は十分にテストされ,異なる市場環境により調整が必要となる.
- シグナル衝突:複数の指標が矛盾するシグナルを生じさせる可能性があるため,明確な優先順位の仕組みを確立する必要があります.
戦略最適化の方向性
- 動的パラメータ調整:市場の変動に応じて移動平均周期とランダムな振動器パラメータを自動的に調整できます.
- トレンドフィルターを追加:ADXなどのトレンド指標を導入し,強いトレンドの間,戦略パラメータを調整する.
- ストップ・メカニズムの最適化: 追跡ストップと固定ストップの組み合わせを追加する
- 交付量確認を追加:交付量指標を組み合わせて信号確認を行い,信頼性を高めます.
- 市場環境認識:市場環境判断モジュールを追加し,異なる市場条件で異なるパラメータ設定を使用する.
要約する
この戦略は,複数の移動平均とランダムな振動指標の組み合わせを用いて,比較的完ぺきな取引システムを構築している.この戦略の優位性は,信号の信頼性とシステムの安定性にあるが,取引コストと市場環境の適応性を制御することにも注意が必要である.この戦略は,継続的な最適化と改善によって,実際の取引で安定した収益を期待されている.
ストラテジーソースコード
/*backtest
start: 2019-12-23 08:00:00
end: 2024-12-10 08:00:00
period: 1d
basePeriod: 1d
exchanges: [{"eid":"Futures_Binance","currency":"BTC_USDT"}]
*/

//@version=5
strategy(title="Moving Average and Stochastic Crossover Strategy", overlay=true)

// Calculate the moving averages
ma3 = ta.sma(close, 3)
ma5 = ta.sma(close, 5)
ma6 = ta.sma(close, 6)
ma10 = ta.sma(close, 10)
ma80 = ta.sma(close, 80)

// Stochastic Oscillator with settings %K(15), %D(9), and slowing 9
k = ta.stoch(close, high, low, 15)
d = ta.sma(k, 9)
slow_d = ta.sma(d, 9)

// Buy signal confirmation: MA10 crosses above MA5, MA6, and K line crosses above D line
buySignalConfirmation = ta.crossover(ma10, ma5) and ta.crossover(ma10, ma6) and ta.crossover(k, d)

// Sell signal confirmation: MA5 crosses above MA10, MA6, and D line crosses above K line
sellSignalConfirmation = ta.crossunder(ma5, ma10) and ta.crossunder(ma5, ma6) and ta.crossunder(d, k)

// Strategy logic
if (buySignalConfirmation)
    strategy.entry("Buy", strategy.long)

if (sellSignalConfirmation)
    strategy.entry("Sell", strategy.short)

// Plot the moving averages and Stochastic Oscillator for visualization
plot(ma3, color=color.orange, title="MA3", linewidth=2)
plot(ma5, color=color.blue, title="MA5", linewidth=2)
plot(ma6, color=color.purple, title="MA6", linewidth=2)
plot(ma10, color=color.green, title="MA10", linewidth=2)
plot(ma80, color=color.red, title="MA80", linewidth=2)

plot(k, color=color.blue, title="%K", linewidth=2)
plot(d, color=color.red, title="%D", linewidth=2)
plot(slow_d, color=color.purple, title="Slow %D", linewidth=2)