RSIモメンタムとATR波動性に基づくトレンドを伴う多期EMAクロスオーバー
作者: リン・ハーンチャオチャン開催日:2024年12月13日 10:33:00タグ:RSIエイマATRTPSLATDC

概要
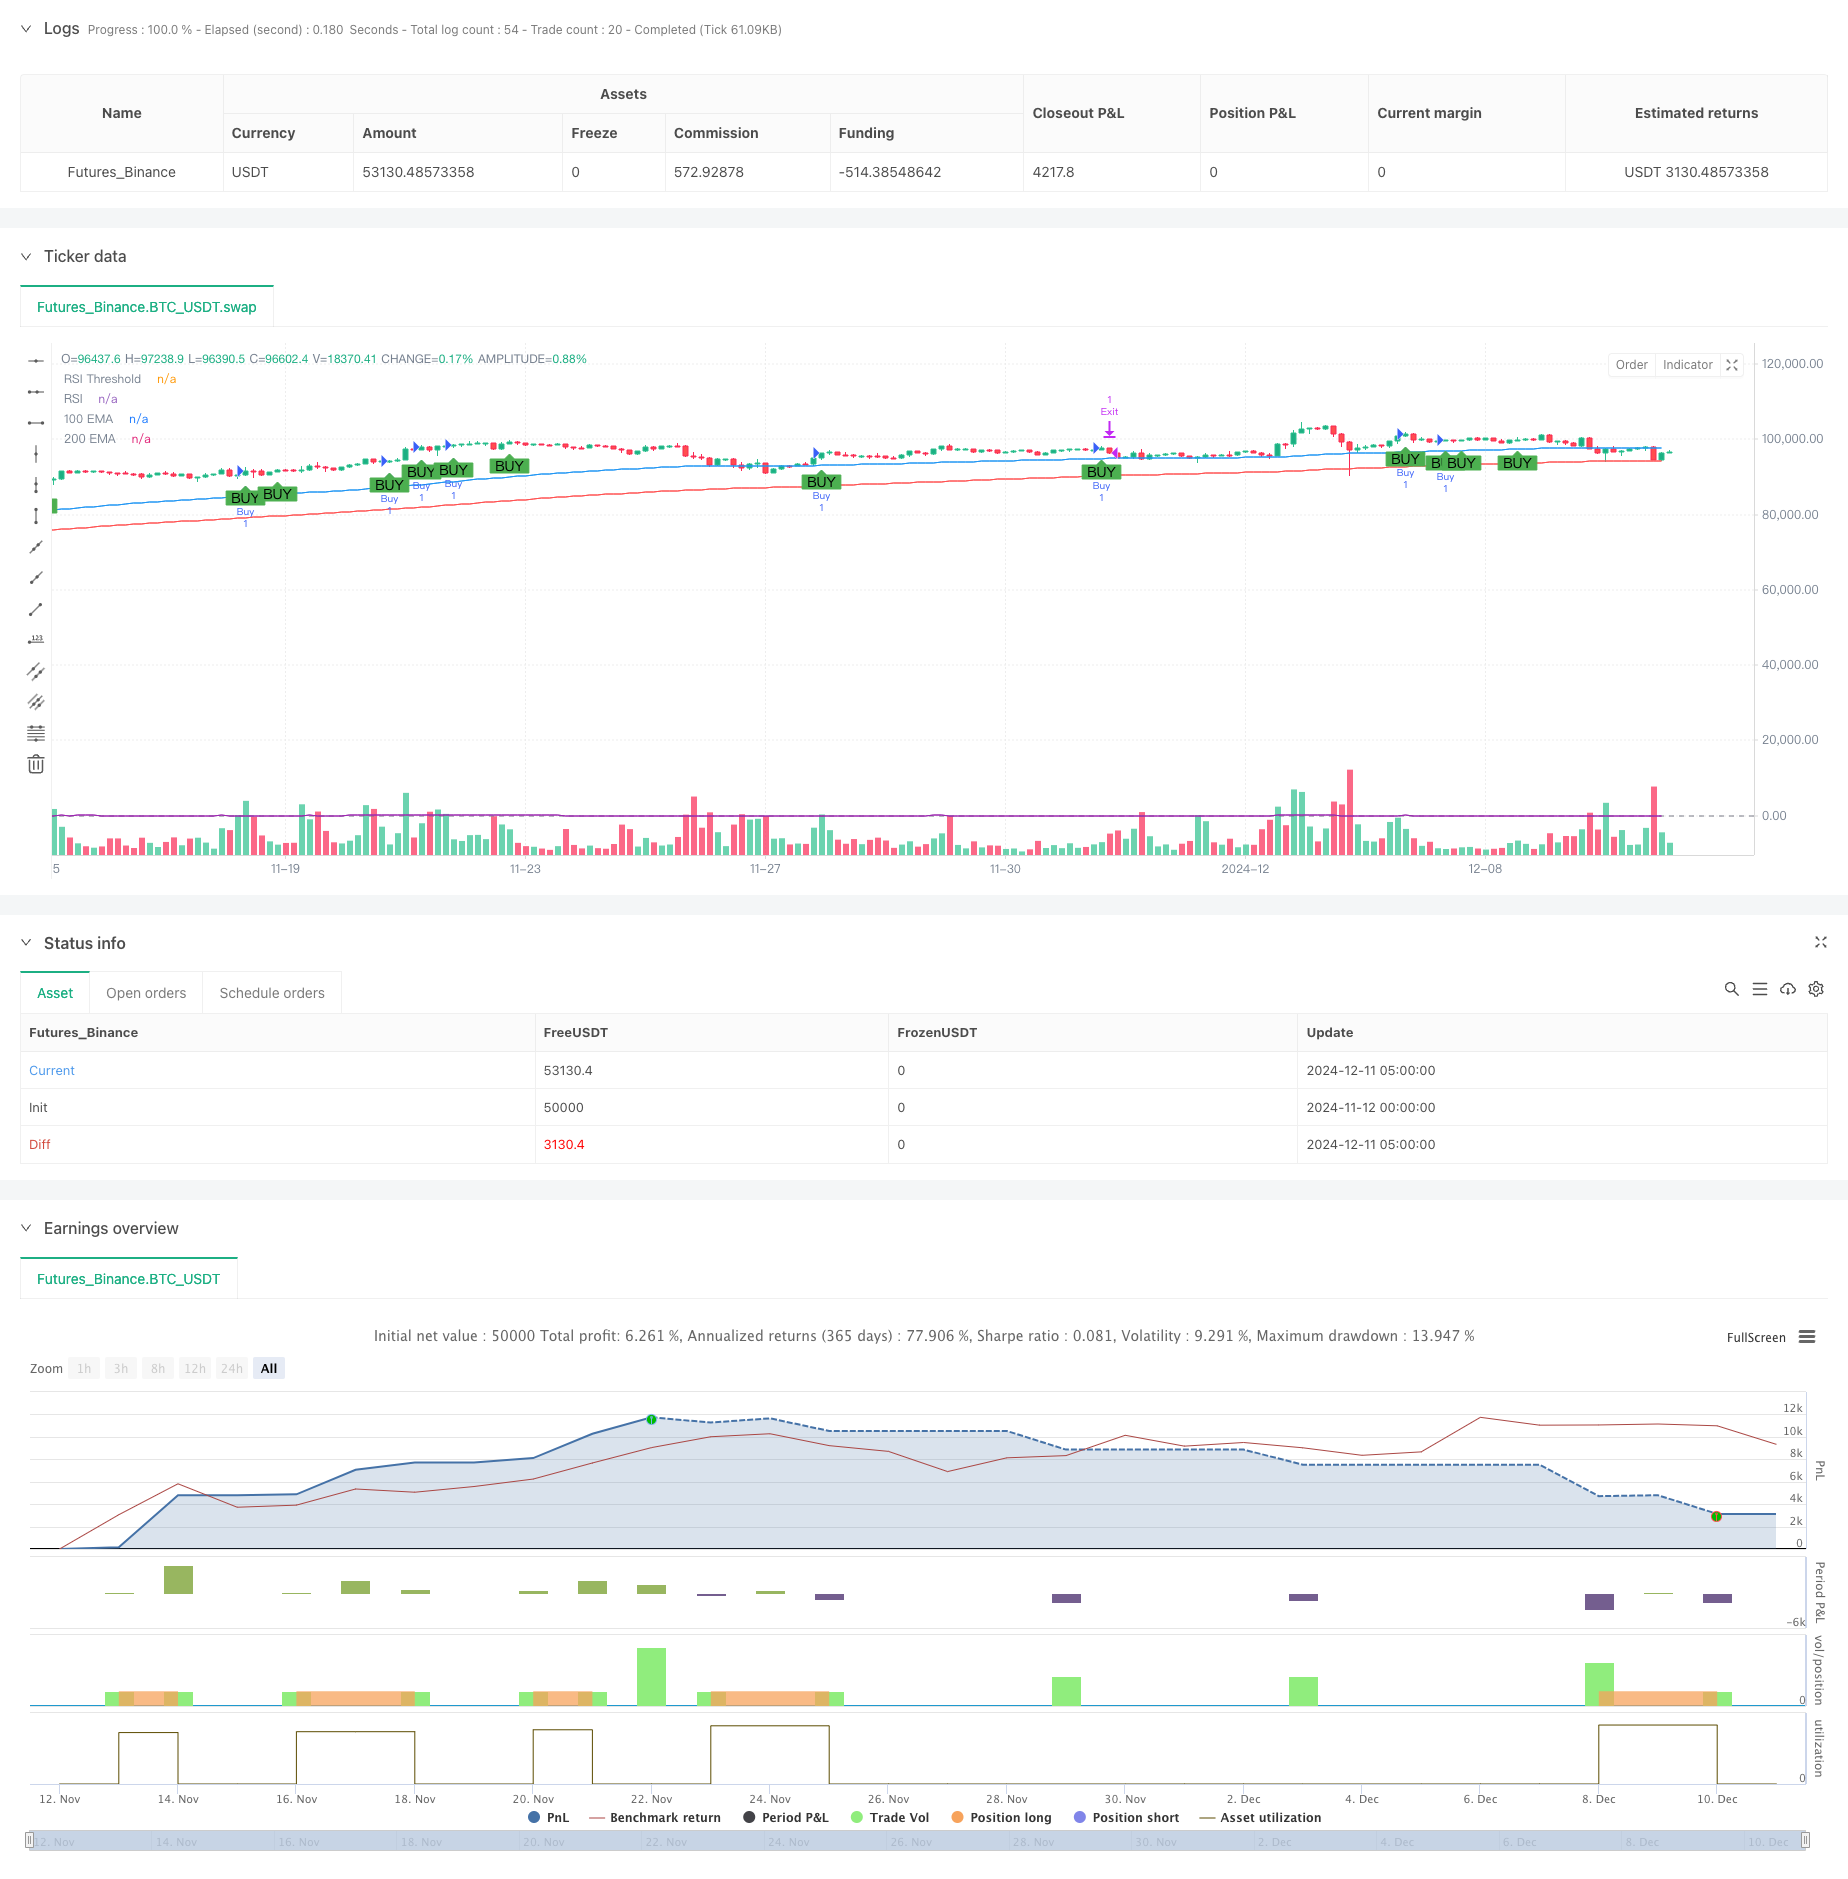
この戦略は,技術分析に基づいたトレンドフォローシステムで,移動平均値,RSIモメントインジケーター,およびATR波動性インジケーターを組み合わせて,複数のシグナル確認を通じて取引機会を検証する.この戦略は,多期移動平均値クロスオーバーを使用して市場のトレンドを決定し,RSIモメントを組み合わせて価格強さを確認し,最終的にATRを使用して,ストップ・ロストとテイク・プロフィートのレベルを動的に設定し,完全な取引システムを形成します.
戦略の原則
戦略の基本論理には,以下の3つの要素が含まれます. トレンド決定: 市場傾向の方向性を確認するために100期および200期指数関数移動平均 (EMA) のクロスオーバーを使用します.短期EMAが長期EMAよりも高くなった場合,上向きの市場傾向を示します. 2. エントリーシグナル: トレンド確認に基づいて,戦略は特定のエントリーポイントとして上昇傾向の格局を探し,シグナルフィルタリングのためにRSIインジケーターを使用します. RSI値が50を超えると,市場の十分な上昇勢いを示します. 3. ポジションマネジメント: 14 期間の ATR を使用して市場の変動を測定し,それに応じてストップ・ロストと利益レベルを動的に設定します.ストップ・ロスは ATR の 1.1 倍,利益目標は ATR の 2.0 倍に設定され,リスク・リターン比が 1 以上のことを保証します.
戦略 の 利点
- マルチプル・シグナル検証:トレンド,価格パターン,インパクト指標を組み合わせることで 誤ったシグナルの影響が著しく減少します
- ダイナミックリスク管理: ATR ベースのストップ・ロストと利益設定は,固定レベルの制限を避け,市場の変動に応じて適応的に調整できます.
- トレンドフォローする特徴: トレンドを判断するために移動平均システムを使用することで,横向または下向市場での不必要な取引を効果的に回避できます.
- 完全な取引枠組み: 入口,出口,ポジション管理をカバーする完全な戦略システムを含む.
戦略リスク
- トレンド遅延: EMA は遅れている指標として,迅速に変動する市場における最適なエントリーポイントを逃す可能性のある,エントリータイミングの遅延につながる可能性があります.
- 横向市場リスク:横向市場における移動平均の頻繁なクロスオーバーは,過剰取引につながる可能性があります.
- 誤ったブレイクリスク:上昇傾向の格好は誤ったブレイクを引き起こす可能性があるため,厳格なリスク管理が必要である.
- ストップ・ロスの設定リスク: ATR 増倍数が小さすぎる場合,ストップ・ロスは頻繁になり,増倍数が大きすぎる場合,リスクは過度に高い場合がある.
戦略の最適化方向
- ボリュームインディケーターを導入: ボリューム確認を追加することで信号の信頼性を向上させることができます.
- 移動平均期を最適化: 移動平均期を異なる市場特性に合わせて調整し,市場のリズムにより良く適応することができます.
- ストップ・ロスのメカニズムを改善する:トレンド継続中に利益を保護するためにトラッキング・ストップを追加することを検討する.
- 市場環境フィルタリングを追加: 変動範囲判断を導入し,過度に変動する市場環境での取引頻度を減らす.
- RSI パラメータを最適化: 過去データバックテストを通じて最適なRSIの
値と計算期間を探ることができます.
概要
この戦略は,複数の技術指標を統合することで,論理的に完全なトレンドフォローシステムを構築する.この戦略の利点は複数の信号の検証とダイナミックなリスク管理にありますが,トレンド遅延や偽のブレイクを扱うことに注意を払う必要があります.ボリューム確認を追加し,パラメータ設定を最適化することで,この戦略にはまだ改善の余地があります.全体的に,この戦略は明らかにトレンドしている市場で動作するのに適しており,中長期のトレンドを追跡するための良いアプリケーション価値があります.
/*backtest
start: 2024-11-12 00:00:00
end: 2024-12-11 08:00:00
period: 3h
basePeriod: 3h
exchanges: [{"eid":"Futures_Binance","currency":"BTC_USDT"}]
*/

//@version=5
strategy("Bullish Engulfing with EMA Crossover and ATR-Based SL/TP with RSI Filter", overlay=true)

// Inputs for moving averages
short_ema_length = input.int(100, title="Short EMA Length")
long_ema_length = input.int(200, title="Long EMA Length")

// RSI Input
rsi_length = input.int(14, title="RSI Length")
rsi_threshold = input.float(50, title="RSI Threshold")

// Calculate the Exponential Moving Averages (EMAs)
short_ema = ta.ema(close, short_ema_length)
long_ema = ta.ema(close, long_ema_length)

// Plot EMAs on the chart
plot(short_ema, color=color.blue, title="100 EMA")
plot(long_ema, color=color.red, title="200 EMA")

// Calculate RSI
rsi_value = ta.rsi(close, rsi_length)

// Plot RSI on a separate panel
hline(rsi_threshold, "RSI Threshold", color=color.gray)
plot(rsi_value, color=color.purple, title="RSI")

// Bullish Engulfing Pattern
bullish_engulfing = close > open[1] and open < close[1] and close > open

// Define strategy entry condition with RSI filter
long_condition = bullish_engulfing and short_ema > long_ema and rsi_value > rsi_threshold

// Plot a buy signal when conditions are met
plotshape(long_condition, style=shape.labelup, location=location.belowbar, color=color.green, title="Buy Signal", text="BUY")

// ATR Calculation
atr_length = input.int(14, title="ATR Length")
atr_value = ta.atr(atr_length)

// Define Stop Loss and Take Profit as levels
stop_loss_level = 1.1 * atr_value
take_profit_level = 2.0 * atr_value

// Execute Strategy Entry
if (long_condition)
    strategy.entry("Buy", strategy.long)

// Adjust SL and TP levels using the entry price
if (strategy.position_size > 0)
    // Calculate SL and TP relative to the entry price
    stop_price = strategy.position_avg_price - stop_loss_level
    limit_price = strategy.position_avg_price + take_profit_level

    // Exit strategy with SL and TP
    strategy.exit("Exit", from_entry="Buy", stop=stop_price, limit=limit_price)
- 動的ロング/ショート・スウィング・トレーディング・ストラテジー
- 多技術指標に基づく高周波ダイナミック最適化戦略
- ATRとMACD統合付きの多期トレンドフォロー・トレード・システム
- 複数の確認を伴う戦略に従う多面滑らかな移動平均動的クロスオーバー傾向
- 多次元ゴールド金曜日の異常戦略分析システム
- 量に基づくダイナミックDCA戦略
- 多レベル多期EMAクロスオーバー ダイナミック・テイク・プロフィート最適化戦略
- スーパートレンドとEMAを組み合わせる戦略をフォローするダイナミックトレンド
- RSIモメンタム強化取引戦略とダブルEMAクロスオーバー
- ポジションスケーリングによるマルチRSI-EMAモメントヘッジ戦略
- MACD-ATRの実装による強化された平均逆転戦略
- 定量的な取引信号追跡とマルチエグジット戦略最適化システム
- ダイナミック・テイク・プロフィート・スマート・トレーディング・システム
- トリプルスタンダードデバイエーション ボリンガー帯 100日移動平均最適化によるブレイクアウト戦略
- ダイナミック・EMAトレンド・クロスオーバー・エントリー 定量戦略
- 多波動トレンド交差リスク管理量的な戦略
- 取引戦略をフォローする双 EMA ストカスティックトレンド
- 多期移動平均のクロスオーバー戦略をフォローするダイナミックな傾向
- 二重モメンタム突破確認量的な取引戦略
- MACD-RSI トレンド・モメンタム・クロス戦略とリスクマネジメントモデル
- 賢明なリスク・リターン制御の EMA 相互運用戦略
- 戦略をフォローする多動平均傾向 - EMAとSMA指標に基づく長期投資シグナルシステム
- 戦略をフォローする月間移動平均フィルタートレンドと歴史的な高い突破
- 多均衡価格動向の追跡と逆転取引戦略
- 動的波動性指数 (VIDYA) とATRトレンドフォロディング逆転戦略
- RSI,MACDおよびボリュームに基づく多指標適応型取引戦略
- 価格パターンに基づくダブルボトムとトップ自動取引戦略
- サポートブレイクに基づく戦略をフォローする動的ATR傾向
- 複数の移動平均値とストカスティックオシレータークロスオーバーの定量戦略
- アダプティブ・トレンドフォローと逆転検出戦略:ジグザグとアロン指標に基づく定量取引システム