概要
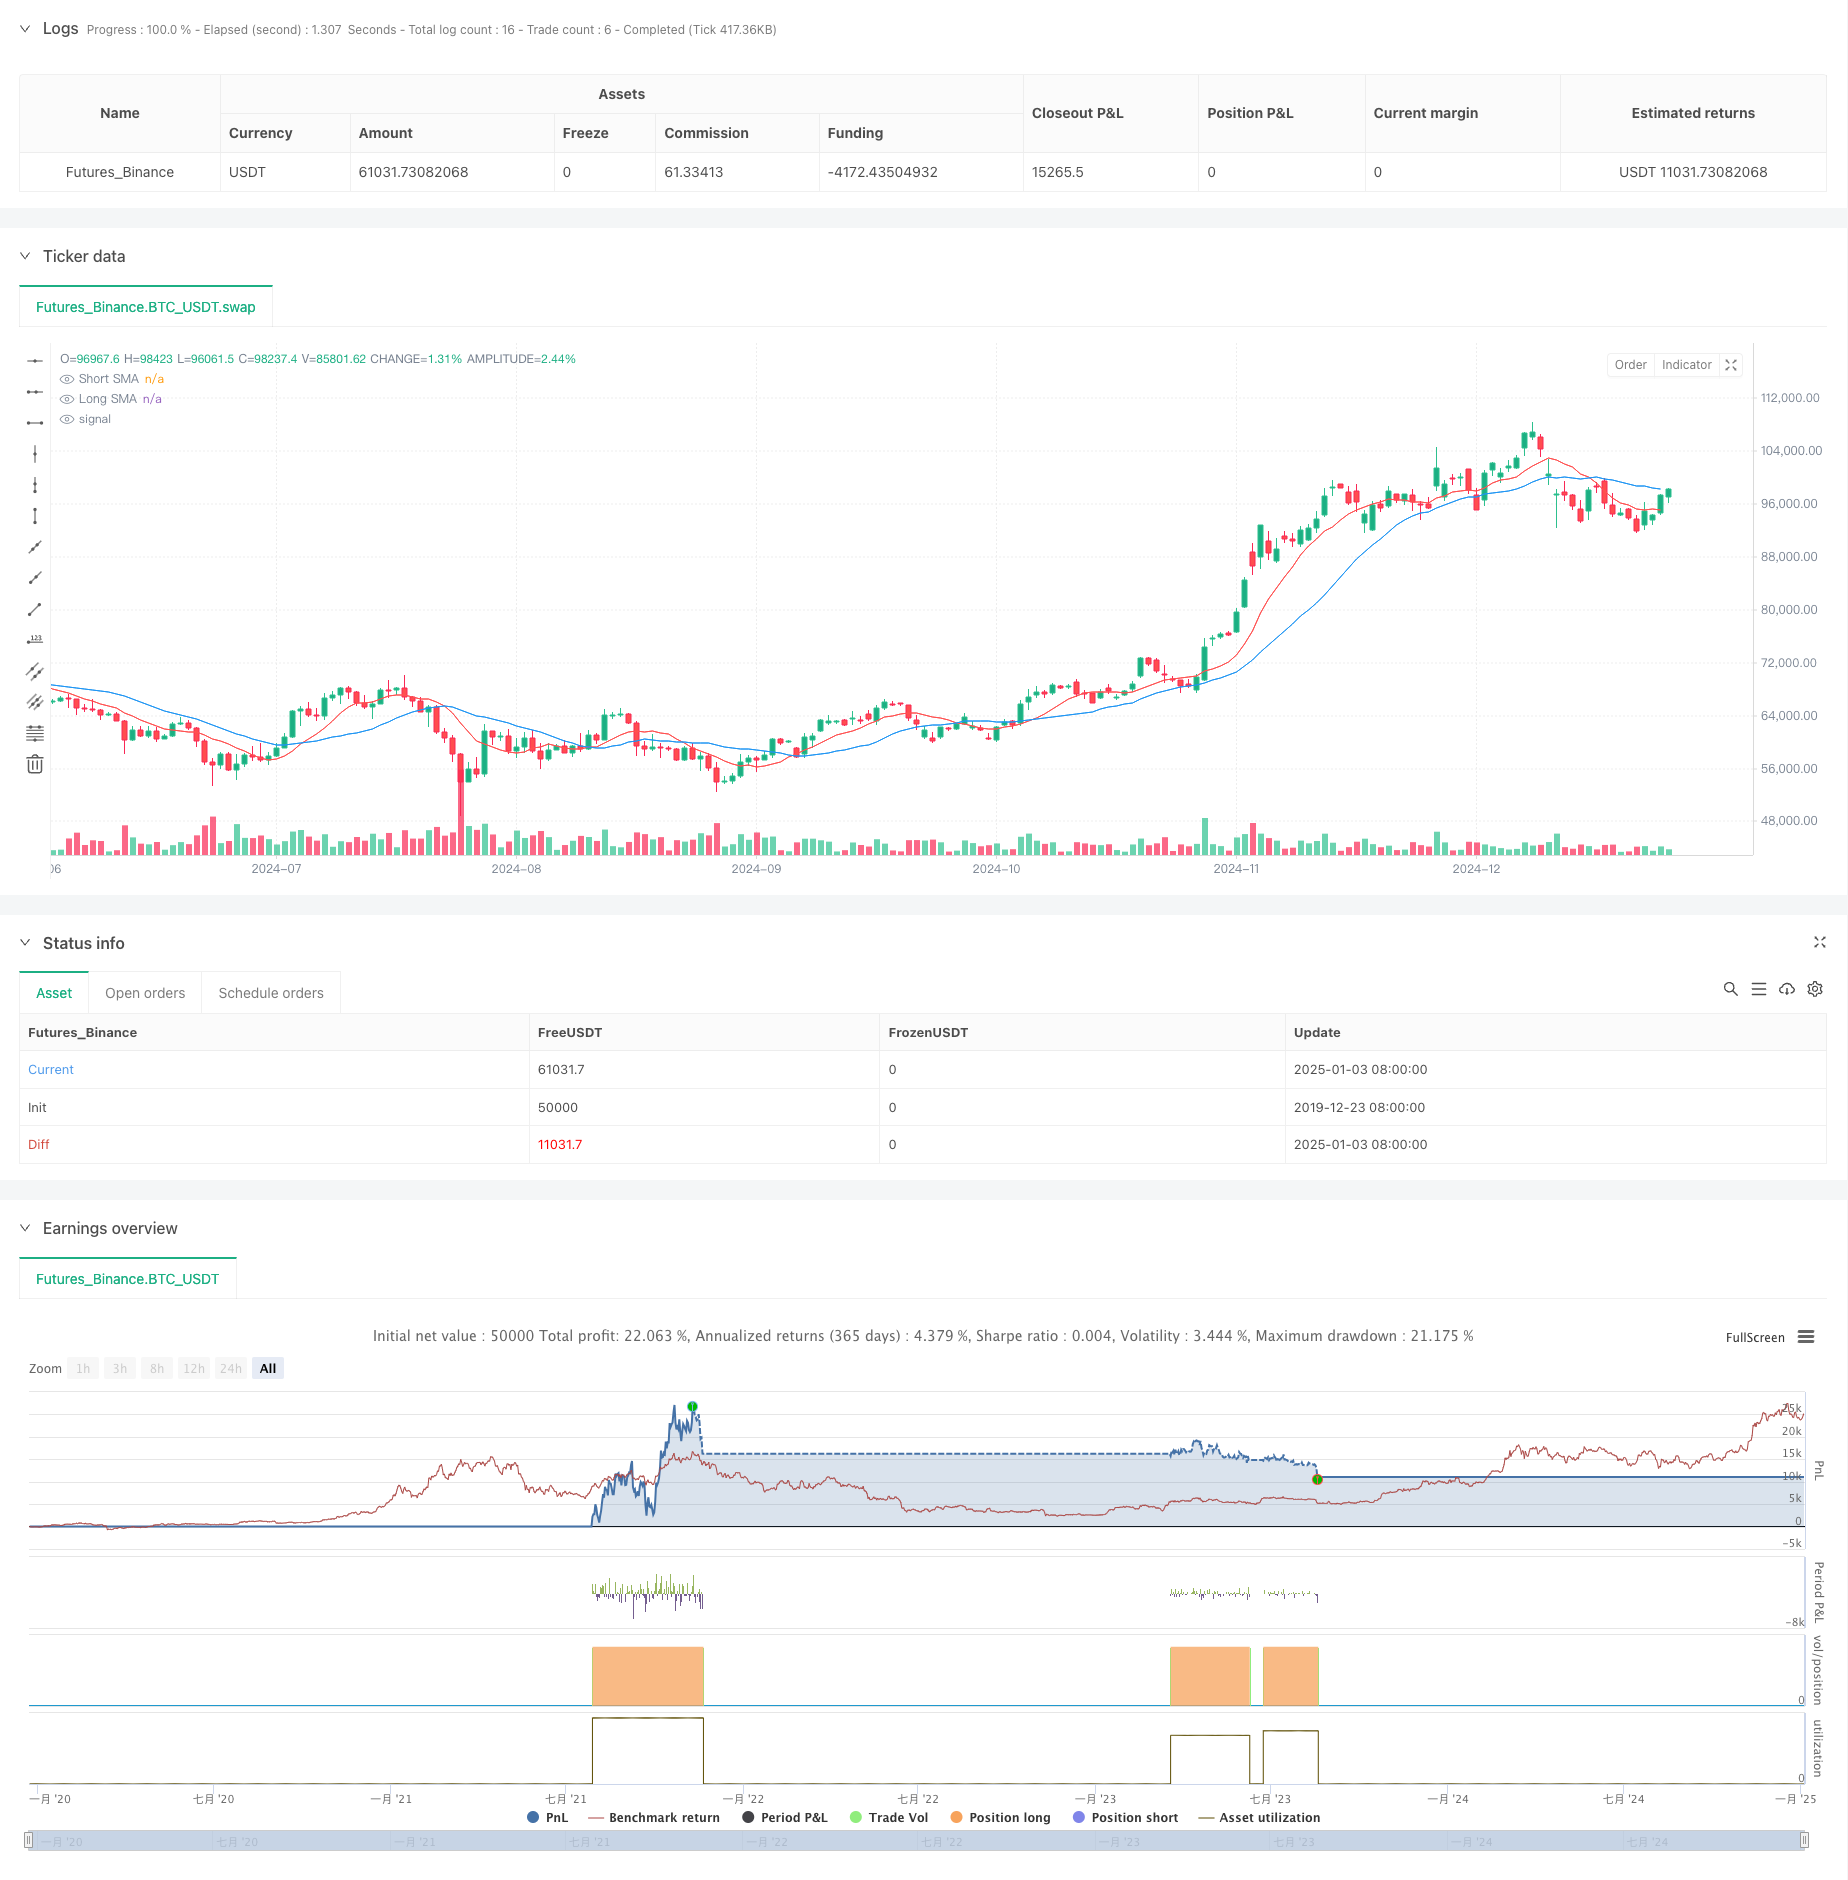
この戦略は、移動平均 (MA)、ボリューム (Volume)、ボラティリティ (ATR) の 3 つの次元からの市場シグナルを組み合わせた、複数のテクニカル指標に基づくインテリジェントな取引システムです。ボラティリティを包括的に分析して、市場の機会を捉えます。この戦略では、トレンドを判断する主な基準として二重移動平均システムを使用し、取引量とボラティリティを取引フィルター条件として導入することで、取引シグナルの複数の検証を実現します。
戦略原則
戦略の中核となるロジックは、次の 3 つの次元に基づいています。
- トレンドの次元: 9 日間および 21 日間の単純移動平均 (SMA) を使用して二重移動平均システムを構築し、ゴールデン クロスとデッド クロスを通じてトレンドの方向を決定します。
- ボリュームディメンション: 21 日間の平均ボリュームを計算します。十分な市場流動性を確保するには、現在のボリュームが平均の 1.5 倍である必要があります。
- ボラティリティの次元: 14 日間の ATR は市場のボラティリティを測定するために使用され、価格変動に十分な余地を確保するには、現在のボラティリティが平均よりも高いことが必要です。
この戦略は、これら 3 つの側面の条件が同時に満たされた場合にのみ取引シグナルを発行します。この多重フィルタリングメカニズムにより、トランザクションの精度が効果的に向上します。
戦略的優位性
- 高いシグナル信頼性: 複数のテクニカル指標の相互検証により、誤ったブレイクスルーの可能性が大幅に減少します。
- 強力な適応性: 戦略パラメータはさまざまな市場環境に応じて柔軟に調整でき、優れた汎用性を備えています。
- 完璧なリスク管理: ボラティリティと取引量の二重フィルタリングにより、取引リスクが効果的に管理されます。
- 明確な実行ロジック: 戦略ロジックはシンプルで直感的であり、理解しやすく、維持しやすいです。
- 高度な自動化: 完全なシグナル生成とアラーム メカニズムを備え、自動取引をサポートします。
戦略リスク
- 遅延リスク: 移動平均には一定の遅延があり、エントリーに若干の遅れが生じる可能性があります。
- 不安定な市場のリスク: 横ばいで不安定な市場では、誤ったシグナルが頻繁に発生する可能性があります。
- パラメータの感度: 戦略の有効性はパラメータ設定に敏感であり、異なる市場環境ではパラメータを調整する必要がある場合があります。
- 流動性リスク: 取引量が少ない市場では、取引条件を満たすことが困難になる可能性があります。
戦略最適化の方向性
- トレンド強度インジケーターの導入: トレンドの強度を評価し、トレンド判断の精度を向上させるために、ADX または DMI インジケーターの追加を検討します。
- ストップロス メカニズムの最適化: リスク管理の柔軟性を向上させるために、ATR に基づく動的ストップロス メカニズムを追加することをお勧めします。
- シグナル フィルタリングの改善: RSI などのインジケーターを導入して判断を支援し、誤ったシグナルを減らすことができます。
- ポジション管理の強化:ボラティリティに応じてポジションサイズを動的に調整し、資金管理を最適化することをお勧めします。
- 市場センチメント要因: 市場環境への戦略の適応性を向上させるために、市場センチメント指標の導入を検討します。
要約する
この戦略は、複数のテクニカル指標の共同分析を通じて完全な取引意思決定システムを構築します。戦略設計はトレンド、流動性、ボラティリティなどの市場特性を十分に考慮しており、実用性と信頼性に優れています。この戦略は継続的な最適化と改善を通じて、さまざまな市場環境において安定したパフォーマンスを維持することが期待されます。戦略のモジュール設計は、その後の拡張のための優れた基盤も提供し、実際のニーズに応じて柔軟に調整および最適化できます。
ストラテジーソースコード
/*backtest
start: 2019-12-23 08:00:00
end: 2025-01-04 08:00:00
period: 1d
basePeriod: 1d
exchanges: [{"eid":"Futures_Binance","currency":"BTC_USDT"}]
*/

//@version=5
strategy("Advanced Trading Strategy", overlay=true)

// Parâmetros de entrada
shortPeriod = input.int(9, title="Short Period", minval=1)
longPeriod = input.int(21, title="Long Period", minval=1)
volumeThreshold = input.float(1.5, title="Volume Threshold Multiplier", minval=0.1)
volatilityPeriod = input.int(14, title="Volatility Period", minval=1)

// Cálculo das médias móveis
shortSMA = ta.sma(close, shortPeriod)
longSMA = ta.sma(close, longPeriod)

// Cálculo do volume médio
averageVolume = ta.sma(volume, longPeriod)

// Cálculo da volatilidade (ATR - Average True Range)
volatility = ta.atr(volatilityPeriod)

// Condições de compra e venda baseadas em médias móveis
maBuyCondition = ta.crossover(shortSMA, longSMA)
maSellCondition = ta.crossunder(shortSMA, longSMA)

// Verificação do volume
volumeCondition = volume > averageVolume * volumeThreshold

// Condição de volatilidade (volatilidade acima de um certo nível)
volatilityCondition = volatility > ta.sma(volatility, volatilityPeriod)

// Condições finais de compra e venda
buyCondition = maBuyCondition and volumeCondition and volatilityCondition
sellCondition = maSellCondition and volumeCondition and volatilityCondition

// Plotando as médias móveis
plot(shortSMA, title="Short SMA", color=color.red)
plot(longSMA, title="Long SMA", color=color.blue)

// Sinal de compra
if (buyCondition)
    strategy.entry("Buy", strategy.long)

// Sinal de venda
if (sellCondition)
    strategy.close("Buy")

// Plotando sinais no gráfico
plotshape(series=buyCondition, title="Buy Signal", location=location.belowbar, color=color.green, style=shape.labelup, text="BUY")
plotshape(series=sellCondition, title="Sell Signal", location=location.abovebar, color=color.red, style=shape.labeldown, text="SELL")

// Configurando alertas
alertcondition(buyCondition, title="Buy Alert", message="Buy Signal Triggered")
alertcondition(sellCondition, title="Sell Alert", message="Sell Signal Triggered")