概要
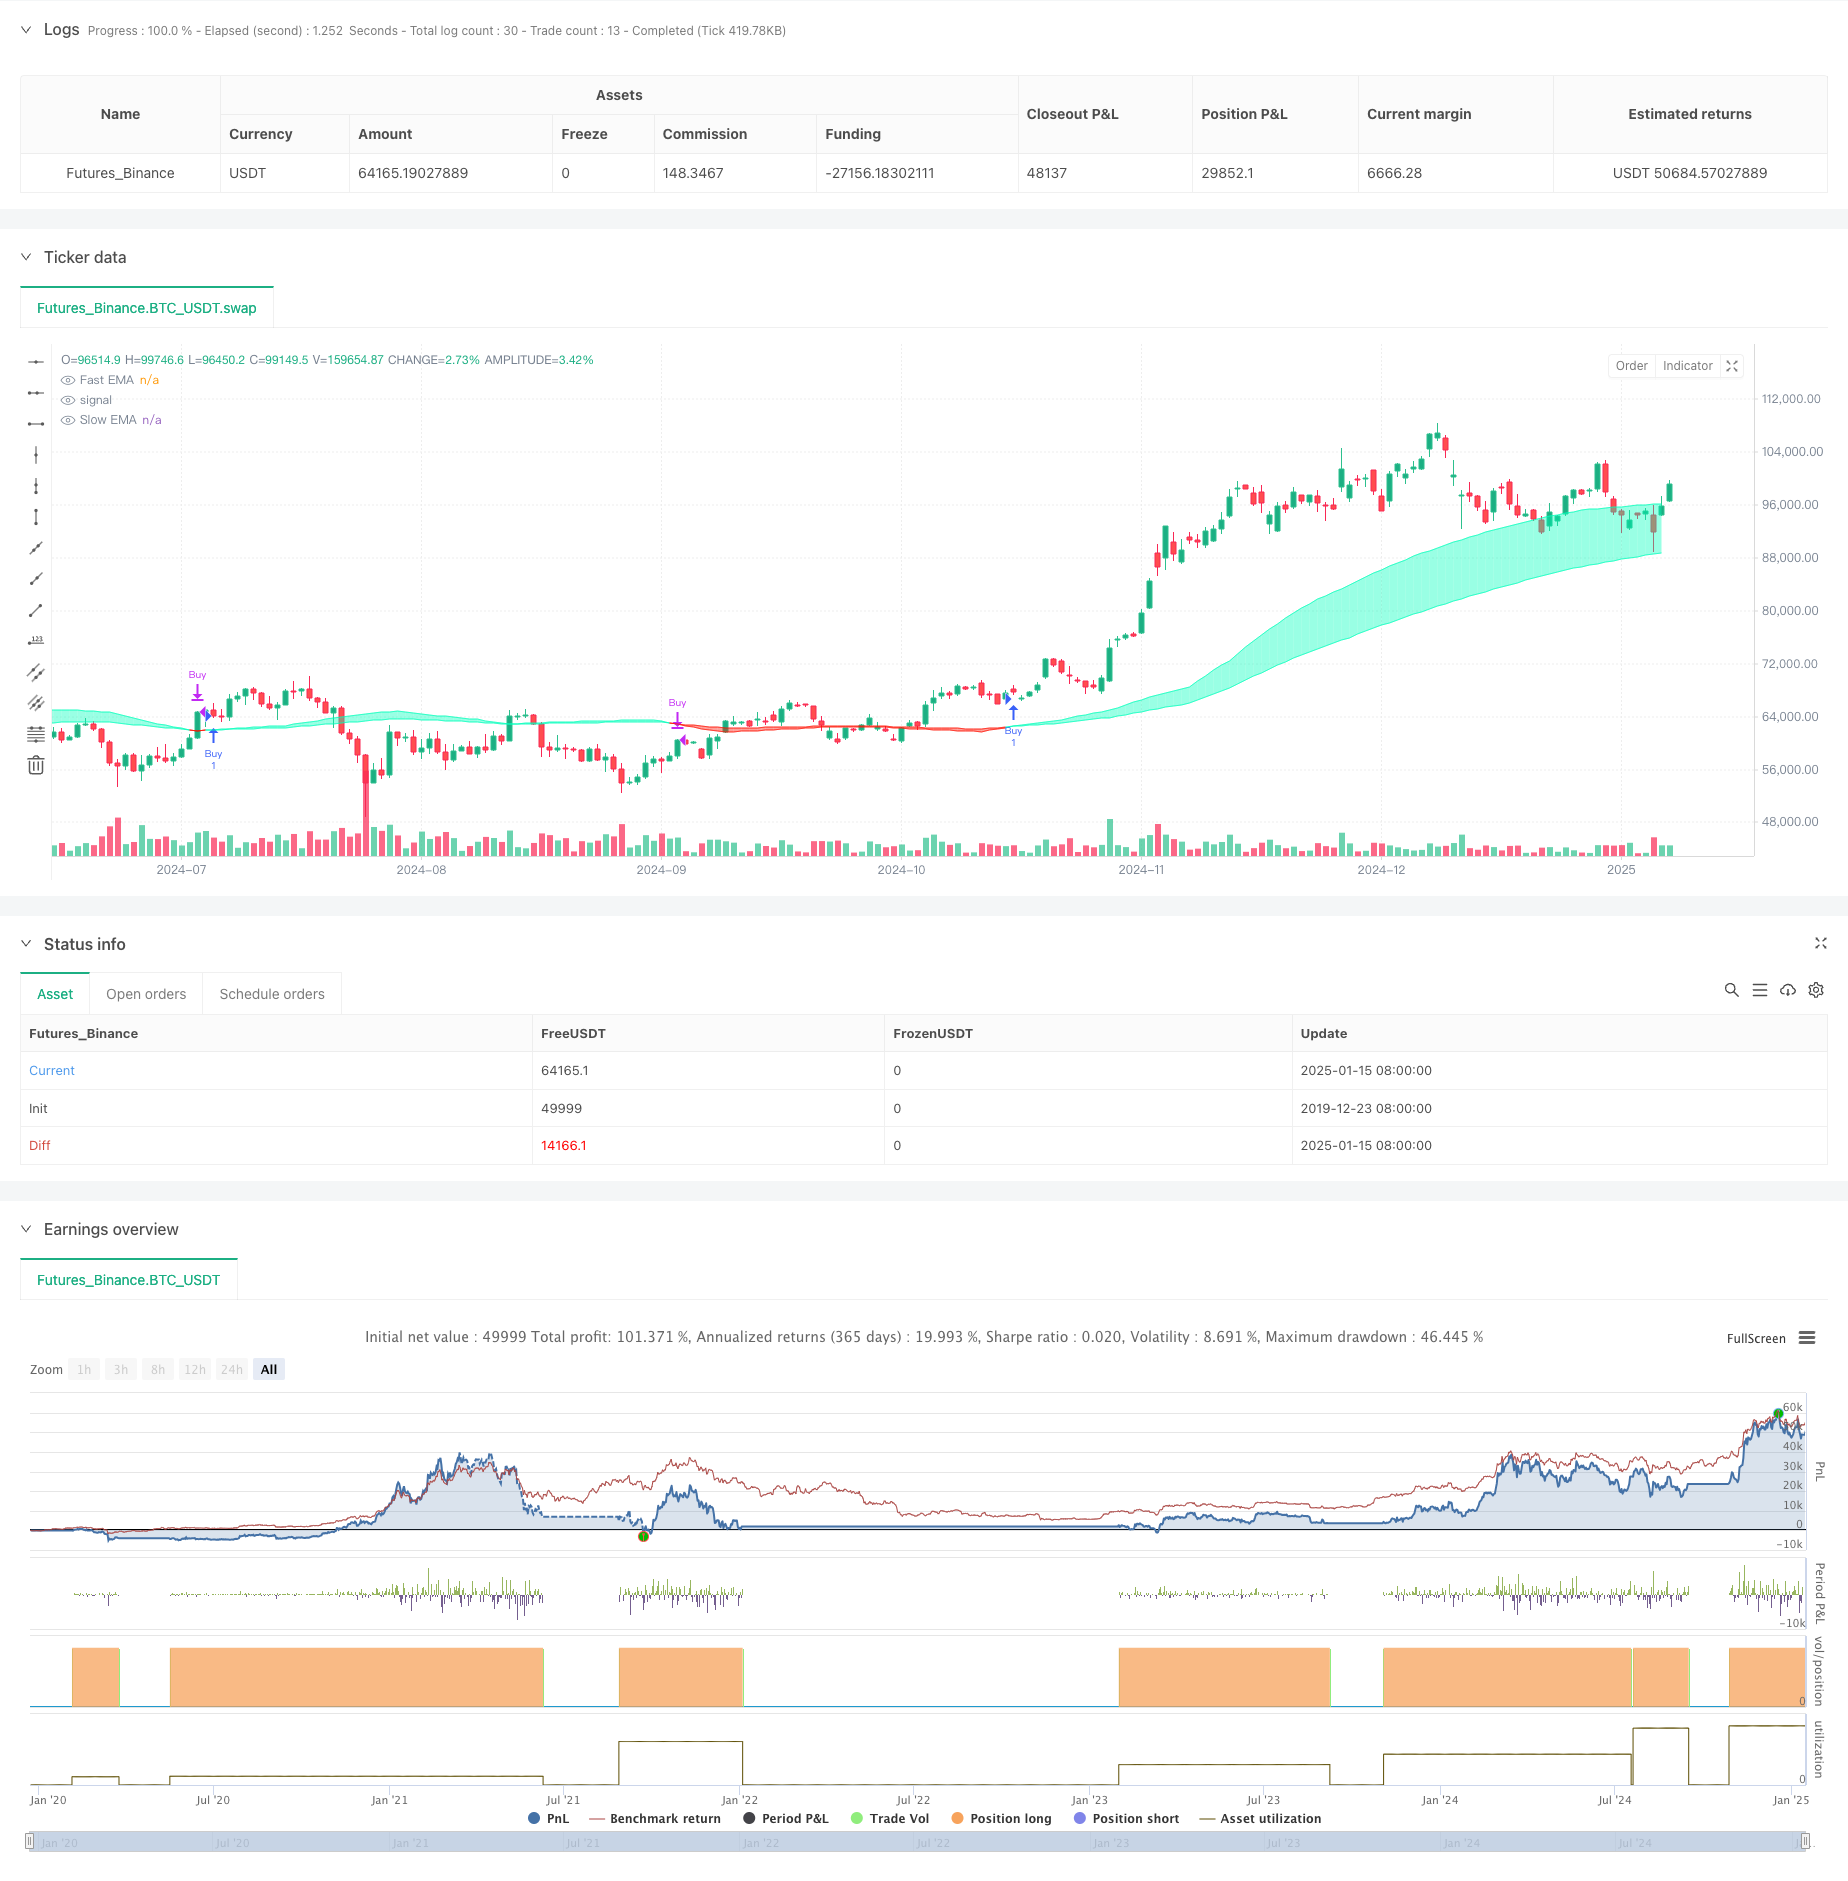
この戦略は、流動性加重移動平均に基づいた取引システムです。価格変動と取引量の関係を監視することで市場の流動性を測定し、これに基づいて高速移動平均と低速移動平均を構築します。高速ラインが低速ラインを上回ったときに買いシグナルが生成され、低速ラインを下回ったときに売りシグナルが生成されます。この戦略は、異常な流動性イベントに特別な注意を払い、配列を通じて重要な価格ポイントを記録するため、より正確な取引機会が提供されます。
戦略原則
この戦略の中核は、取引量と価格変動の比率を通じて市場の流動性を測定することです。具体的な実装手順は次のとおりです。
- 流動性指標を計算する:終値と始値の差の絶対値で割ったボリュームを使用する
- 流動性の境界を設定する: EMA と標準偏差による異常な流動性の特定
- 価格配列を維持する: 流動性境界を突破したときの価格を記録する
- 移動平均線の構築: 流動性イベントに基づく高速 EMA と低速 EMA の計算
- 取引シグナルを生成する: 移動平均線のクロスオーバーを通じて買いポイントと売りポイントを決定する
戦略的優位性
- 流動性の認識: 取引量と価格変動を組み合わせることで、市場の活動をより正確に把握できます。
- 異常イベントの追跡: 重要な市場機会を逃さないように、配列を通じて主要な価格ポイントを記録します。
- 動的適応: EMAの重み付け軽減機能により、戦略は市場の変化に適応しやすくなります。
- リスク管理: 移動平均クロスオーバーを通じて明確なエントリーとエグジットのシグナルを提供する
- カスタマイズ性: さまざまな市場環境に適応するために複数のパラメータを調整できます。
戦略リスク
- パラメータ感度: 戦略の効果はパラメータ設定に大きく依存し、継続的に最適化する必要がある。
- 遅延: 移動平均に基づくシステムには、固有の遅延がある
- 市場依存性: 特定の期間および市場におけるパフォーマンスの変動
- 偽のブレイクアウト: ボラティリティが高い時期に偽のシグナルを生成する可能性がある
- 取引コスト: 取引が頻繁に行われるとコストが高くなる可能性がある
戦略最適化の方向性
- フィルターを導入します:
- ADXなどのトレンド確認インジケーターを追加する
- ボラティリティ指標を使用して誤ったシグナルを除外する
- エントリータイミングの改善:
- サポートレベルとレジスタンスレベルの組み合わせ
- ボリュームブレイクアウトの確認を検討する
- 最適化パラメータの選択:
- 適応パラメータの実装
- 市場状況に応じた動的な調整
- 強化されたリスク管理:
- ストップロスとテイクプロフィットのメカニズムを追加する
- 倉庫管理システムの導入
要約する
これは、流動性分析とテクニカル指標を組み合わせた革新的な戦略であり、市場の流動性の異常を監視することで従来の移動平均クロスオーバー システムを最適化するものです。特定の市場環境では良好なパフォーマンスを発揮しますが、安定性と適用性を向上させるには、さらに最適化が必要です。トレーダーはリアルタイムで使用する前に十分なテストを実施し、他のインジケーターと組み合わせてより完全な取引システムを構築することをお勧めします。
ストラテジーソースコード
/*backtest
start: 2019-12-23 08:00:00
end: 2025-01-16 00:00:00
period: 1d
basePeriod: 1d
exchanges: [{"eid":"Futures_Binance","currency":"BTC_USDT","balance":49999}]
*/

//Liquidity ignoring price location

//@version=6
strategy("Liquidity Weighted Moving Averages [AlgoAlpha]", overlay=true, commission_type=strategy.commission.percent, commission_value=0.1, slippage=3)

// Inputs
outlierThreshold = input.int(10, "Outlier Threshold Length")
fastMovingAverageLength = input.int(50, "Fast MA Length")
slowMovingAverageLength = input.int(100, "Slow MA Length")
start_date = input(timestamp("2018-01-01 00:00"), title="Start Date")
end_date = input(timestamp("2069-12-31 23:59"), title="End Date")

// Define liquidity based on volume and price movement
priceMovementLiquidity = volume / math.abs(close - open)

// Calculate the boundary for liquidity to identify outliers
liquidityBoundary = ta.ema(priceMovementLiquidity, outlierThreshold) + ta.stdev(priceMovementLiquidity, outlierThreshold)

// Initialize an array to store liquidity values when they cross the boundary
var liquidityValues = array.new_float(5)

// Check if the liquidity crosses above the boundary and update the array
if ta.crossover(priceMovementLiquidity, liquidityBoundary)
    array.insert(liquidityValues, 0, close)
    if array.size(liquidityValues) > 5
        array.pop(liquidityValues)

// Calculate the Exponential Moving Averages for the close price at the last liquidity crossover
fastEMA = ta.ema(array.size(liquidityValues) > 0 ? array.get(liquidityValues, 0) : na, fastMovingAverageLength)
slowEMA = ta.ema(array.size(liquidityValues) > 0 ? array.get(liquidityValues, 0) : na, slowMovingAverageLength)

// Trading Logic
in_date_range = true
buy_signal = ta.crossover(fastEMA, slowEMA) and in_date_range
sell_signal = ta.crossunder(fastEMA, slowEMA) and in_date_range

// Strategy Entry and Exit
if (buy_signal)
    strategy.entry("Buy", strategy.long)

if (sell_signal)
    strategy.close("Buy")

// Plotting
fastPlot = plot(fastEMA, color=fastEMA > slowEMA ? color.new(#00ffbb, 50) : color.new(#ff1100, 50), title="Fast EMA")
slowPlot = plot(slowEMA, color=fastEMA > slowEMA ? color.new(#00ffbb, 50) : color.new(#ff1100, 50), title="Slow EMA")

// Create a fill between the fast and slow EMA plots with appropriate color based on crossover
fill(fastPlot, slowPlot, fastEMA > slowEMA ? color.new(#00ffbb, 50) : color.new(#ff1100, 50))