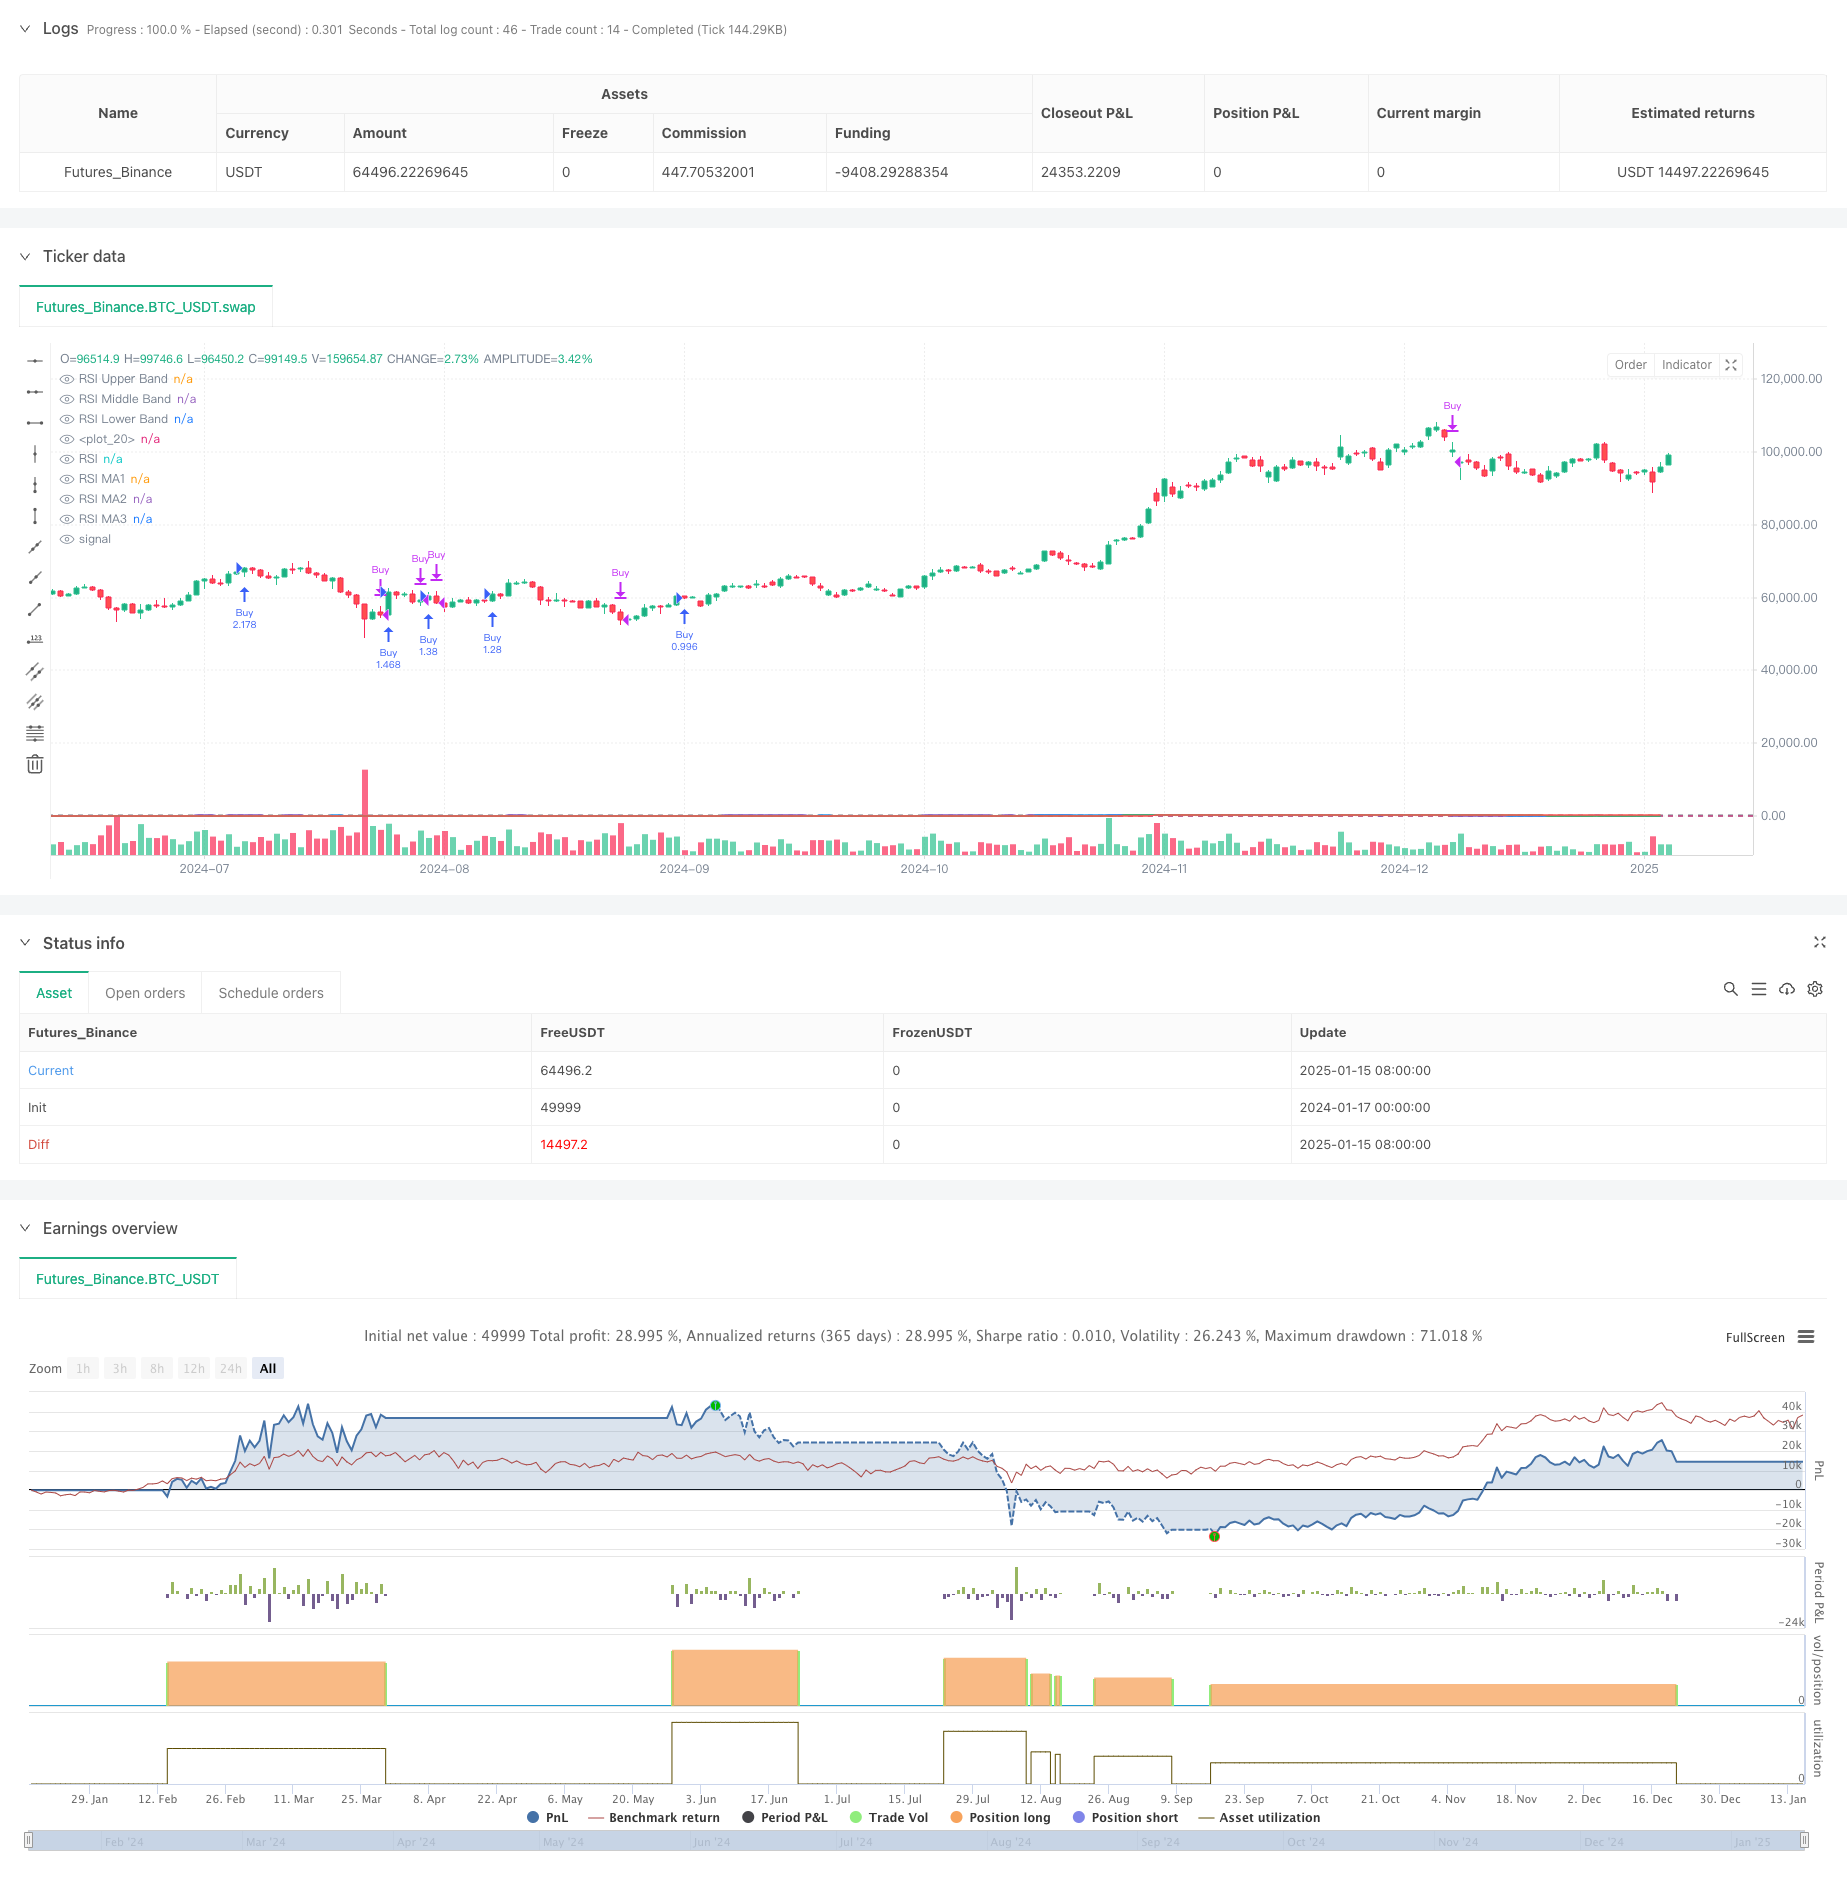
動的RSI 多重移動平均クロスオーバーの量的な取引戦略
作者: リン・ハーンチャオチャン, 日付: 2025-01-17 16:14:38タグ:RSIマルチSMAエイマWMASMMARMA

概要
これは,相対強度指数 (RSI) を複数の移動平均値と組み合わせる定量的な取引戦略である.この戦略は,主にRSI指標上の異なるタイプの移動平均値 (SMA,EMA,WMA,SMMAを含む) のクロスオーバー信号をモニタリングすることによって市場動向を特定し,補完的な決定基準としてRSI
戦略の原則
戦略には,いくつかの重要な計算ステップが含まれます. 1. 14 期間の RSI を 70 で過買い値と 30 で過売り値で計算する 2. RSI 曲線上の 3 つの異なる移動平均を計算します. - MA1:20期,SMA/EMA/WMA/SMMAの選択 - MA2:50期,SMA/EMA/WMA/SMMAの選択 - MA3:100期,SMA/EMA/WMA/SMMAの選択 3. 取引信号生成規則: - 購入信号: MA2 が MA3 を越えると - 売り信号: MA2がMA3を下回る時 4. 追加の参照のためにRSIの差異を同時に検出
戦略 の 利点
- 複数の技術指標のクロスバリダーションは信号の信頼性を向上させる
- 柔軟な移動平均の種類とパラメータ
- RSIの差異検出は,市場の転換点を早期に特定するのに役立ちます
- 効果的なリスク管理のための割合に基づくポジション管理
- 分析とバックテストのための優れた可視化
戦略リスク
- 移動平均のクロスオーバーには遅延効果がある可能性があります
- 変動する市場では誤った信号が発生する可能性があります.
- 特定の市場条件下でRSIの歪み
- パラメータの不正な選択は,過剰なまたは不十分な取引信号につながる可能性があります. リスク軽減
- 市場動向と量との相互検証を推奨する
- 移動平均パラメータの調整によって取引頻度を最適化
- リスク管理のためのストップ・ロストとテイク・プロフィートのレベルを設定する
戦略の最適化方向
- シグナルフィルタリングの最適化:
- 傾向確認指標を追加する
- 容量分析を組み込む
- パラメータ動的最適化:
- RSIとMAパラメータを市場変動に基づいて自動的に調整する
- 適応期間の計算方法を導入する
- リスク管理の最適化
- ダイナミックなストップ・ロスト・メカニズムと利益の引き上げメカニズムを開発する
- ダイナミック位置管理システムの設計
概要
この戦略は,RSIと複数の移動平均値を組み合わせて適応可能な取引システムを構築する.その主な利点は,複数の技術指標のクロスバリディテーションと柔軟なパラメータ構成にあります.一方,移動平均遅延と戦略パフォーマンスへの市場の状況の影響に注意を払う必要があります.継続的な最適化とリスク管理を通じて,この戦略は実際の取引で安定したパフォーマンスの約束を示しています.
/*backtest
start: 2024-01-17 00:00:00
end: 2025-01-16 00:00:00
period: 1d
basePeriod: 1d
exchanges: [{"eid":"Futures_Binance","currency":"BTC_USDT","balance":49999}]
*/

//@version=6
strategy(title="Relative Strength Index with MA Strategy", shorttitle="RSI-MA Strategy", overlay=true, default_qty_type=strategy.percent_of_equity, default_qty_value=200)

// RSI Inputs
rsiLengthInput = input.int(14, minval=1, title="RSI Length", group="RSI Settings")
rsiSourceInput = input.source(close, "Source", group="RSI Settings")
calculateDivergence = input.bool(false, title="Calculate Divergence", group="RSI Settings", tooltip="Calculating divergences is needed in order for divergence alerts to fire.")

// RSI Calculation
change_rsi = ta.change(rsiSourceInput)
up = ta.rma(math.max(change_rsi, 0), rsiLengthInput)
down = ta.rma(-math.min(change_rsi, 0), rsiLengthInput)
rsi = down == 0 ? 100 : up == 0 ? 0 : 100 - (100 / (1 + up / down))

// RSI Plot
plot(rsi, "RSI", color=#7E57C2)
hline(70, "RSI Upper Band", color=#787B86)
hline(50, "RSI Middle Band", color=color.new(#787B86, 50))
hline(30, "RSI Lower Band", color=#787B86)
fill(hline(70), hline(30), color=color.rgb(126, 87, 194, 90), title="RSI Background Fill")

// RSI-based MA Inputs
grpRSIMovingAverages = "RSI Moving Averages"
ma1Length = input.int(20, title="MA1 Length", group=grpRSIMovingAverages)
ma2Length = input.int(50, title="MA2 Length", group=grpRSIMovingAverages)
ma3Length = input.int(100, title="MA3 Length", group=grpRSIMovingAverages)
ma1Type = input.string("SMA", title="MA1 Type", options=["SMA", "EMA", "WMA", "SMMA"], group=grpRSIMovingAverages)
ma2Type = input.string("EMA", title="MA2 Type", options=["SMA", "EMA", "WMA", "SMMA"], group=grpRSIMovingAverages)
ma3Type = input.string("WMA", title="MA3 Type", options=["SMA", "EMA", "WMA", "SMMA"], group=grpRSIMovingAverages)

// MA Calculation Function
calcMA(source, length, type) =>
    switch type
        "SMA" => ta.sma(source, length)
        "EMA" => ta.ema(source, length)
        "WMA" => ta.wma(source, length)
        "SMMA" => ta.rma(source, length)

// MA Calculations
ma1 = calcMA(rsi, ma1Length, ma1Type)
ma2 = calcMA(rsi, ma2Length, ma2Type)
ma3 = calcMA(rsi, ma3Length, ma3Type)

// MA Plots
plot(ma1, title="RSI MA1", color=color.blue)
plot(ma2, title="RSI MA2", color=color.green)
plot(ma3, title="RSI MA3", color=color.red)

// Divergence (Retained from original script)
lookbackRight = 5
lookbackLeft = 5
rangeUpper = 60
rangeLower = 5
bearColor = color.red
bullColor = color.green
textColor = color.white
noneColor = color.new(color.white, 100)

_inRange(bool cond) =>
    bars = ta.barssince(cond)
    rangeLower <= bars and bars <= rangeUpper

plFound = false
phFound = false

bullCond = false
bearCond = false

rsiLBR = rsi[lookbackRight]

if calculateDivergence
    // Regular Bullish
    plFound := not na(ta.pivotlow(rsi, lookbackLeft, lookbackRight))
    rsiHL = rsiLBR > ta.valuewhen(plFound, rsiLBR, 1) and _inRange(plFound[1])
    lowLBR = low[lookbackRight]
    priceLL = lowLBR < ta.valuewhen(plFound, lowLBR, 1)
    bullCond := priceLL and rsiHL and plFound

    // Regular Bearish
    phFound := not na(ta.pivothigh(rsi, lookbackLeft, lookbackRight))
    rsiLH = rsiLBR < ta.valuewhen(phFound, rsiLBR, 1) and _inRange(phFound[1])
    highLBR = high[lookbackRight]
    priceHH = highLBR > ta.valuewhen(phFound, highLBR, 1)
    bearCond := priceHH and rsiLH and phFound

// plot(
//      plFound ? rsiLBR : na,
//      offset=-lookbackRight,
//      title="Regular Bullish",
//      linewidth=2,
//      color=(bullCond ? bullColor : noneColor),
//      display = display.pane
//      )

plotshape(
     bullCond ? rsiLBR : na,
     offset=-lookbackRight,
     title="Regular Bullish Label",
     text=" Bull ",
     style=shape.labelup,
     location=location.absolute,
     color=bullColor,
     textcolor=textColor
     )

// plot(
//      phFound ? rsiLBR : na,
//      offset=-lookbackRight,
//      title="Regular Bearish",
//      linewidth=2,
//      color=(bearCond ? bearColor : noneColor),
//      display = display.pane
//      )

plotshape(
     bearCond ? rsiLBR : na,
     offset=-lookbackRight,
     title="Regular Bearish Label",
     text=" Bear ",
     style=shape.labeldown,
     location=location.absolute,
     color=bearColor,
     textcolor=textColor
     )

alertcondition(bullCond, title='Regular Bullish Divergence', message="Found a new Regular Bullish Divergence, `Pivot Lookback Right` number of bars to the left of the current bar.")
alertcondition(bearCond, title='Regular Bearish Divergence', message='Found a new Regular Bearish Divergence, `Pivot Lookback Right` number of bars to the left of the current bar.')

// ----- MUA/BÁN -----

// Điều kiện Mua: MA2 cắt lên MA3 và MA3 < 55
buyCondition = ta.crossover(ma2, ma3)

// Điều kiện Bán: MA2 cắt xuống MA3 và MA3 > 40
sellCondition = ta.crossunder(ma2, ma3)

// Thực hiện lệnh Mua/Bán
if (buyCondition)
    strategy.entry("Buy", strategy.long, comment="Buy Signal")

if (sellCondition)
    strategy.close("Buy", comment="Sell Signal")


// ----- KẾT THÚC -----
関連性
- 多期移動平均のクロスオーバートレンド 戦略に従って
- 二重移動平均勢力の追跡量的な戦略
- 変動フィルター付き戦略をフォローする多動平均クロスオーバートレンド
- 適応型移動平均のクロスオーバー戦略
- RSIのダイバージェンスと移動平均を組み合わせた高度な定量取引戦略
- ボリンジャー帯と移動平均クロスオーバー戦略
- 複数の確認を伴う戦略に従う多面滑らかな移動平均動的クロスオーバー傾向
- MACD と RSI の組み合わせた自然取引戦略
- ダイナミック RSI スマートタイム スウィング トレーディング 戦略
- アダプティブ・マルチ・ムービング・平均・クロスオーバー・ダイナミック・トレーディング・ストラテジー
もっと
- アダプティブ・ボリンジャー・バンド・ミアンス・リバーション・トレーディング・ストラテジー
- 先進的な多指標トレンド確認取引戦略
- 2つの移動平均-RSI 多信号トレンド取引戦略
- アダプティブ・トレンドフォローとマルチコンフィレーション・トレーディング・戦略
- 日中取引戦略を最適化するために,RSIモメントインジケーターと組み合わせたダイナミックEMAシステム
- 戦略をフォローするマルチテクニカルインジケータークロスオーバーモメントトレンド
- ストップ・ロスの動的調整 エレファント・バー トレンド 戦略をフォローする
- 2 期間のRSIトレンドモメンタム戦略とピラミッド型ポジション管理システム
- ハーモニックパターンとウィリアムズ%Rを組み合わせたマルチタイムフレーム取引戦略
- EMAトレンドと丸数ブレークアウト取引戦略
- 動的トレンドRSI指標の横断戦略
- 多次元KNNアルゴリズムとボリューム価格のキャンドルスタイクパターン取引戦略
- 双重クロスオーバートレンド フォローする戦略: EMAとMACDシネージティック・トレーディング・システム
- 日中のパターンの認識を備えたSMAベースのインテリジェント・トレリング・ストップ戦略
- アダプティブ・マルチ戦略・ダイナミック・スイッチング・システム:トレンドフォローとレンジ・オシレーションを組み合わせた定量的な取引戦略
- 先進的な多指標多次元トレンドクロス定量戦略
- 多因子回帰とダイナミック価格帯量的な取引システム
- 多指標動的トレンド検出とリスク管理の取引戦略
- 複数の確認を伴う戦略に従う多面滑らかな移動平均動的クロスオーバー傾向
- 大型キャンドルとRSIディバージェンスをベースとした高度なダイナミックストップ・ロスの戦略