볼링거 밴드 RSI 거래 전략
저자:차오장, 날짜: 2024-05-24 17:24:06태그:RSIBBSMA

전반적인 설명
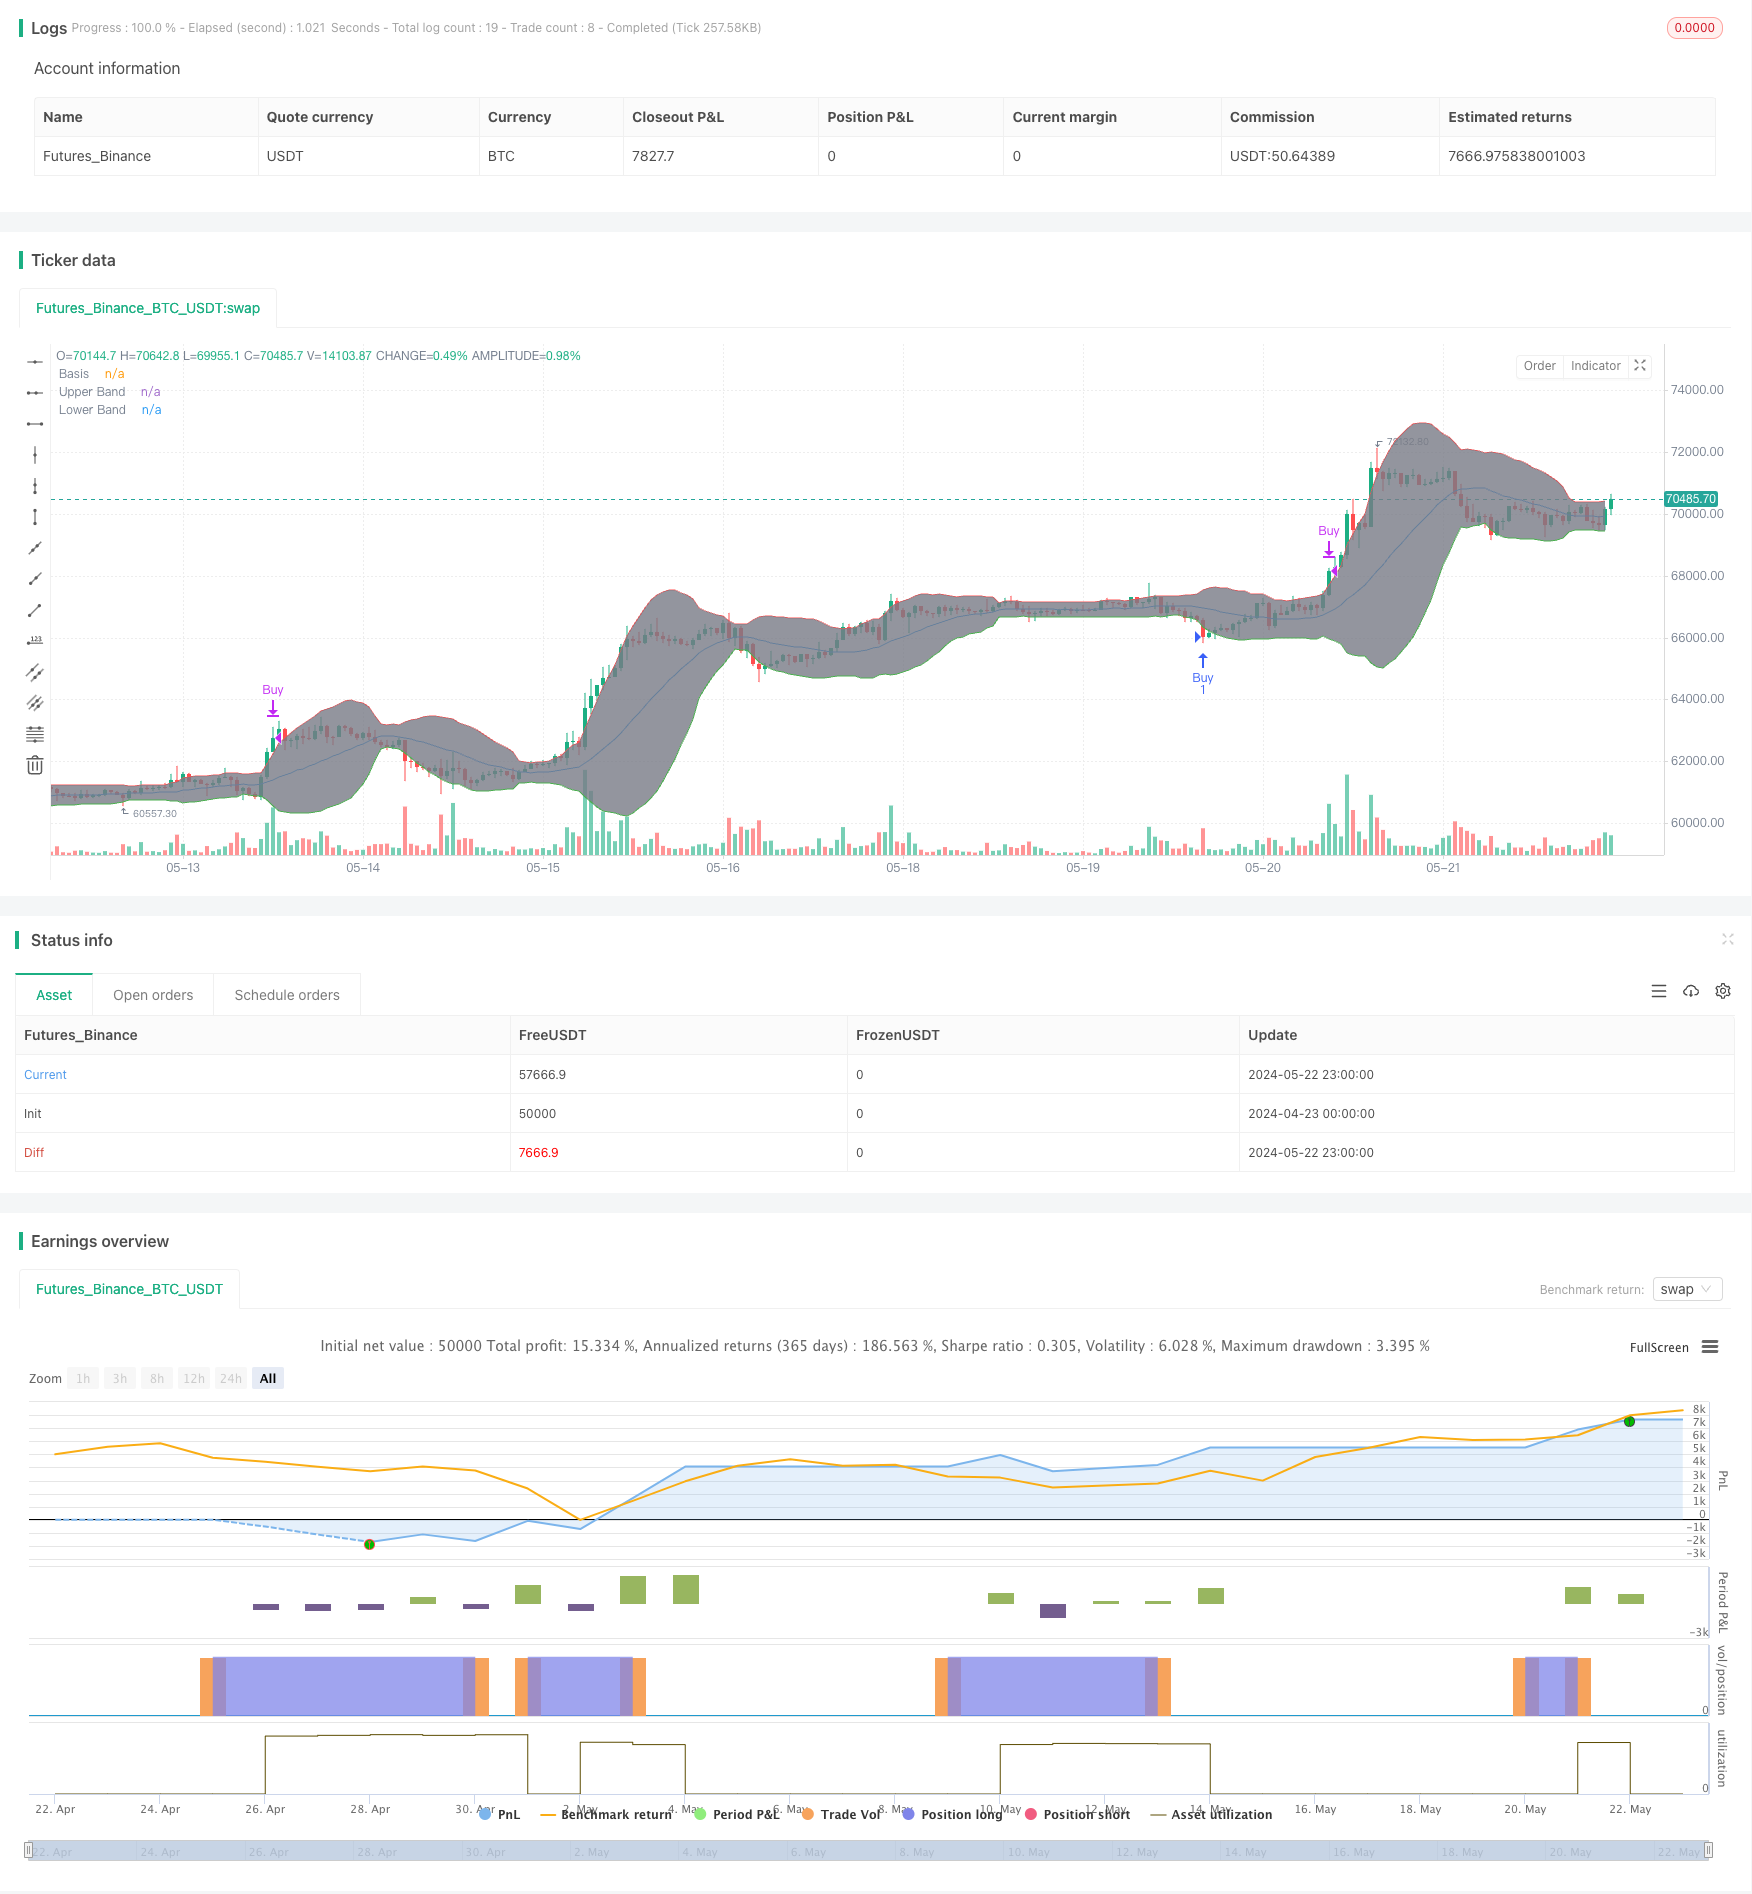
이 전략은 거래 신호를 식별하기 위해 볼링거 밴드 (BB) 와 상대적 강도 지수 (RSI) 를 사용합니다. 가격이 상부 또는 하부 볼링거 밴드를 통과하고 RSI가 과잉 구매 수준 이상 또는 과잉 판매 수준 아래에있을 때 구매 또는 판매 신호가 생성됩니다. 전략은 극단적인 가격 움직임을 포착하는 것을 목표로하며 트렌드의 강도를 확인하기 위해 RSI를 사용합니다.
전략 원칙
- 상부, 중부, 하부 볼링거 대역을 계산합니다. 상부와 하부 대역은 표준편차의 곱셈을 더하거나 빼는 중부 대역입니다.
- 과잉 구매 및 과잉 판매 가격 조건을 측정하기 위해 RSI 지표를 계산합니다.
- 닫기 가격이 아래 볼링거 밴드 밑에 있고 RSI가 과잉 판매 수준 아래에 있을 때 구매 신호가 생성됩니다.
- 닫기 가격이 상부 볼링거 밴드 이상이고 RSI가 과잉 구매 수준 이상이면 판매 신호가 생성됩니다.
- 반대 신호가 표시되면 구매 및 판매 명령을 실행하고 포지션을 닫습니다.
전략적 장점
- 거래 신호의 신뢰성을 높이기 위해 가격 및 동력 지표를 결합합니다.
- 볼링거 밴드는 시장의 다양한 변동에 동적으로 적응할 수 있습니다.
- RSI는 트렌드의 강도를 확인하고 옆 시장에서 너무 많은 거래 신호를 생성하는 것을 피할 수 있습니다.
- 전략 논리는 명확하고 구현하고 최적화하는 것이 쉽습니다.
전략 위험
- 불분명한 추세 또는 낮은 변동성을 가진 시장에서 전략은 많은 잘못된 신호를 생성 할 수 있습니다.
- RSI와 볼링거 밴드의 매개 변수 선택은 전략 성과에 상당한 영향을 미치며, 부적절한 매개 변수는 나쁜 성과로 이어질 수 있습니다.
- 이 전략은 실제 수익에 영향을 줄 수 있는 거래 비용과 미끄러짐을 고려하지 않습니다.
전략 최적화 방향
- 볼링거 밴드 (예: 길이와 표준편차 배수) 및 RSI (예: 길이와 과잉 구매/ 과잉 판매 기준) 의 매개 변수를 최적화하여 전략의 적응성과 안정성을 향상시킵니다.
- 트렌드 확인 지표 또는 볼륨 지표와 같은 다른 기술적 지표 또는 필터링 조건을 도입하여 거래 신호의 품질을 더욱 향상시킵니다.
- 트랜잭션 비용과 미끄러짐을 고려하고, 위험을 통제하고 전략의 실제 수익을 향상시키기 위해 합리적인 스톱 로스 및 수익을 취하는 수준을 설정하십시오.
- 전략을 뒷 테스트하고 매개 변수를 최적화하고, 그 안정성을 평가하기 위해 다른 시장 조건에서 전략을 테스트합니다.
요약
볼링거 밴드 RSI 거래 전략은 가격이 극심한 변동을 겪을 때 가격 및 동력 지표를 결합하여 거래 신호를 생성합니다. 전략의 장점은 명확한 논리와 구현 및 최적화 용이성에 있습니다. 그러나 전략의 성능은 매개 변수 선택에 달려 있으며 특정 시장 환경에서 많은 잘못된 신호를 생성 할 수 있습니다. 매개 변수를 최적화하고 다른 지표를 도입하고 실제 거래 비용을 고려함으로써 전략의 견고성과 수익 잠재력을 더욱 향상시킬 수 있습니다.
/*backtest
start: 2024-04-23 00:00:00
end: 2024-05-23 00:00:00
period: 1h
basePeriod: 15m
exchanges: [{"eid":"Futures_Binance","currency":"BTC_USDT"}]
*/

//@version=5
strategy("Bollinger Bands + RSI Strategy", overlay=true)

// Bollinger Bands settings
length = input.int(20, title="BB Length")
src = close
mult = input.float(2.0, title="BB Multiplier")

basis = ta.sma(src, length)
dev = mult * ta.stdev(src, length)
upper = basis + dev
lower = basis - dev

// Plot Bollinger Bands
plot(basis, color=color.blue, title="Basis")
p1 = plot(upper, color=color.red, title="Upper Band")
p2 = plot(lower, color=color.green, title="Lower Band")
fill(p1, p2, color=color.gray, transp=90)

// RSI settings
rsiLength = input.int(14, title="RSI Length")
rsiOverbought = input.int(70, title="RSI Overbought Level")
rsiOversold = input.int(30, title="RSI Oversold Level")

rsi = ta.rsi(close, rsiLength)

// Buy and sell conditions
buyCondition = (close < lower) and (rsi < rsiOversold)
sellCondition = (close > upper) and (rsi > rsiOverbought)

// Execute buy and sell orders
if (buyCondition)
    strategy.entry("Buy", strategy.long)

if (sellCondition)
    strategy.close("Buy")
관련
- 볼링거 밴드 및 RSI 결합 거래 전략
- 볼링거 밴드 및 RSI 결합 동적 거래 전략
- 적응적인 볼링거 밴드 역동적 포지션 관리 전략
- 볼링거 밴드 및 RSI 크로스오버 거래 전략
- 고 정밀 RSI 및 Bollinger Bands 브레이크업 전략
- RSI와 볼링거 밴드 횡단 회귀 이중 전략
- MACD-RSI 크로스오버 트렌드
- RSI와 볼링거 밴드 이중 전략
- 보린저 밴드 및 RSI 통합을 통해 향상된 평균 역전 전략
- 볼링거 밴드 및 RSI를 기반으로 한 동적 비용 평균화 전략 시스템
더 많은
- 볼링거 밴드 + RSI + 멀티 MA 트렌드 전략
- QQE와 RSI를 기반으로 한 장기 단기 신호 전략
- 제로 라그 MACD 듀얼 크로스오버 거래 전략 - 단기 트렌드 캡처에 기반한 고주파 거래
- 평균 실제 범위 후속 정지 전략을 따르는 경향
- P&L 예측과 함께 SMC & EMA 전략
- 나다라야-워튼 앙벨로프 다중 확인 동적 스톱 로스 전략
- 동적 취득 볼링거 밴드 전략
- CCI + MA 크로스오버 풀백 구매 전략
- 유동성 높은 통화 쌍을 위한 단기 단기 판매 전략
- MOST 지표 이중 위치 적응 전략
- 실시간 가격 전략으로 구매 및 판매 부피 열 지도
- 이중 이동 평균 회귀 거래 전략
- 다중 지표 양적 거래 전략 - 슈퍼 지표 7대1 전략
- SMK ULTRA TREND 이중 이동 평균 크로스오버 전략
- 5배 강한 이동 평균 전략
- EMA-SMA 크로스오버 황소 시장 지원 밴드 전략
- 200 EMA 필터와 함께 전략에 따른 다중 시간 프레임 트렌드 - 길게만
- SMC 시장의 높은 낮은 브레이크업 전략
- 동적 트렌드 모멘텀 거래 전략
- EMA와 단기 신호 전략의 교차