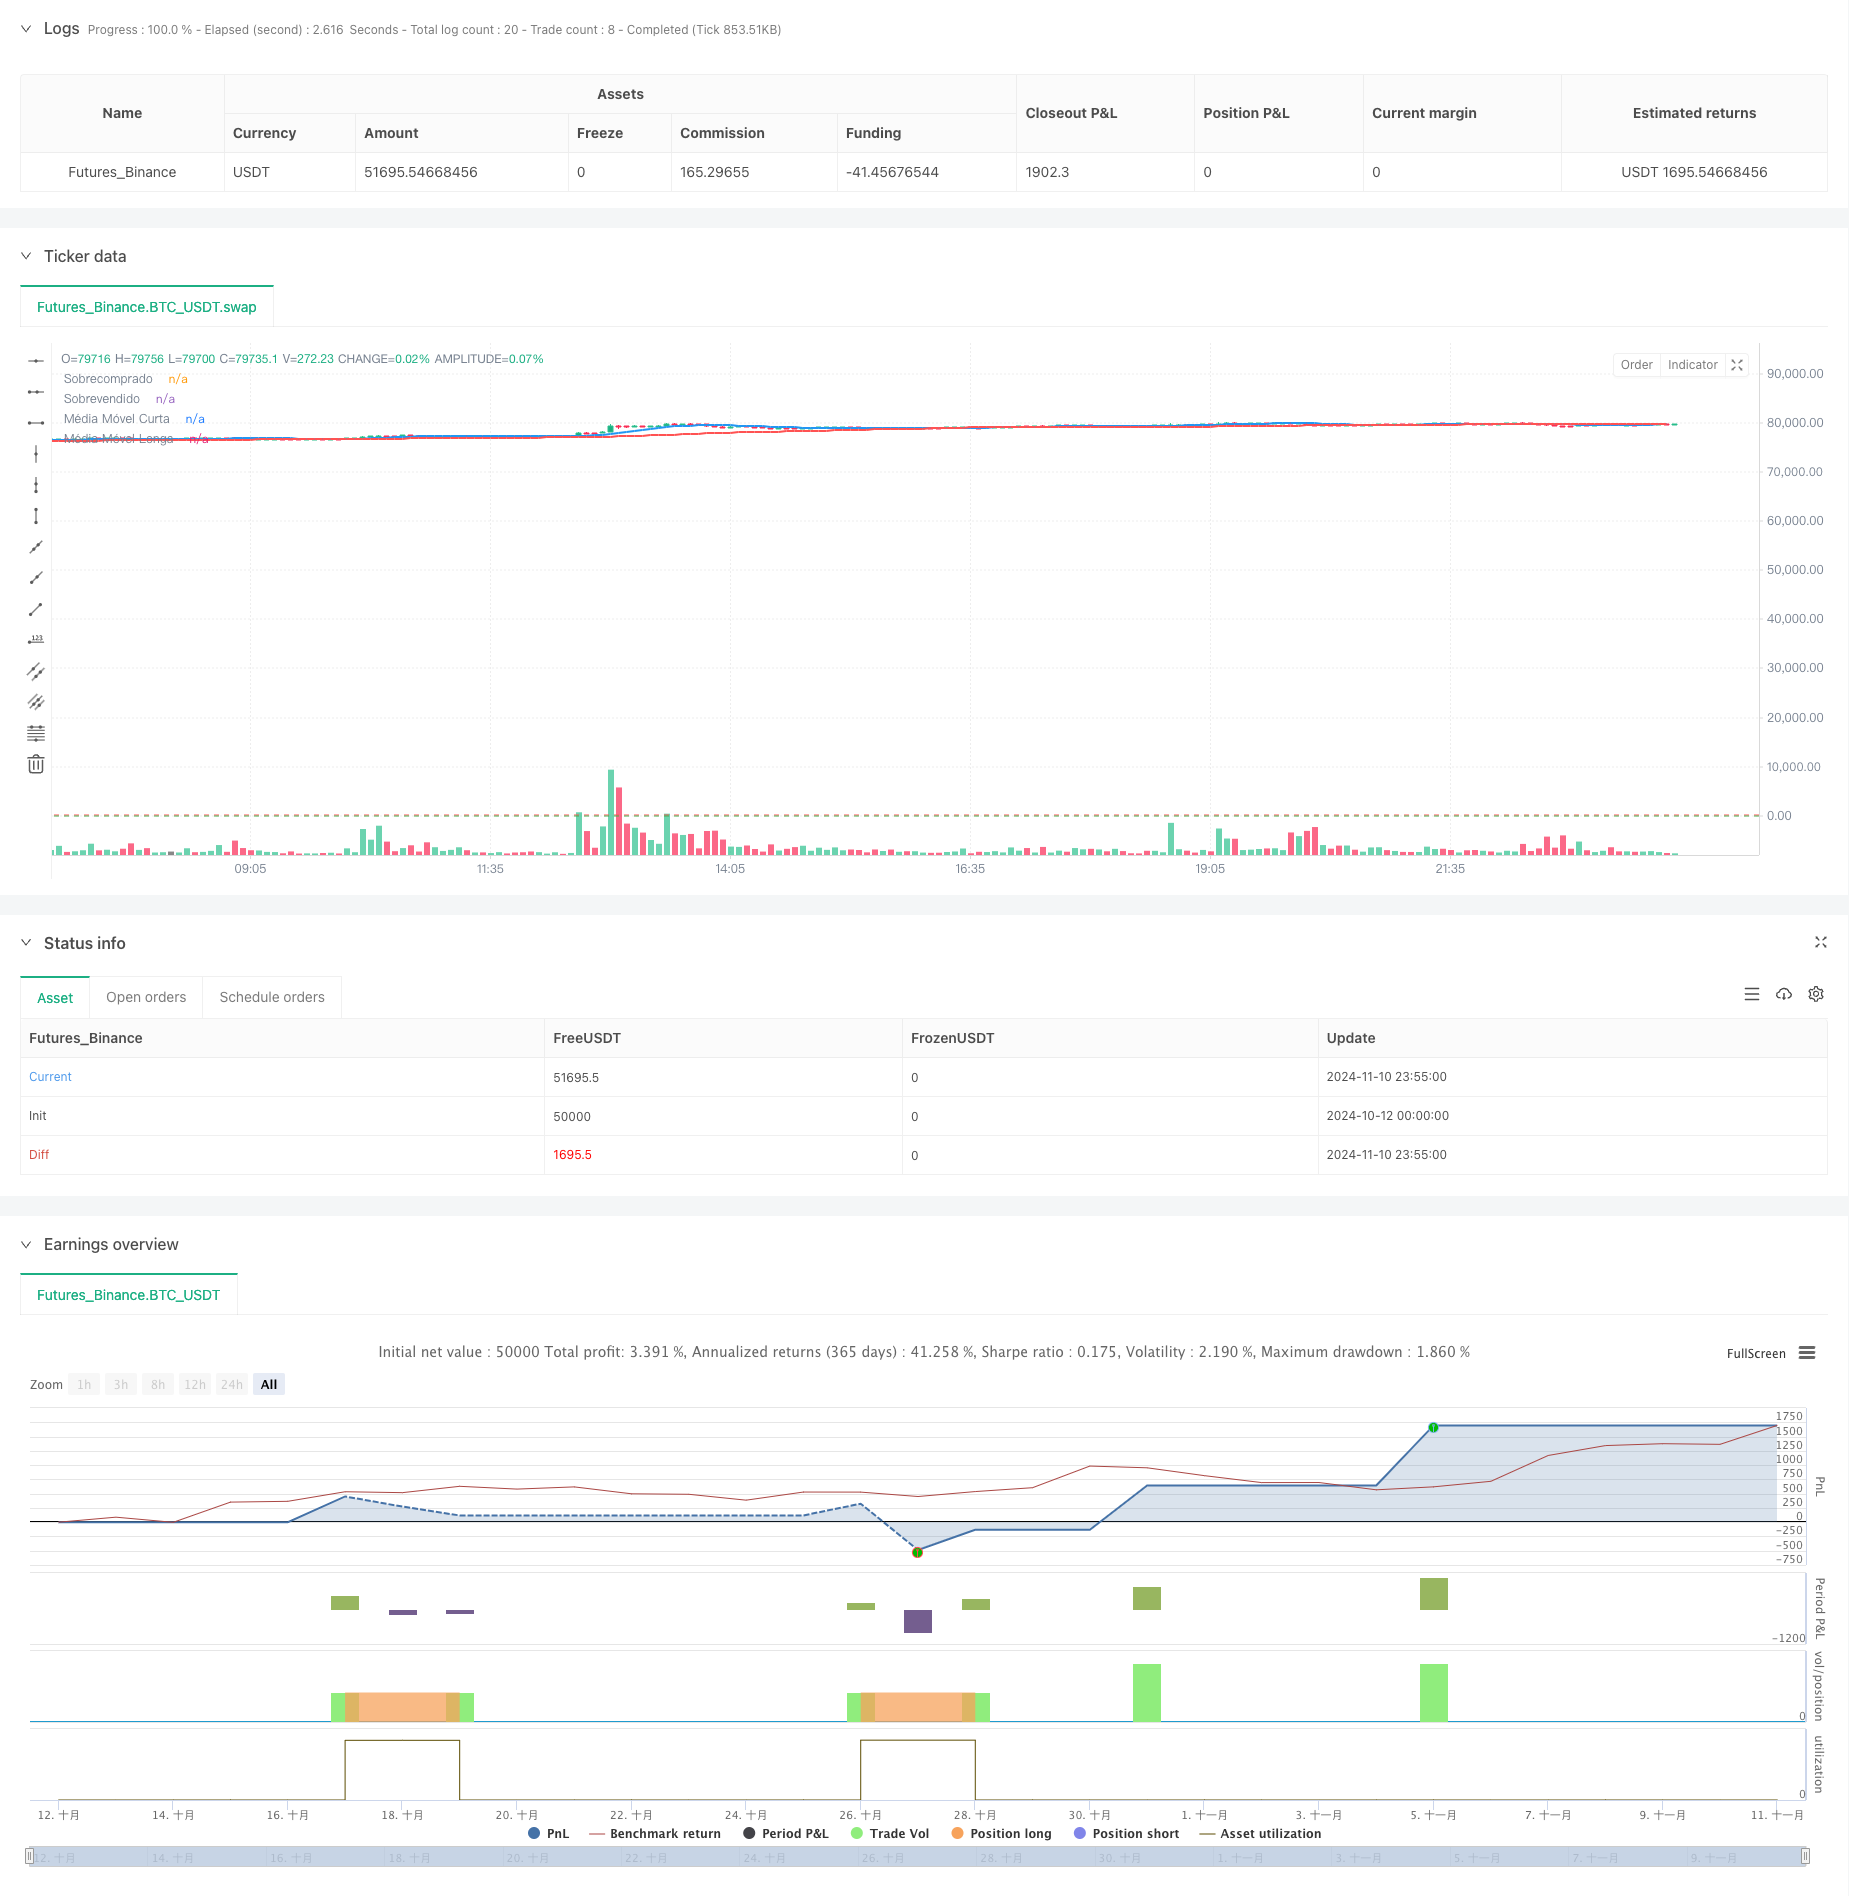
이중 이동 평균 RSI 트렌드 모멘텀 전략
저자:차오장, 날짜: 2024-11-12 14:34:17태그:SMARSIMA

전반적인 설명
이 전략은 트렌드를 따르는 거래 시스템으로 이중 이동 평균과 RSI 지표를 결합합니다. 이 전략은 과잉 구매 및 과잉 판매 영역에서 최적의 입구 지점을 위해 RSI 지표를 활용하면서 단기 및 장기 이동 평균의 크로스오버를 통해 시장 트렌드 방향을 결정하여 트렌드 따라와 역동의 완벽한 조합을 달성합니다. 이 전략은 효과적인 위험 통제를 위해 거래 당 전체 계좌 잔액의 10%를 투자하여 비율 기반의 돈 관리를 사용합니다.
전략 원칙
이 전략은 트렌드를 식별하기 위해 10 기간 및 50 기간 간단한 이동 평균 (SMA) 을 사용합니다. 단기 MA가 장기 MA보다 높고 RSI가 30보다 낮을 때 구매 신호가 생성되며, 단기 MA가 장기 MA보다 낮고 RSI가 70보다 높을 때 판매 신호가 발생합니다. 포지션 폐쇄를 위해, RSI가 70을 초과하면 긴 포지션은 닫히고 RSI가 30 이하로 떨어지면 짧은 포지션은 닫습니다. 이 디자인은 트렌드 방향 정확성과 가격 극단에서 신속한 수익을 보장합니다.
전략적 장점
- 거래 성공률을 향상시키기 위해 트렌드 및 추진력 확인을 결합합니다.
- 효율적인 위험 통제를 위해 비율 기반의 돈 관리를 구현합니다.
- 주관적인 판단을 피하기 위해 명확한 입출입 조건을 설정합니다.
- RSI 지표의 과잉 구매 및 과잉 판매 특성을 완전히 활용합니다.
- 이해하고 실행하기 쉬운 명확한 전략 논리
- 다양한 시장 환경에 적응할 수 있고 매우 다재다능합니다
전략 위험
- 다양한 시장에서 과도한 잘못된 신호를 생성 할 수 있습니다.
- RSI는 강한 트렌드 동안 과잉 구매/ 과잉 판매 영역에 남아있을 수 있습니다.
- 이중 MA 시스템은 내재된 지연을 가지고 있습니다.
- 고정된 매개 변수는 모든 시장 조건에 맞지 않을 수 있습니다. 위험 관리 권고:
- 스톱 로스 레벨 설정
- 동적으로 매개 변수를 조정
- 트렌드 확인 지표 추가
- 단일 거래 크기를 제어
최적화 방향
- 시장 변동성에 기초한 MA 기간을 동적으로 조정하기 위한 적응적 매개 변수 메커니즘을 도입
- 약한 트렌드에 거래를 피하기 위해 트렌드 강도 필터를 추가합니다.
- 시장 변동성에 따라 포지션 크기를 조정하기 위해 자금 관리 시스템을 최적화
- 거래 확인을 위한 추가 기술 지표를 포함
- 자본 효율을 향상시키기 위한 동적 스톱 로스 메커니즘 개발
요약
이 전략은 트렌드 추종과 모멘텀 역전을 완벽하게 결합한 양적 거래 전략이다. 트렌드 방향과 RSI를 결정하기 위해 이중 이동 평균을 사용하여 최적의 진입 지점을 찾으며 방향 정확성과 가격 극단에서 신속한 수익을 보장합니다. 전략 성공의 열쇠는 합리적인 매개 변수 설정과 효과적인 위험 통제에 있습니다. 지속적인 최적화와 개선을 통해 전략은 다양한 시장 환경에서 안정적인 수익을 얻을 수 있습니다.
/*backtest
start: 2024-10-12 00:00:00
end: 2024-11-11 00:00:00
period: 5m
basePeriod: 5m
exchanges: [{"eid":"Futures_Binance","currency":"BTC_USDT"}]
*/

//@version=5
strategy("Super Advanced Strategy", overlay=true)

// Configuração de parâmetros
shortMAPeriod = input.int(10, title="Período da Média Móvel Curta", minval=1)
longMAPeriod = input.int(50, title="Período da Média Móvel Longa", minval=1)
rsiPeriod = input.int(14, title="Período do RSI", minval=1)

// Cálculo das Médias Móveis
shortMA = ta.sma(close, shortMAPeriod)
longMA = ta.sma(close, longMAPeriod)

// Cálculo do RSI
rsi = ta.rsi(close, rsiPeriod)

// Plotando as Médias Móveis
plot(shortMA, title="Média Móvel Curta", color=color.blue, linewidth=2)
plot(longMA, title="Média Móvel Longa", color=color.red, linewidth=2)

// Adicionando linhas horizontais para os níveis de sobrecomprado e sobrevendido
hline(70, "Sobrecomprado", color=color.red, linestyle=hline.style_dashed)
hline(30, "Sobrevendido", color=color.green, linestyle=hline.style_dashed)

// Condições de entrada
buyCondition = (shortMA > longMA) and (rsi < 30)
sellCondition = (shortMA < longMA) and (rsi > 70)

// Entradas de ordens
if (buyCondition)
    strategy.entry("Compra", strategy.long)

if (sellCondition)
    strategy.entry("Venda", strategy.short)

// Saídas de ordens
if (rsi > 70)
    strategy.close("Compra")

if (rsi < 30)
    strategy.close("Venda")

// Exibir as condições de compra e venda no gráfico
plotshape(buyCondition, style=shape.labelup, location=location.belowbar, color=color.green, size=size.small, title="Sinal de Compra", text="BUY")
plotshape(sellCondition, style=shape.labeldown, location=location.abovebar, color=color.red, size=size.small, title="Sinal de Venda", text="SELL")
관련
- MA, SMA, MA 슬로프, 트래일링 스톱 손실, 재입구
- 여러 기간 이동 평균 및 RSI 모멘텀 크로스 전략
- 동적 지원-저항 브레이크오브 이동 평균 크로스오버 전략
- 멀티테크니컬 인디케이터 크로스 트렌드 추적 전략: RSI와 스토카스틱 RSI 시너지 거래 시스템
- 전략에 따른 다중 이동 평균 동력 추세
- 이동 평균 필터 전략과 함께 세 번 검증된 RSI 평균 역전
- 전략에 따른 다기간 이동평균 및 RSI 모멘텀 크로스 트렌드
- 기계 학습에 영감을 받은 이중 이동 평균 RSI 거래 전략
- 이동 평균 필터 시스템으로 적응 트렌드 모멘텀 RSI 전략
- 이중 동적 지표 최적화 전략
더 많은
- 여러 기간 기술 분석 및 시장 감정 거래 전략
- 123 포인트 반전 패턴에 기초한 동적 보유 기간 전략
- 멀티테크니컬 인디케이터 크로스오버 모멘텀 양적 거래 전략 - EMA, RSI 및 ADX에 기초한 통합 분석
- 패러볼 SAR 분산 거래 전략
- 시장 감정 및 저항 레벨 최적화 시스템과 결합된 모멘텀 SMA 크로스오버 전략
- 복합 전략에 따른 다기간의 RSI 모멘텀 및 트리플 EMA 트렌드
- 전략에 따른 다중 이동 평균 동력 추세
- E9 상어-32 패턴 양적 가격 유출 전략
- 오픈 마켓 노출 동적 위치 조정 양적 거래 전략
- 높은 승률 트렌드는 반전 거래 전략을 의미합니다.
- 다중 지표 융합 평균 반전 추세 전략
- 다이내믹 ATR 기반 포지션 관리와 함께 오픈 이후의 브레이크오프 거래 전략
- 다중 지표 통합 및 지능형 리스크 제어 양적 거래 시스템
- ATR 변동성 전략과 함께 다중 지표 동적 적응 위치 사이징
- RSI 동적 스톱 로스 지능형 거래 전략
- 이동 평균 필터 전략과 함께 세 번 검증된 RSI 평균 역전
- 보린거 밴드 및 RSI 통합을 이용한 적응적인 오스실레이션 트렌드 거래 전략
- ADX (평균 방향 지표) 및 부피 동적 트렌드 추적 전략
- 다량 동력 결합 거래 전략
- 피보나치 리트레이싱 및 확장 다중 지표 양적 거래 전략