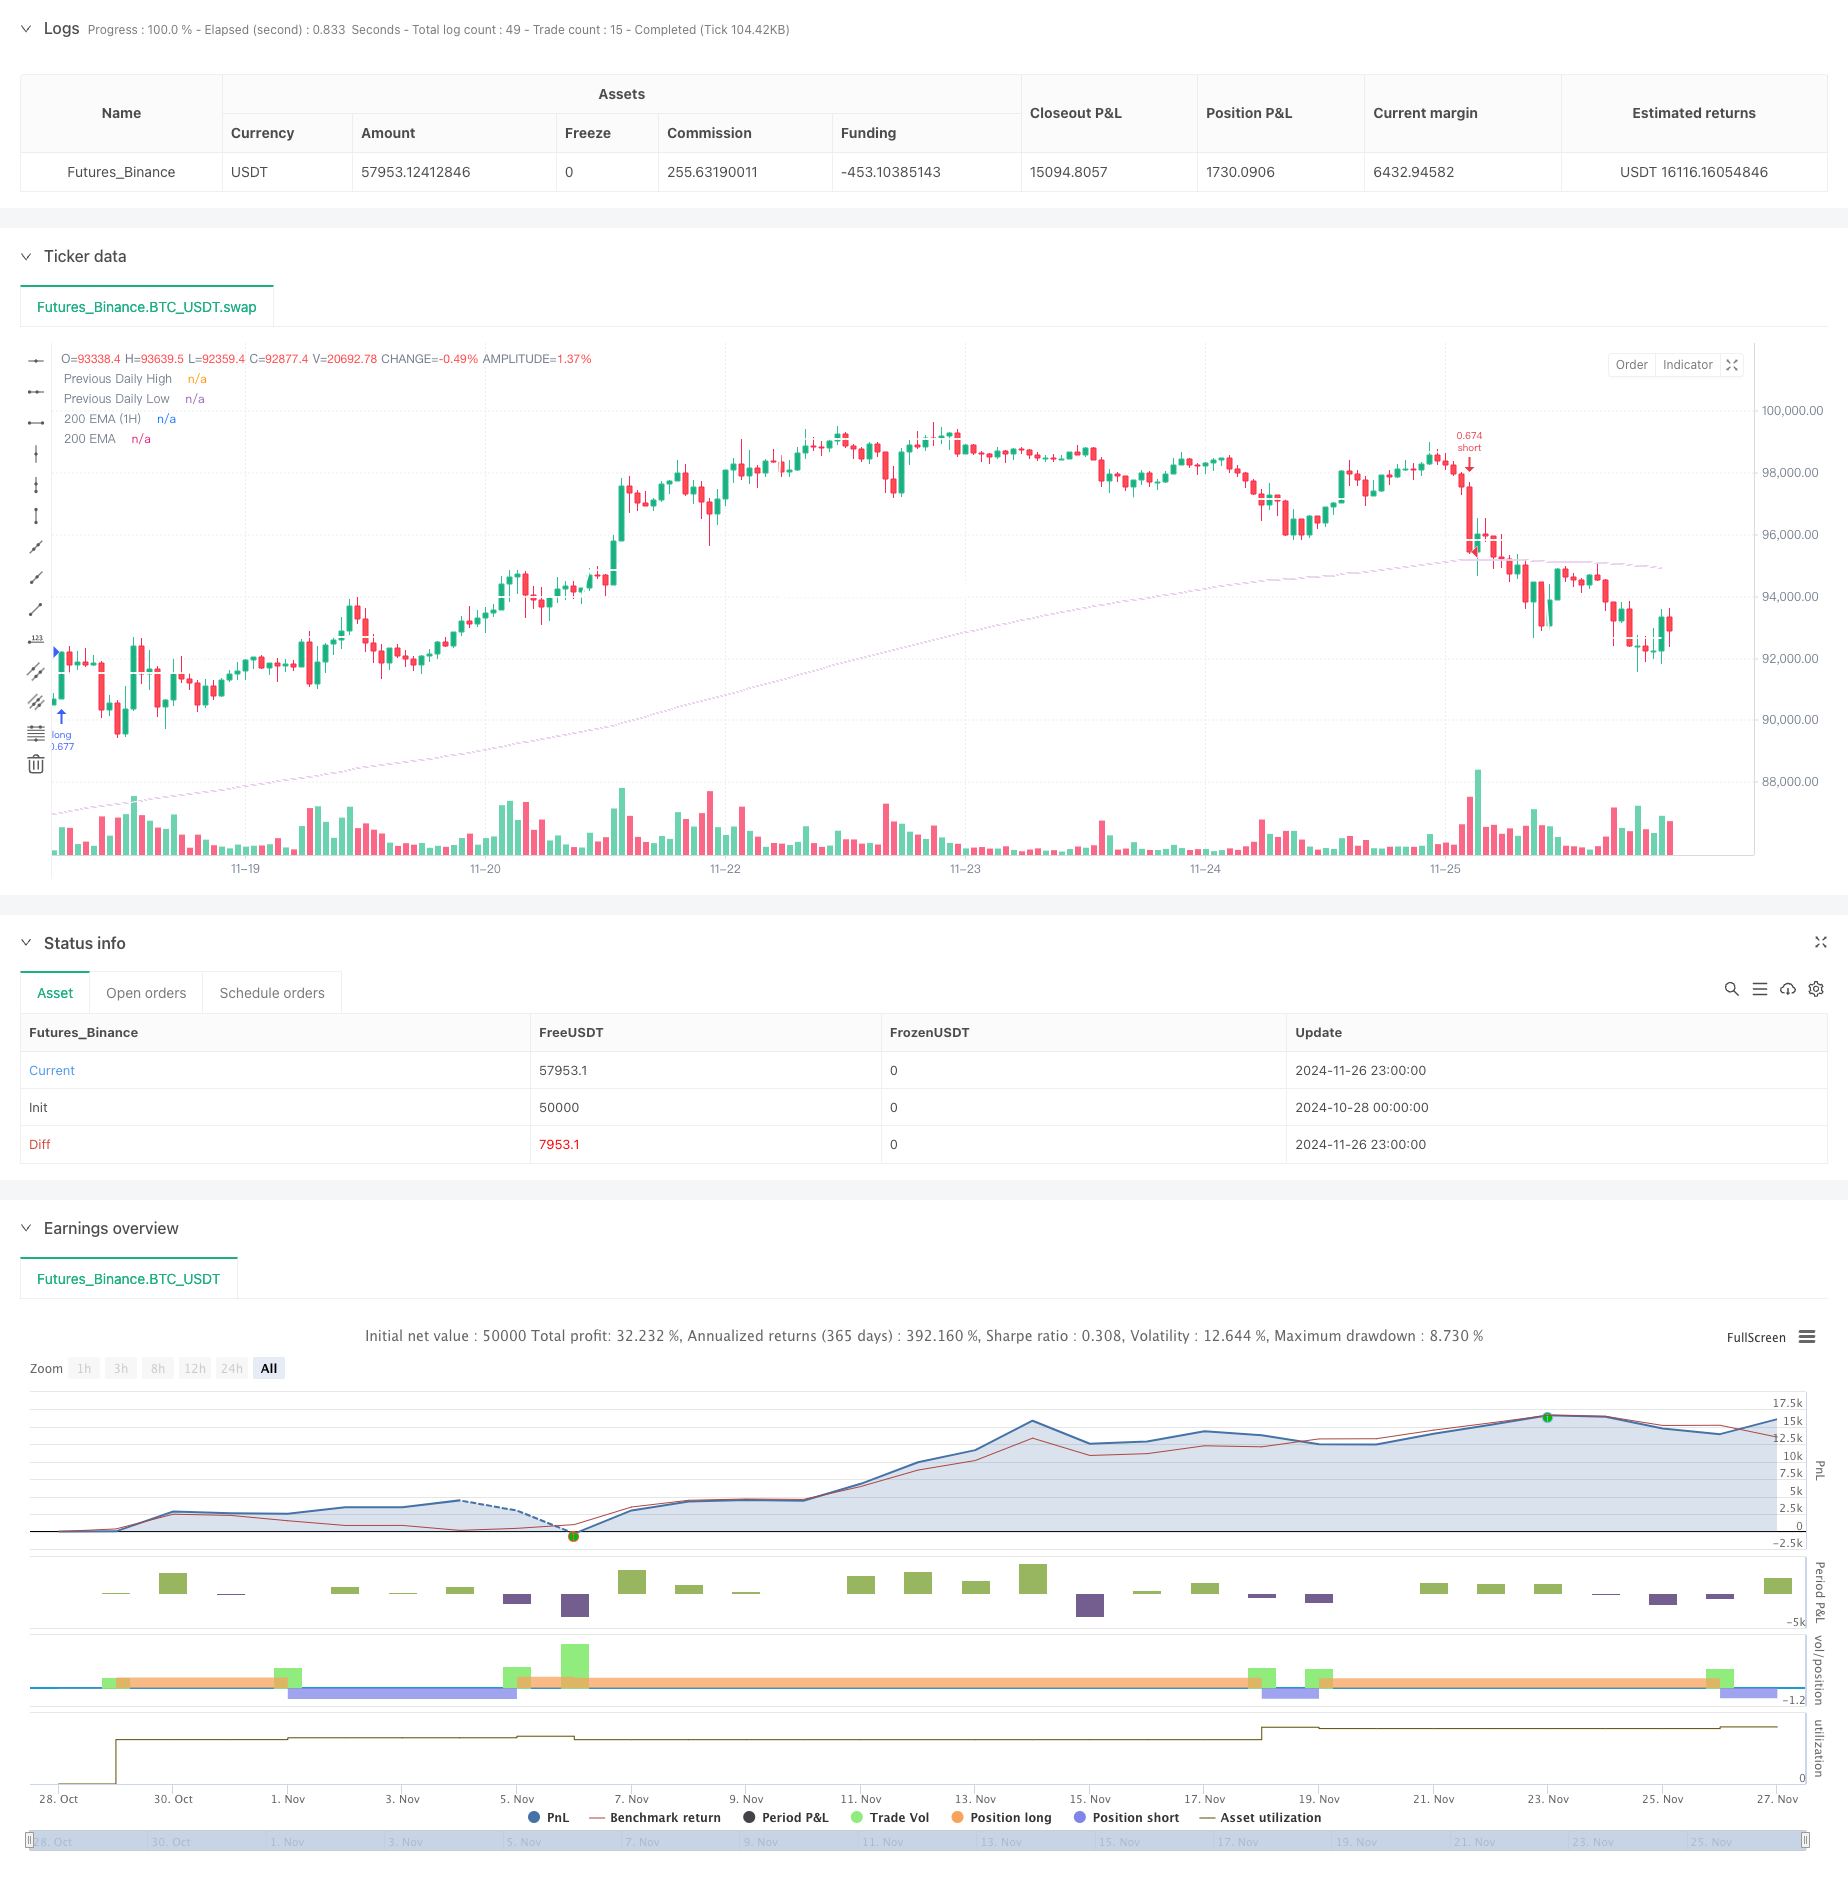
Strategi Trend EMA Multi-Timeframe dengan Sistem Penembusan Tinggi-Rendah Harian
Penulis:ChaoZhang, Tarikh: 2024-11-28 15:20:59Tag:EMAMA

Ringkasan
Ini adalah strategi perdagangan kuantitatif yang menggabungkan pecah tinggi-rendah harian dengan trend EMA pelbagai jangka masa. Strategi ini terutamanya mengenal pasti peluang perdagangan dengan memantau pecah harga tahap tinggi dan rendah hari sebelumnya, digabungkan dengan trend EMA dan penunjuk Aliran Wang Chaikin (CMF).
Prinsip Strategi
Logik teras merangkumi elemen utama berikut:
- Menggunakan fungsi request.security untuk mendapatkan harga tinggi dan rendah hari sebelumnya sebagai tahap sokongan dan rintangan utama.
- Menggabungkan EMA 24 tempoh sebagai garis asas untuk penentuan trend.
- Melaksanakan CMF (20-periode) sebagai penunjuk komprehensif jumlah dan harga untuk menilai aliran wang pasaran.
- Mengira 200 EMA pada kedua-dua jangka masa semasa dan 1 jam untuk menentukan arah trend yang lebih besar.
Peraturan perdagangan khusus:
Pendaftaran panjang: Harga pecah di atas hari sebelumnya
Kelebihan Strategi
- Validasi pelbagai penunjuk teknikal meningkatkan kebolehpercayaan dagangan
- Analisis pelbagai jangka masa memberikan penilaian trend yang komprehensif
- Integrasi penunjuk CMF menangkap keadaan aliran wang pasaran dengan lebih baik
- Tahap tinggi dan rendah hari sebelumnya selaras dengan pelaku pasaran
- Logik strategi yang jelas yang mudah difahami dan dilaksanakan
- Syarat masuk dan keluar yang jelas meminimumkan penilaian subjektif
Risiko Strategi
- Boleh menghasilkan isyarat palsu yang kerap di pasaran yang berbeza
- Tidak cukup responsif kepada penembusan harga segera
- Peluang yang hilang di peringkat utama
- Tidak mengambil kira trend jangka masa yang lebih besar
- Mungkin mengalami pengeluaran yang signifikan semasa turun naik pasaran yang melampau
Cadangan Kawalan Risiko:
- Melaksanakan paras stop-loss yang sesuai
- Penyesuaian parameter berdasarkan keadaan pasaran
- Tambah penapis trend
- Pertimbangkan untuk memasukkan penunjuk turun naik
Arahan pengoptimuman
- Melaksanakan mekanisme pengoptimuman parameter adaptif
- Tambah lebih banyak penapis keadaan pasaran
- Mengoptimumkan mekanisme stop-loss dan mengambil keuntungan
- Sertakan penunjuk turun naik untuk keadaan pasaran yang berbeza
- Pertimbangkan mekanisme pengurusan kedudukan
- Tambah penunjuk analisis jumlah
Ringkasan
Ini adalah sistem perdagangan lengkap yang menggabungkan pelbagai penunjuk teknikal dan analisis pelbagai jangka masa. Strategi ini mencari peluang perdagangan melalui analisis komprehensif mengenai penembusan tinggi-rendah intraday, trend purata bergerak, dan aliran wang. Walaupun terdapat risiko tertentu, strategi ini mempunyai nilai praktikal yang baik melalui kawalan risiko yang betul dan pengoptimuman berterusan.
/*backtest
start: 2024-10-28 00:00:00
end: 2024-11-27 00:00:00
period: 1h
basePeriod: 1h
exchanges: [{"eid":"Futures_Binance","currency":"BTC_USDT"}]
*/

//@version=5
strategy(title='The security Daily HIGH/LOW strategy', overlay=true, initial_capital=10000, calc_on_every_tick=true,
         default_qty_type=strategy.percent_of_equity, default_qty_value=100,
         commission_type=strategy.commission.percent, commission_value=0.1)

// General Inputs
len = input.int(24, minval=1, title='Length MA', group='Optimization parameters')
src = input.source(close, title='Source MA', group='Optimization parameters')
out = ta.ema(src, len)

length = input.int(20, minval=1, title='CMF Length', group='Optimization parameters')
ad = close == high and close == low or high == low ? 0 : (2 * close - low - high) / (high - low) * volume
mf = math.sum(ad, length) / math.sum(volume, length)

// Function to get daily high and low
f_secureSecurity(_symbol, _res, _src) =>
    request.security(_symbol, _res, _src[1], lookahead=barmerge.lookahead_on)

pricehigh = f_secureSecurity(syminfo.tickerid, 'D', high)
pricelow = f_secureSecurity(syminfo.tickerid, 'D', low)

// Plotting previous daily high and low
plot(pricehigh, title='Previous Daily High', style=plot.style_linebr, linewidth=2, color=color.new(color.white, 0))
plot(pricelow, title='Previous Daily Low', style=plot.style_linebr, linewidth=2, color=color.new(color.white, 0))

// Entry Conditions
short = ta.crossunder(low, pricelow) and close < out and mf < 0
long = ta.crossover(high, pricehigh) and close > out and mf > 0

if short and barstate.isconfirmed
    strategy.entry('short', strategy.short, stop=pricelow[1])
    strategy.close('short', when=close > out)

if long and barstate.isconfirmed
    strategy.entry('long', strategy.long, stop=pricehigh[1])
    strategy.close('long', when=close < out)

// 200 EMA on 1-hour timeframe
ema_200 = ta.ema(close, 200)
ema_200_1h = request.security(syminfo.tickerid, "60", ta.ema(close, 200))

plot(ema_200_1h, color=color.purple, title="200 EMA (1H)")
plot(ema_200, color=color.white, title="200 EMA")
- G-Channel dan EMA Trend Filter Trading System
- EMA Dual Moving Average Crossover Strategi
- Strategi Perdagangan Momentum EMA
- Strategi Posisi Sepanjang Malam Pasar dengan Penapis EMA
- Sistem Perdagangan Automatik Multi-EMA dengan Kunci Keuntungan Terakhir
- Sistem Perdagangan Pengesanan EMA Dual Chain Hybrid Momentum
- Strategi Perpindahan MACD
- Strategi Penembusan Intraday Berdasarkan Titik Rendah Tinggi Lilin 3 Minit
- Trend Momentum Crossover Multi-EMA Berikutan Strategi
- Trend Crossover Multi-EMA Mengikut Strategi
- RSI Trend Momentum Trading Strategy dengan MA dan Pengesahan Volume Berganda
- Strategi Dagangan Crossover EMA Bertiga dengan Stop-Loss dan Take-Profit Dinamik
- Sistem Dagangan Squeeze Dual Momentum (Strategi Gabungan Indikator SMI+UBS)
- Sistem Perdagangan Multi-Signal RSI-MACD dengan Pengurusan Hentian Dinamik
- ADX Trend Breakout Momentum Strategi Dagangan
- Mengikuti trend dan pembalikan purata Sistem Dagangan Pengoptimuman Ganda ((Strategi Tujuh Ganda)
- Strategi silang purata bergerak berbilang tempoh dan momentum RSI
- Strategi Dagangan Kuantitatif yang boleh disesuaikan dengan tarikh crossover purata bergerak ganda MACD
- Strategi crossover purata bergerak pelbagai penunjuk dinamik frekuensi tinggi
- Strategi Dagangan Trend Purata Bergerak Eksponensial Tiga
- Strategi crossover purata bergerak berbilang tempoh yang fleksibel
- T3 Moving Average Trend Following Strategy dengan Trailing Stop Loss
- Trend Indikator Multi-Teknik Mengikut Strategi dengan Ichimoku Cloud Breakout dan Sistem Henti-Hilangan
- Strategi Pengecualian Standar Berganda Bollinger Bands Momentum Breakout
- Retracement Fibonacci Jangka Masa Lanjutan dengan Sistem Dagangan Breakout Tinggi-Rendah
- RSI Strategi Dagangan Momentum Tahap Keluar Dinamik
- Pengesanan trend silang pelbagai penunjuk dan strategi dagangan adaptif gabungan jumlah-harga
- Pergerakan purata berganda yang maju mengikut trend sistem dagangan
- Strategi Pengambilan Keuntungan yang Berkualiti
- Trend Pelbagai Jangka Masa Mengikut Strategi dengan Pengurusan Volatiliti ATR