Strategi Dagangan Pembalikan Momentum Indikator Teknikal Berganda dengan Sistem Pengurusan Risiko
Penulis:ChaoZhang, Tarikh: 2025-01-06 16:45:01Tag:RSIBBRRSMA

Ringkasan
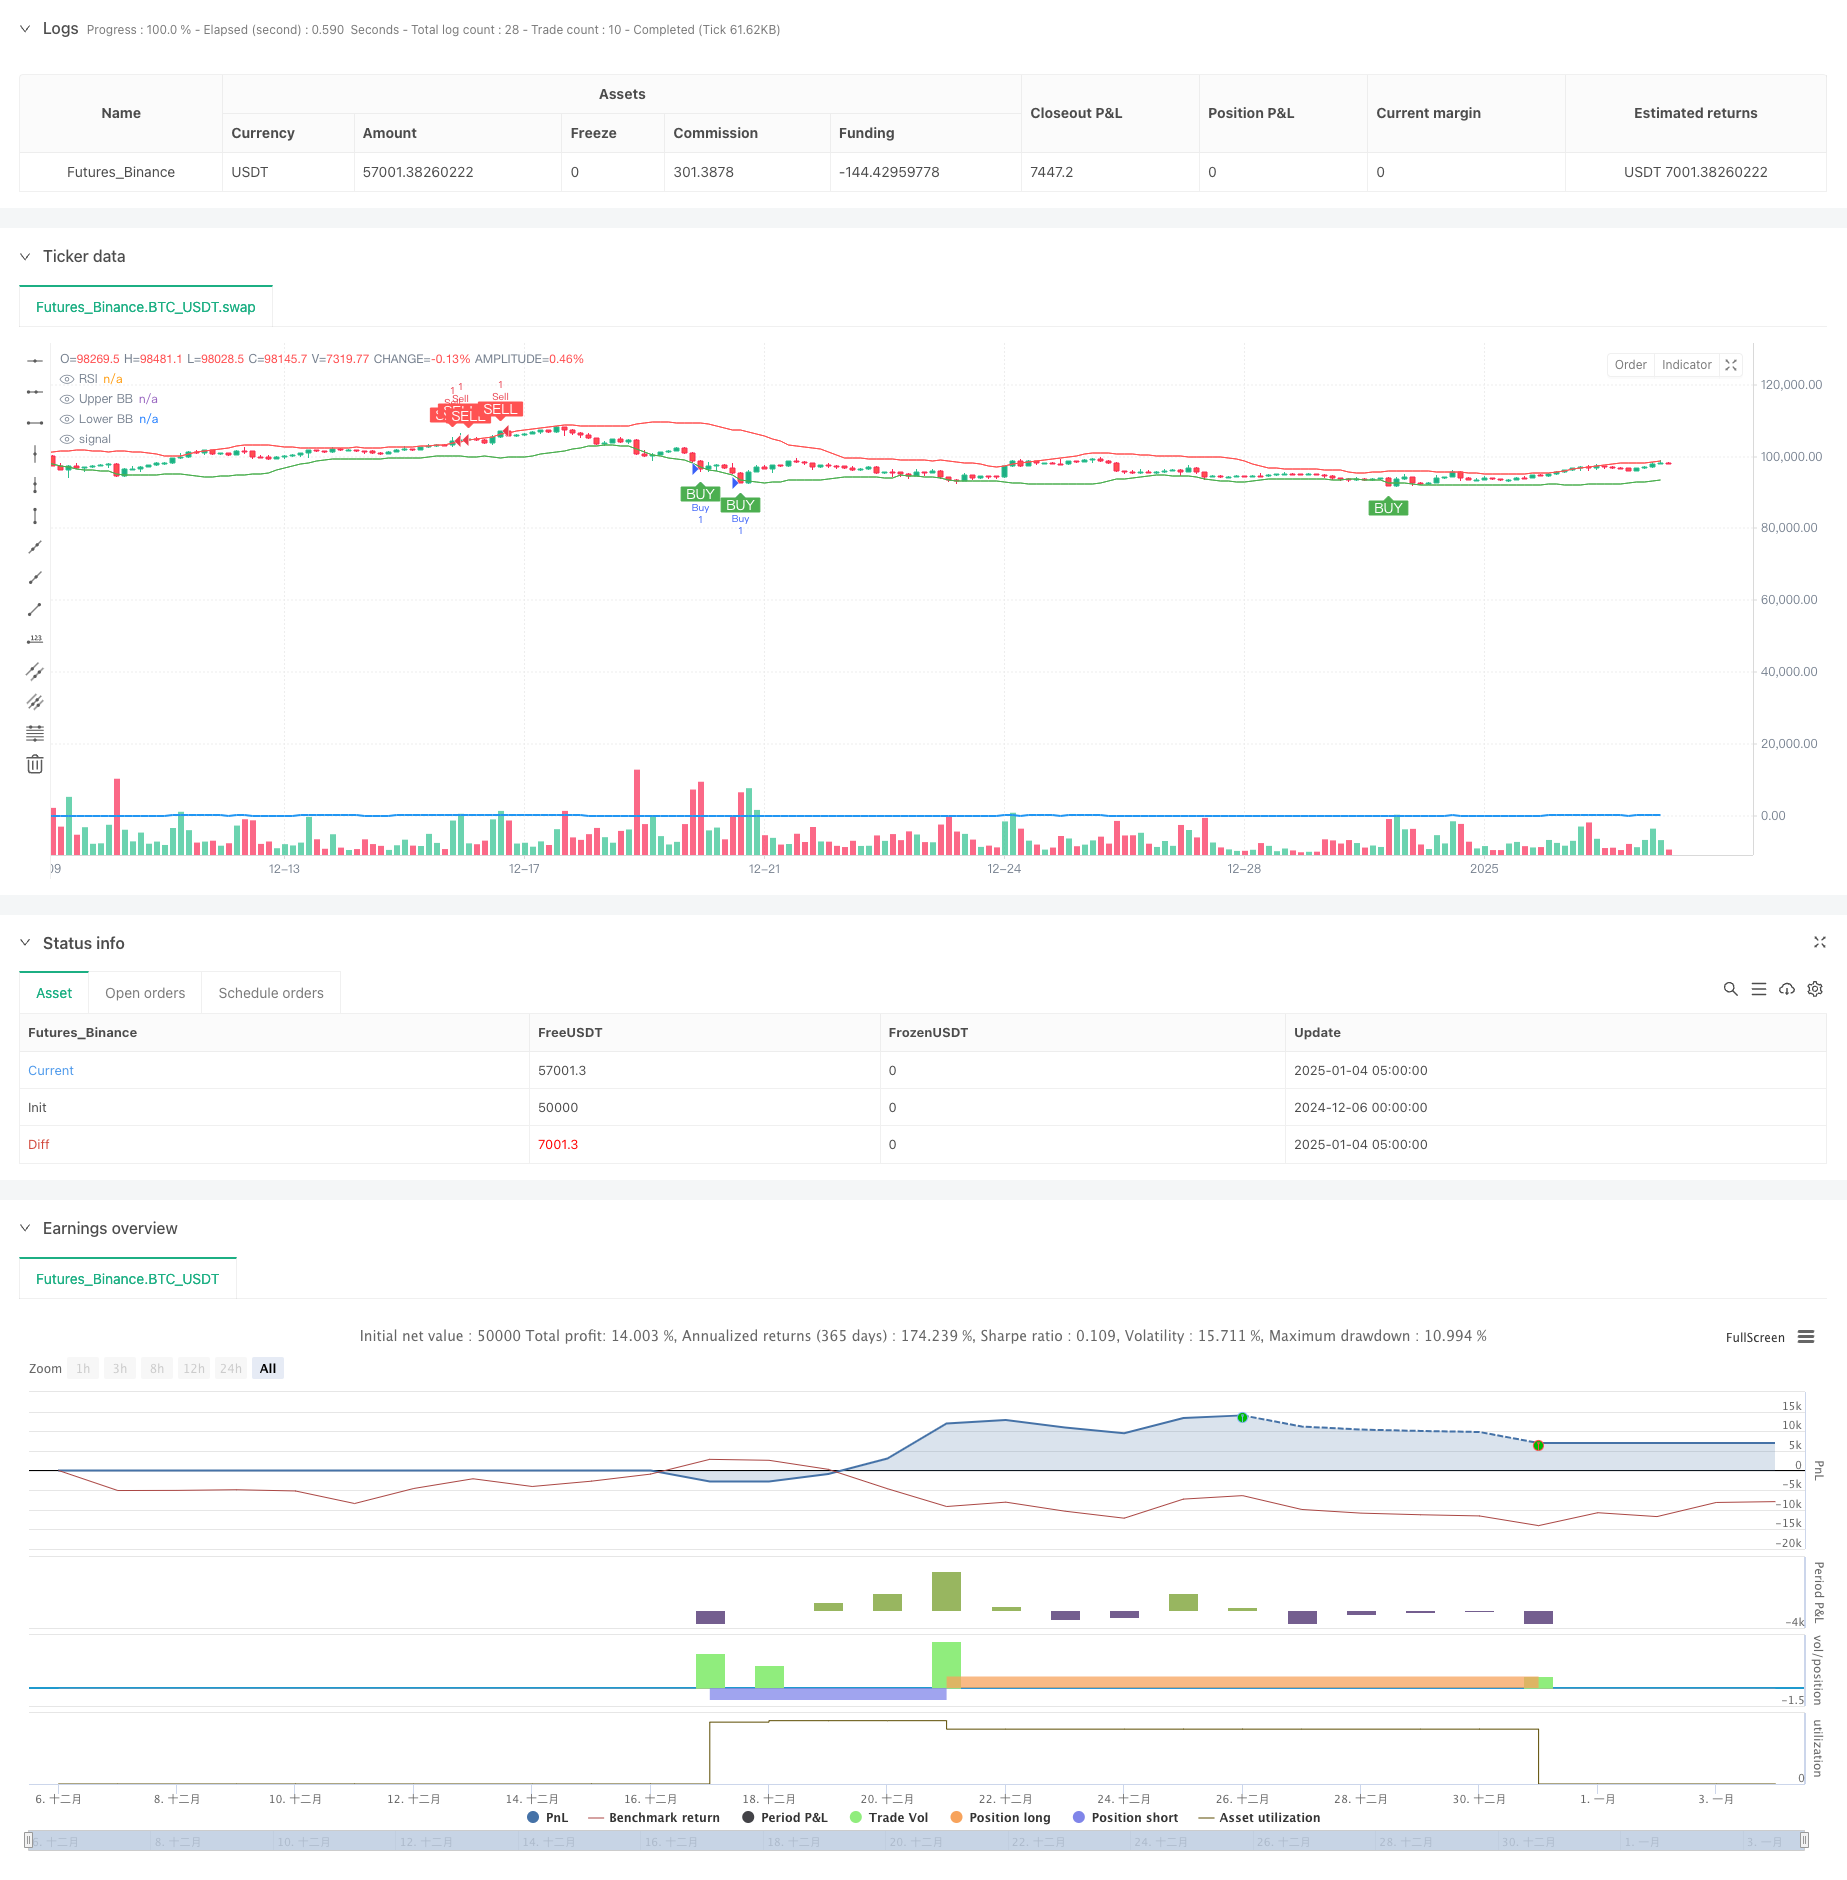
Strategi ini adalah sistem perdagangan pembalikan momentum yang menggabungkan penunjuk RSI dan Bollinger Bands, yang direka untuk mengenal pasti kawasan overbought dan oversold. Ia melaksanakan nisbah risiko-balasan 1: 2 dengan penangguhan stop loss untuk pengurusan risiko. Logik terasnya adalah untuk melaksanakan perdagangan apabila kedua-dua RSI dan Bollinger Bands menunjukkan isyarat oversold atau overbought secara serentak, melindungi modal melalui pengurusan risiko yang ketat.
Prinsip Strategi
Strategi ini menggunakan RSI 14 tempoh dan Bollinger Bands 20 tempoh sebagai penunjuk utama. Syarat beli memerlukan kedua-dua: RSI di bawah 30 (oversold) dan harga di atau di bawah Bollinger Band bawah. Syarat jual memerlukan kedua-dua: RSI di atas 70 (overbought) dan harga di atau di atas Bollinger Band atas. Sistem ini menggunakan titik tinggi / rendah 5 bar untuk berhenti, dengan mengambil keuntungan ditetapkan pada jarak dua kali jarak stop loss, dengan ketat mengekalkan nisbah risiko-balasan 1: 2.
Kelebihan Strategi
- Penapisan penunjuk berganda meningkatkan kualiti isyarat dan mengurangkan isyarat palsu
- Menggabungkan petunjuk momentum dan turun naik untuk perspektif pasaran yang komprehensif
- Mekanisme kawalan risiko yang ketat termasuk hentian trailing dan nisbah risiko-balasan tetap
- Sistem automatik sepenuhnya menghilangkan gangguan emosi
- Logik strategi yang jelas yang mudah difahami dan dikekalkan
Risiko Strategi
- Mungkin mengalami hentian yang kerap di pasaran trend
- Keadaan berganda mungkin kehilangan beberapa peluang perdagangan
- Parameter RSI tetap dan Bollinger Bands mungkin tidak sesuai dengan semua keadaan pasaran
- Trailing stop mungkin keluar kedudukan terlalu awal di pasaran yang tidak menentu
- Menghendaki pengurusan wang yang betul untuk menangani kerugian berturut-turut
Arahan pengoptimuman
- Melaksanakan mekanisme parameter penyesuaian untuk menyesuaikan tetapan penunjuk secara dinamik berdasarkan turun naik pasaran
- Tambah penapis trend untuk menghentikan perdagangan pembalikan semasa trend yang kuat
- Membangunkan sistem nisbah risiko-balasan dinamik yang menyesuaikan diri dengan keadaan pasaran
- Masukkan pengesahan jumlah untuk meningkatkan kebolehpercayaan isyarat
- Melaksanakan mekanisme stop loss yang lebih fleksibel seperti berhenti atau keluar berdasarkan masa
Ringkasan
Ini adalah strategi perdagangan pembalikan yang terstruktur dengan baik yang meningkatkan ketepatan melalui penunjuk teknikal berganda dan menggunakan pengurusan risiko yang ketat. Walaupun mudah dan intuitif, ia mengandungi semua elemen utama yang diperlukan untuk sistem perdagangan yang matang. Melalui arahan pengoptimuman yang dicadangkan, strategi ini mempunyai ruang untuk peningkatan lanjut. Untuk perdagangan langsung, pengujian balik dan pengoptimuman parameter yang menyeluruh disyorkan.
/*backtest
start: 2024-12-06 00:00:00
end: 2025-01-04 08:00:00
period: 3h
basePeriod: 3h
exchanges: [{"eid":"Futures_Binance","currency":"BTC_USDT"}]
*/

//@version=5
strategy("RSI + Bollinger Bands with 1:2 Risk/Reward", overlay=true)

// Define Inputs
length_rsi = input.int(14, title="RSI Period")
oversold_level = input.int(30, title="RSI Oversold Level")
overbought_level = input.int(70, title="RSI Overbought Level")
length_bb = input.int(20, title="Bollinger Bands Period")
src = close
risk_to_reward = input.float(2.0, title="Risk-to-Reward Ratio", minval=1.0, step=0.1)

// Calculate Indicators
rsi_value = ta.rsi(src, length_rsi)
basis = ta.sma(src, length_bb)
dev = ta.stdev(src, length_bb)
upper_band = basis + 2 * dev
lower_band = basis - 2 * dev

// Define Buy and Sell Conditions
rsi_buy_condition = rsi_value < oversold_level // RSI below 30 (buy signal)
bollinger_buy_condition = close <= lower_band // Price at or near lower Bollinger Band (buy signal)

rsi_sell_condition = rsi_value > overbought_level // RSI above 70 (sell signal)
bollinger_sell_condition = close >= upper_band // Price at or near upper Bollinger Band (sell signal)

// Combine Buy and Sell Conditions
buy_condition = rsi_buy_condition and bollinger_buy_condition
sell_condition = rsi_sell_condition and bollinger_sell_condition

// Plot Buy and Sell Signals with white text and green/red boxes
plotshape(series=buy_condition, location=location.belowbar, color=color.green, style=shape.labelup, title="Buy Signal", text="BUY", textcolor=color.white, size=size.small)
plotshape(series=sell_condition, location=location.abovebar, color=color.red, style=shape.labeldown, title="Sell Signal", text="SELL", textcolor=color.white, size=size.small)

// Calculate Swing Points (for Stop Loss)
swing_low = ta.lowest(low, 5)  // Last 5 bars' low
swing_high = ta.highest(high, 5) // Last 5 bars' high

// Calculate Risk (Distance from Entry to SL)
long_risk = close - swing_low
short_risk = swing_high - close

// Calculate Take Profit using 1:2 Risk-to-Reward Ratio
take_profit_long = close + 2 * long_risk
take_profit_short = close - 2 * short_risk

// Strategy Execution: Enter Buy/Sell Positions
if buy_condition
    strategy.entry("Buy", strategy.long)
    strategy.exit("Take Profit", "Buy", limit=take_profit_long, stop=swing_low)  // Set TP and SL for Buy

if sell_condition
    strategy.entry("Sell", strategy.short)
    strategy.exit("Take Profit", "Sell", limit=take_profit_short, stop=swing_high)  // Set TP and SL for Sell

// Plotting the Indicators for Visualization (Optional - comment out if not needed)
plot(rsi_value, color=color.blue, title="RSI", linewidth=2, display=display.none)
plot(upper_band, color=color.red, title="Upper BB", display=display.none)
plot(lower_band, color=color.green, title="Lower BB", display=display.none)
- Trend Kadar Menang Tinggi Bermakna Strategi Perdagangan Pembalikan
- Bollinger Bands RSI Strategi Perdagangan
- Bollinger Bands dan RSI Crossover Trading Strategy
- Bollinger Bands dan RSI Strategi Dagangan Gabungan
- RSI dan Bollinger Bands Strategi Dagangan Swing Synergistic
- Bollinger Bands dan RSI Strategy Dagangan Dinamis Gabungan
- Trend Penggabungan Indikator Multi-Teknikalan Berikutan Strategi Dagangan Kuantitatif
- Adaptive Bollinger Bands Strategi Pengurusan Posisi Dinamik
- Strategi RSI dan Bollinger Bands Breakout dengan ketepatan tinggi dengan nisbah risiko-balasan yang dioptimumkan
- RSI dan Bollinger Bands Cross-Regression Dual Strategy
- Strategi Perdagangan Piramida Dinamik Supertrend Berbilang Tempoh
- Strategi Kuantitatif Melalui SMA Trend Jangka Panjang
- Trend Penggabungan Indikator Multi-Teknikalan Berikutan Strategi Dagangan Kuantitatif
- Indikator Multi-Teknik Momentum-MA Trend Mengikut Strategi
- Sistem Dagangan Crossover Triple EMA dengan Pengurusan Stop Loss berasaskan Smart R2R
- Strategi Kuantitatif EMA Rentas Frekuensi Tinggi Dinamis yang Dikendalikan oleh Volatiliti
- Strategi Dagangan Kuantitatif Berbilang Jangka Masa Berdasarkan EMA-Smoothed RSI dan ATR Dynamic Stop-Loss/Take-Profit
- Analisis Strategi Fibonacci Bollinger Bands yang Sesuai
- Strategi Perdagangan corak candlestick pelbagai jangka masa
- Algoritma Perdagangan Trend Dinamik Supertrend Multi-Timeframe
- Strategi Dagangan Rintisan MACD Lanjutan dengan Pengurusan Risiko Beradaptasi
- Strategi Penangkapan Trend Kuantitatif Berdasarkan Analisis Panjang Wick Candlestick
- Strategi Perdagangan Penembusan VWAP Penyimpangan Standar Ganda Statistik
- Strategi Grid Panjang Berdasarkan Pengeluaran dan Matlamat Keuntungan
- Tren silang purata bergerak dinamik mengikut strategi dengan sistem pengurusan risiko ATR
- Multi-Indicator Optimized KDJ Trend Crossover Strategy Berdasarkan Sistem Dagangan Pola Stochastic Dinamis