Обзор
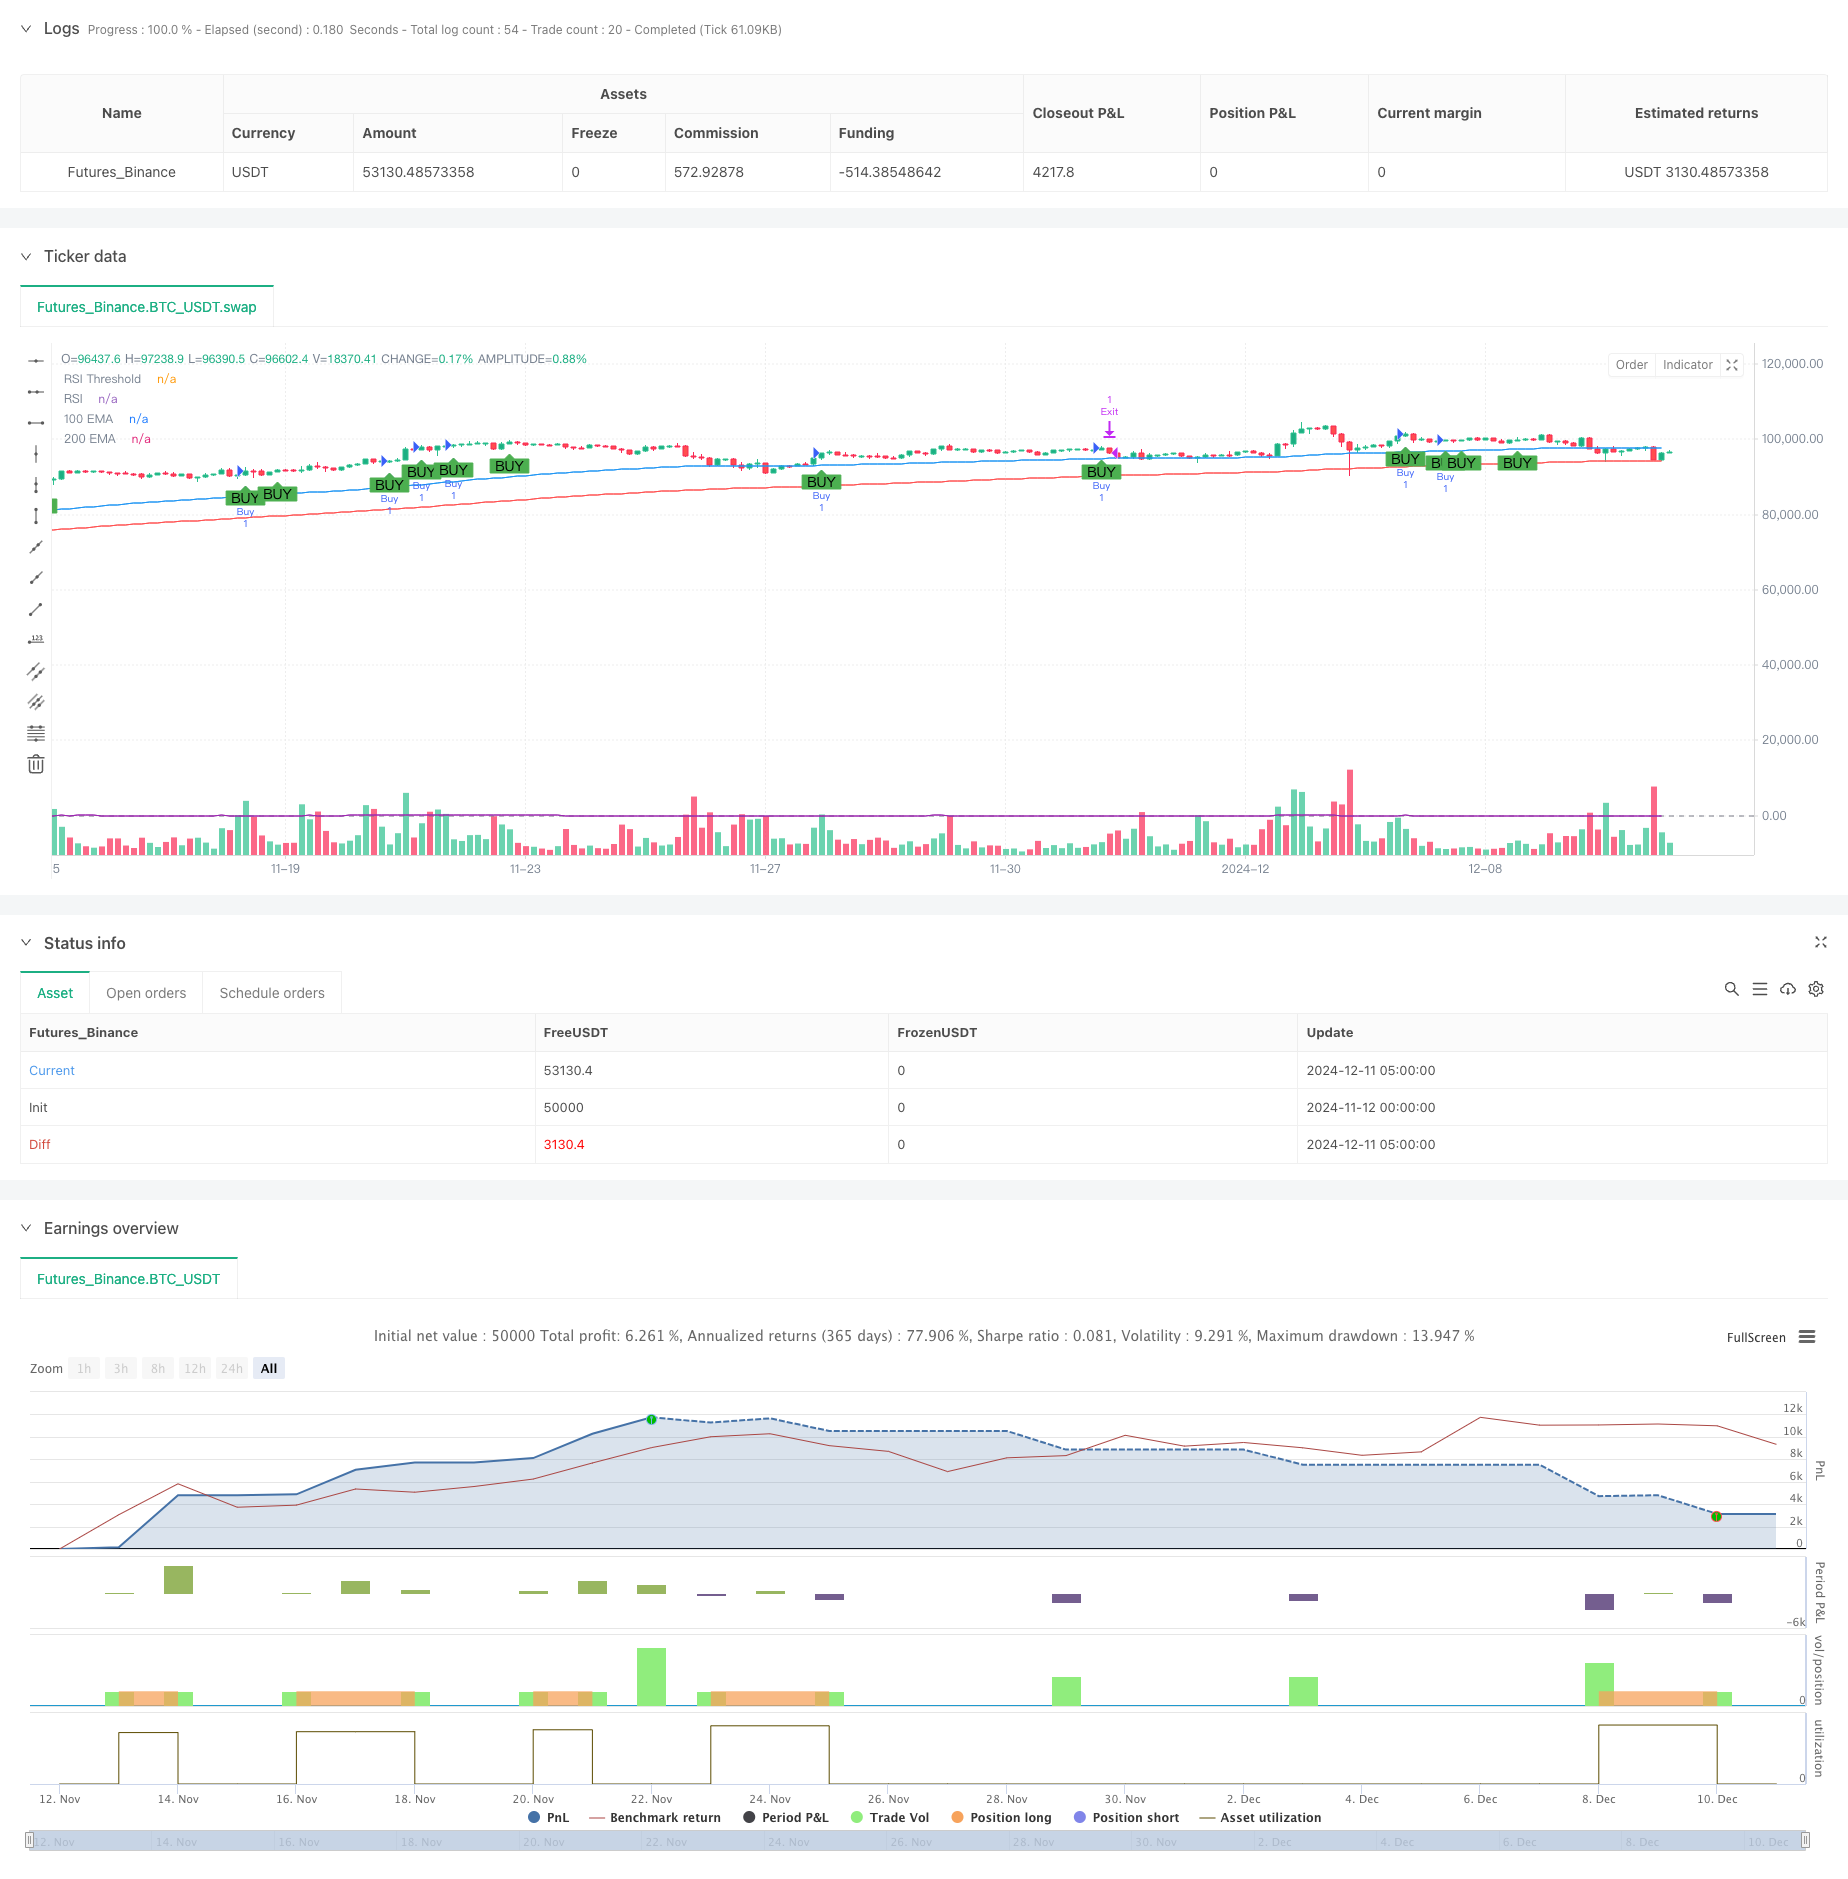
Стратегия является основанной на техническом анализе системой отслеживания тенденций, которая объединяет систему равнолинейных, динамический индикатор RSI и индикатор волатильности ATR, чтобы подтвердить торговые возможности с помощью многократной проверки сигналов. Стратегия использует многоциклическую равнолинейную перекрестную оценку рыночных тенденций, в то же время в сочетании с динамикой RSI подтверждает ценовую силу и, в конце концов, использует динамическую установку ATR для установки стоп-поста и выигрыша, чтобы сформировать полную торговую систему.
Стратегический принцип
Основная логика стратегии состоит из трех ключевых частей:
- Определение тренда: используйте пересечение 100-циклических и 200-циклических показателей скользящих средних (EMA) для подтверждения направления тенденции рынка. Когда краткосрочная EMA находится выше долгосрочной EMA, это указывает на то, что рынок находится в восходящей тенденции.
- Входные сигналы: на основе подтверждения тренда, стратегия ищет в качестве конкретной точки входа формы поглощения банана и фильтрует сигналы с помощью индикатора RSI. Когда значение RSI больше 50, это означает, что рынок имеет достаточную восходящую динамику.
- Управление позициями: используйте 14-циклический ATR для измерения волатильности рынка и динамически настраивайте уровни стоп-лосса и прибыли в соответствии с этим. Стоп-лосса устанавливается в 1,1 раза ATR, а прибыль - в 2,0 раза ATR. Эта настройка гарантирует, что убыток превышает 1 ‰.
Стратегические преимущества
- Многосигнальная проверка: значительно снижает влияние ложных сигналов, используя комбинацию трендов, ценовых форм и динамических индикаторов.
- Динамический риск-менеджмент: на основе ATR установка стоп- и прибыли может быть адаптирована к волатильности рынка, избегая ограничений, вызванных фиксированными точками.
- Тренд-следящая функция: с помощью системы равнолинейной оценки трендов эффективно избегается ненужная торговля в поперечном или нисходящем рынке.
- Полная торговая структура: включает в себя полную стратегическую систему входа, выхода и управления позициями.
Стратегический риск
- Задержка тренда: EMA как отстающий индикатор может привести к задержке входа и может пропустить лучшую точку входа в быстро меняющемся рынке.
- Оценка рыночных рисков: Частые пересечения средних линий могут привести к чрезмерной торговле на рыночных рынках.
- Риск ложного прорыва: возможны ложные прорывы, которые необходимо контролировать с помощью строгих рисков.
- Риск настройки стоп-убытков: слишком маленький ATR может привести к слишком частым стоп-убыткам, а слишком большой ATR может подвергнуть себя слишком большому риску.
Направление оптимизации стратегии
- Введение показателя трафика: можно повысить надежность сигнала, добавив подтверждение трафика.
- Оптимизация среднелинейных циклов: среднелинейные циклы могут быть скорректированы в соответствии с различными рыночными характеристиками, чтобы лучше адаптироваться к рыночному ритму.
- Совершенствование механизма остановки убытков: можно рассмотреть возможность добавления подвижного остановки, защищая при сохранении тренда.
- Увеличение фильтрации рыночных условий: введение диапазона оценки волатильности, снижение частоты торговли в чрезмерно волатильной рыночной среде.
- Оптимизация параметров RSI: можно отслеживать исторические данные, чтобы найти оптимальные пороговые значения RSI и циклы расчета.
Подвести итог
Стратегия создает логически целостную систему отслеживания тенденций путем интеграции нескольких технических показателей. Преимущества стратегии заключаются в проверке нескольких сигналов и динамическом управлении рисками, но в то же время необходимо обращать внимание на такие риски, как задержка тенденции и ложные прорывы.
/*backtest
start: 2024-11-12 00:00:00
end: 2024-12-11 08:00:00
period: 3h
basePeriod: 3h
exchanges: [{"eid":"Futures_Binance","currency":"BTC_USDT"}]
*/

//@version=5
strategy("Bullish Engulfing with EMA Crossover and ATR-Based SL/TP with RSI Filter", overlay=true)

// Inputs for moving averages
short_ema_length = input.int(100, title="Short EMA Length")
long_ema_length = input.int(200, title="Long EMA Length")

// RSI Input
rsi_length = input.int(14, title="RSI Length")
rsi_threshold = input.float(50, title="RSI Threshold")

// Calculate the Exponential Moving Averages (EMAs)
short_ema = ta.ema(close, short_ema_length)
long_ema = ta.ema(close, long_ema_length)

// Plot EMAs on the chart
plot(short_ema, color=color.blue, title="100 EMA")
plot(long_ema, color=color.red, title="200 EMA")

// Calculate RSI
rsi_value = ta.rsi(close, rsi_length)

// Plot RSI on a separate panel
hline(rsi_threshold, "RSI Threshold", color=color.gray)
plot(rsi_value, color=color.purple, title="RSI")

// Bullish Engulfing Pattern
bullish_engulfing = close > open[1] and open < close[1] and close > open

// Define strategy entry condition with RSI filter
long_condition = bullish_engulfing and short_ema > long_ema and rsi_value > rsi_threshold

// Plot a buy signal when conditions are met
plotshape(long_condition, style=shape.labelup, location=location.belowbar, color=color.green, title="Buy Signal", text="BUY")

// ATR Calculation
atr_length = input.int(14, title="ATR Length")
atr_value = ta.atr(atr_length)

// Define Stop Loss and Take Profit as levels
stop_loss_level = 1.1 * atr_value
take_profit_level = 2.0 * atr_value

// Execute Strategy Entry
if (long_condition)
    strategy.entry("Buy", strategy.long)

// Adjust SL and TP levels using the entry price
if (strategy.position_size > 0)
    // Calculate SL and TP relative to the entry price
    stop_price = strategy.position_avg_price - stop_loss_level
    limit_price = strategy.position_avg_price + take_profit_level

    // Exit strategy with SL and TP
    strategy.exit("Exit", from_entry="Buy", stop=stop_price, limit=limit_price)