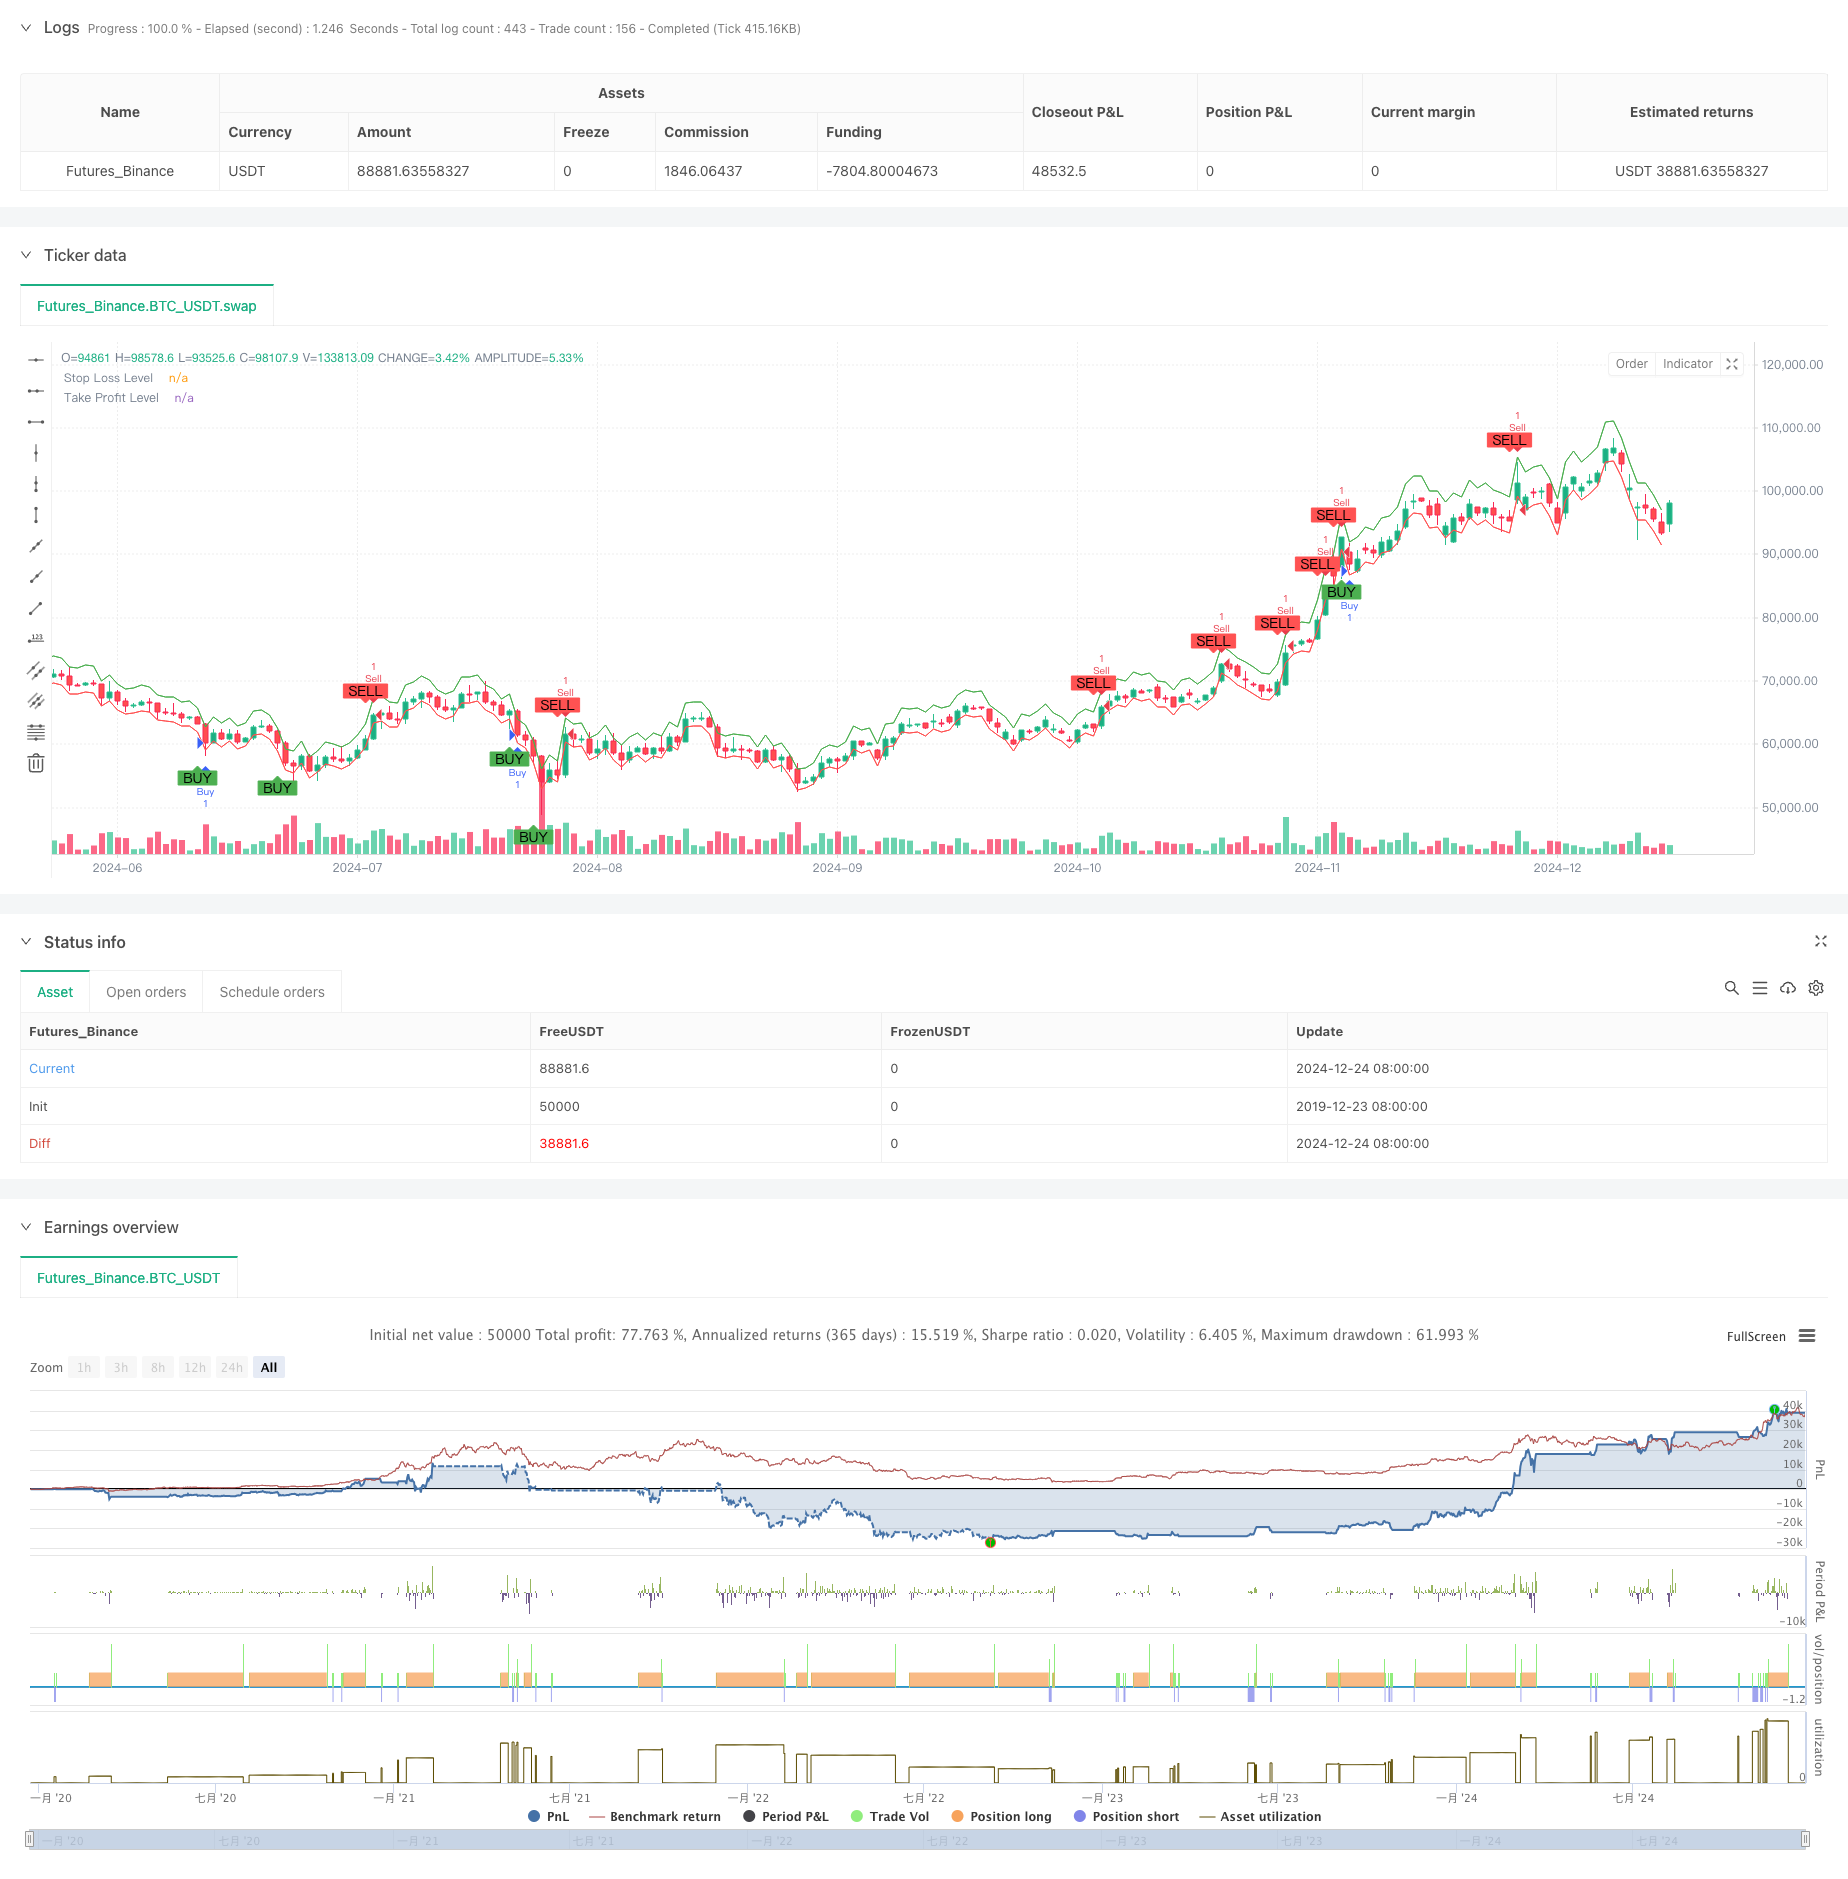
Обзор
Стратегия представляет собой адаптивную торговую систему, основанную на индексе Shiryaev-Zhou (SZI). Она идентифицирует состояния перекупа и перепродажи на рынке, рассчитывая стандартизированные баллы по амортизированной доходности, таким образом, захватывая возможности для среднезначного возврата цены. Стратегия сочетает в себе динамические цели по остановке и прибыли, обеспечивая точный контроль риска.
Стратегический принцип
В основе стратегии лежит построение стандартизированных показателей с помощью скручивающейся статистической характеристики арифметической доходности. Конкретные шаги:
- Расчет параллельной доходности для нормализации доходности
- Расчет скользящих средних и стандартных отклонений с использованием 50-циклического окна
- Конструирование показателя SZI: (параллельная доходность - скользящая средняя) / скользящая стандартная разница
- При SZI ниже -2,0 образуется многосигнал, при SZI выше -2,0 образуется вакуум
- Установка 2% стоп-лосса и 4% стоп-стоп на основе цены входа
Стратегические преимущества
- Твердая теоретическая основа: основана на гипотезе адекватного распределения, имеет хорошую статистическую поддержку
- Умение адаптироваться к изменениям волатильности рынка с помощью подсчетов с помощью прокрутки
- Высокий уровень контроля риска: использование стратегии стоп-лосса для точного контроля риска на каждой сделке
- Визуализация дружественная: четко обозначенные на графике торговые сигналы и уровень контроля риска
Стратегический риск
- Чувствительность параметров: выбор длины прокрутки и значений отметки существенно влияет на эффективность стратегии
- Зависимость от рыночной конъюнктуры: частое возникновение ложных сигналов в трендовых рынках
- Влияние скольжения: в периоды сильных колебаний реальные цены могут значительно отклоняться от идеального уровня
- Задержка вычислений: вычисление статистических показателей в реальном времени может привести к определенной задержке сигнала
Направление оптимизации стратегии
- Динамический порог: можно рассматривать возможность динамической корректировки сигнального порога в зависимости от рыночных колебаний
- Многочасовой цикл: механизм подтверждения сигнала, который включает в себя несколько временных циклов
- Фильтрация на волатильность: приостановка торговли или корректировка позиции во время крайней волатильности
- Подтверждение сигнала: для подтверждения дополнительных показателей, таких как увеличение объема перевозок, мощности и т. д.
- Управление позициями: реализация динамического управления позициями на основе волатильности
Подвести итог
Это количественная торговая стратегия, основанная на прочной статистике, которая захватывает возможности колебаний цены с помощью стандартизированной логической прибыли. Основные преимущества стратегии заключаются в ее адаптивности и хорошем контроле риска, но все еще есть место для оптимизации в отношении выбора параметров и адаптации к рыночной среде.
/*backtest
start: 2019-12-23 08:00:00
end: 2024-12-25 08:00:00
period: 1d
basePeriod: 1d
exchanges: [{"eid":"Futures_Binance","currency":"BTC_USDT"}]
*/

//@version=5
strategy("Jalambi Paul model", overlay=true)

// Define the length for the rolling window
window = input.int(50, title="Window Length", minval=1)
threshold = 2.0 // Fixed threshold value
risk_percentage = input.float(1.0, title="Risk Percentage per Trade", step=0.1) / 100

// Calculate the logarithmic returns
log_return = math.log(close / close[1])

// Calculate the rolling mean and standard deviation
rolling_mean = ta.sma(log_return, window)
rolling_std = ta.stdev(log_return, window)

// Calculate the Shiryaev-Zhou Index (SZI)
SZI = (log_return - rolling_mean) / rolling_std

// Generate signals based on the fixed threshold
long_signal = SZI < -threshold
short_signal = SZI > threshold

// Plot the signals on the main chart (overlay on price)
plotshape(series=long_signal, location=location.belowbar, color=color.green, style=shape.labelup, title="Buy Signal", text="BUY", offset=-1)
plotshape(series=short_signal, location=location.abovebar, color=color.red, style=shape.labeldown, title="Sell Signal", text="SELL", offset=-1)

// Strategy logic: Buy when SZI crosses below the negative threshold, Sell when it crosses above the positive threshold
if (long_signal)
    strategy.entry("Buy", strategy.long, comment="Long Entry")

if (short_signal)
    strategy.entry("Sell", strategy.short, comment="Short Entry")

// Calculate the stop loss and take profit levels based on the percentage of risk
stop_loss_pct = input.float(2.0, title="Stop Loss (%)") / 100
take_profit_pct = input.float(4.0, title="Take Profit (%)") / 100

// Set the stop loss and take profit levels based on the entry price
strategy.exit("Take Profit / Stop Loss", "Buy", stop=close * (1 - stop_loss_pct), limit=close * (1 + take_profit_pct))
strategy.exit("Take Profit / Stop Loss", "Sell", stop=close * (1 + stop_loss_pct), limit=close * (1 - take_profit_pct))

// Plot the stop loss and take profit levels for visualization (optional)
plot(stop_loss_pct != 0 ? close * (1 - stop_loss_pct) : na, color=color.red, linewidth=1, title="Stop Loss Level")
plot(take_profit_pct != 0 ? close * (1 + take_profit_pct) : na, color=color.green, linewidth=1, title="Take Profit Level")