Стратегия торговли с двумя техническими индикаторами и системой управления рисками
Автор:Чао Чжан, Дата: 2025-01-06 16:45:01Тэги:РСИББRRSMA

Обзор
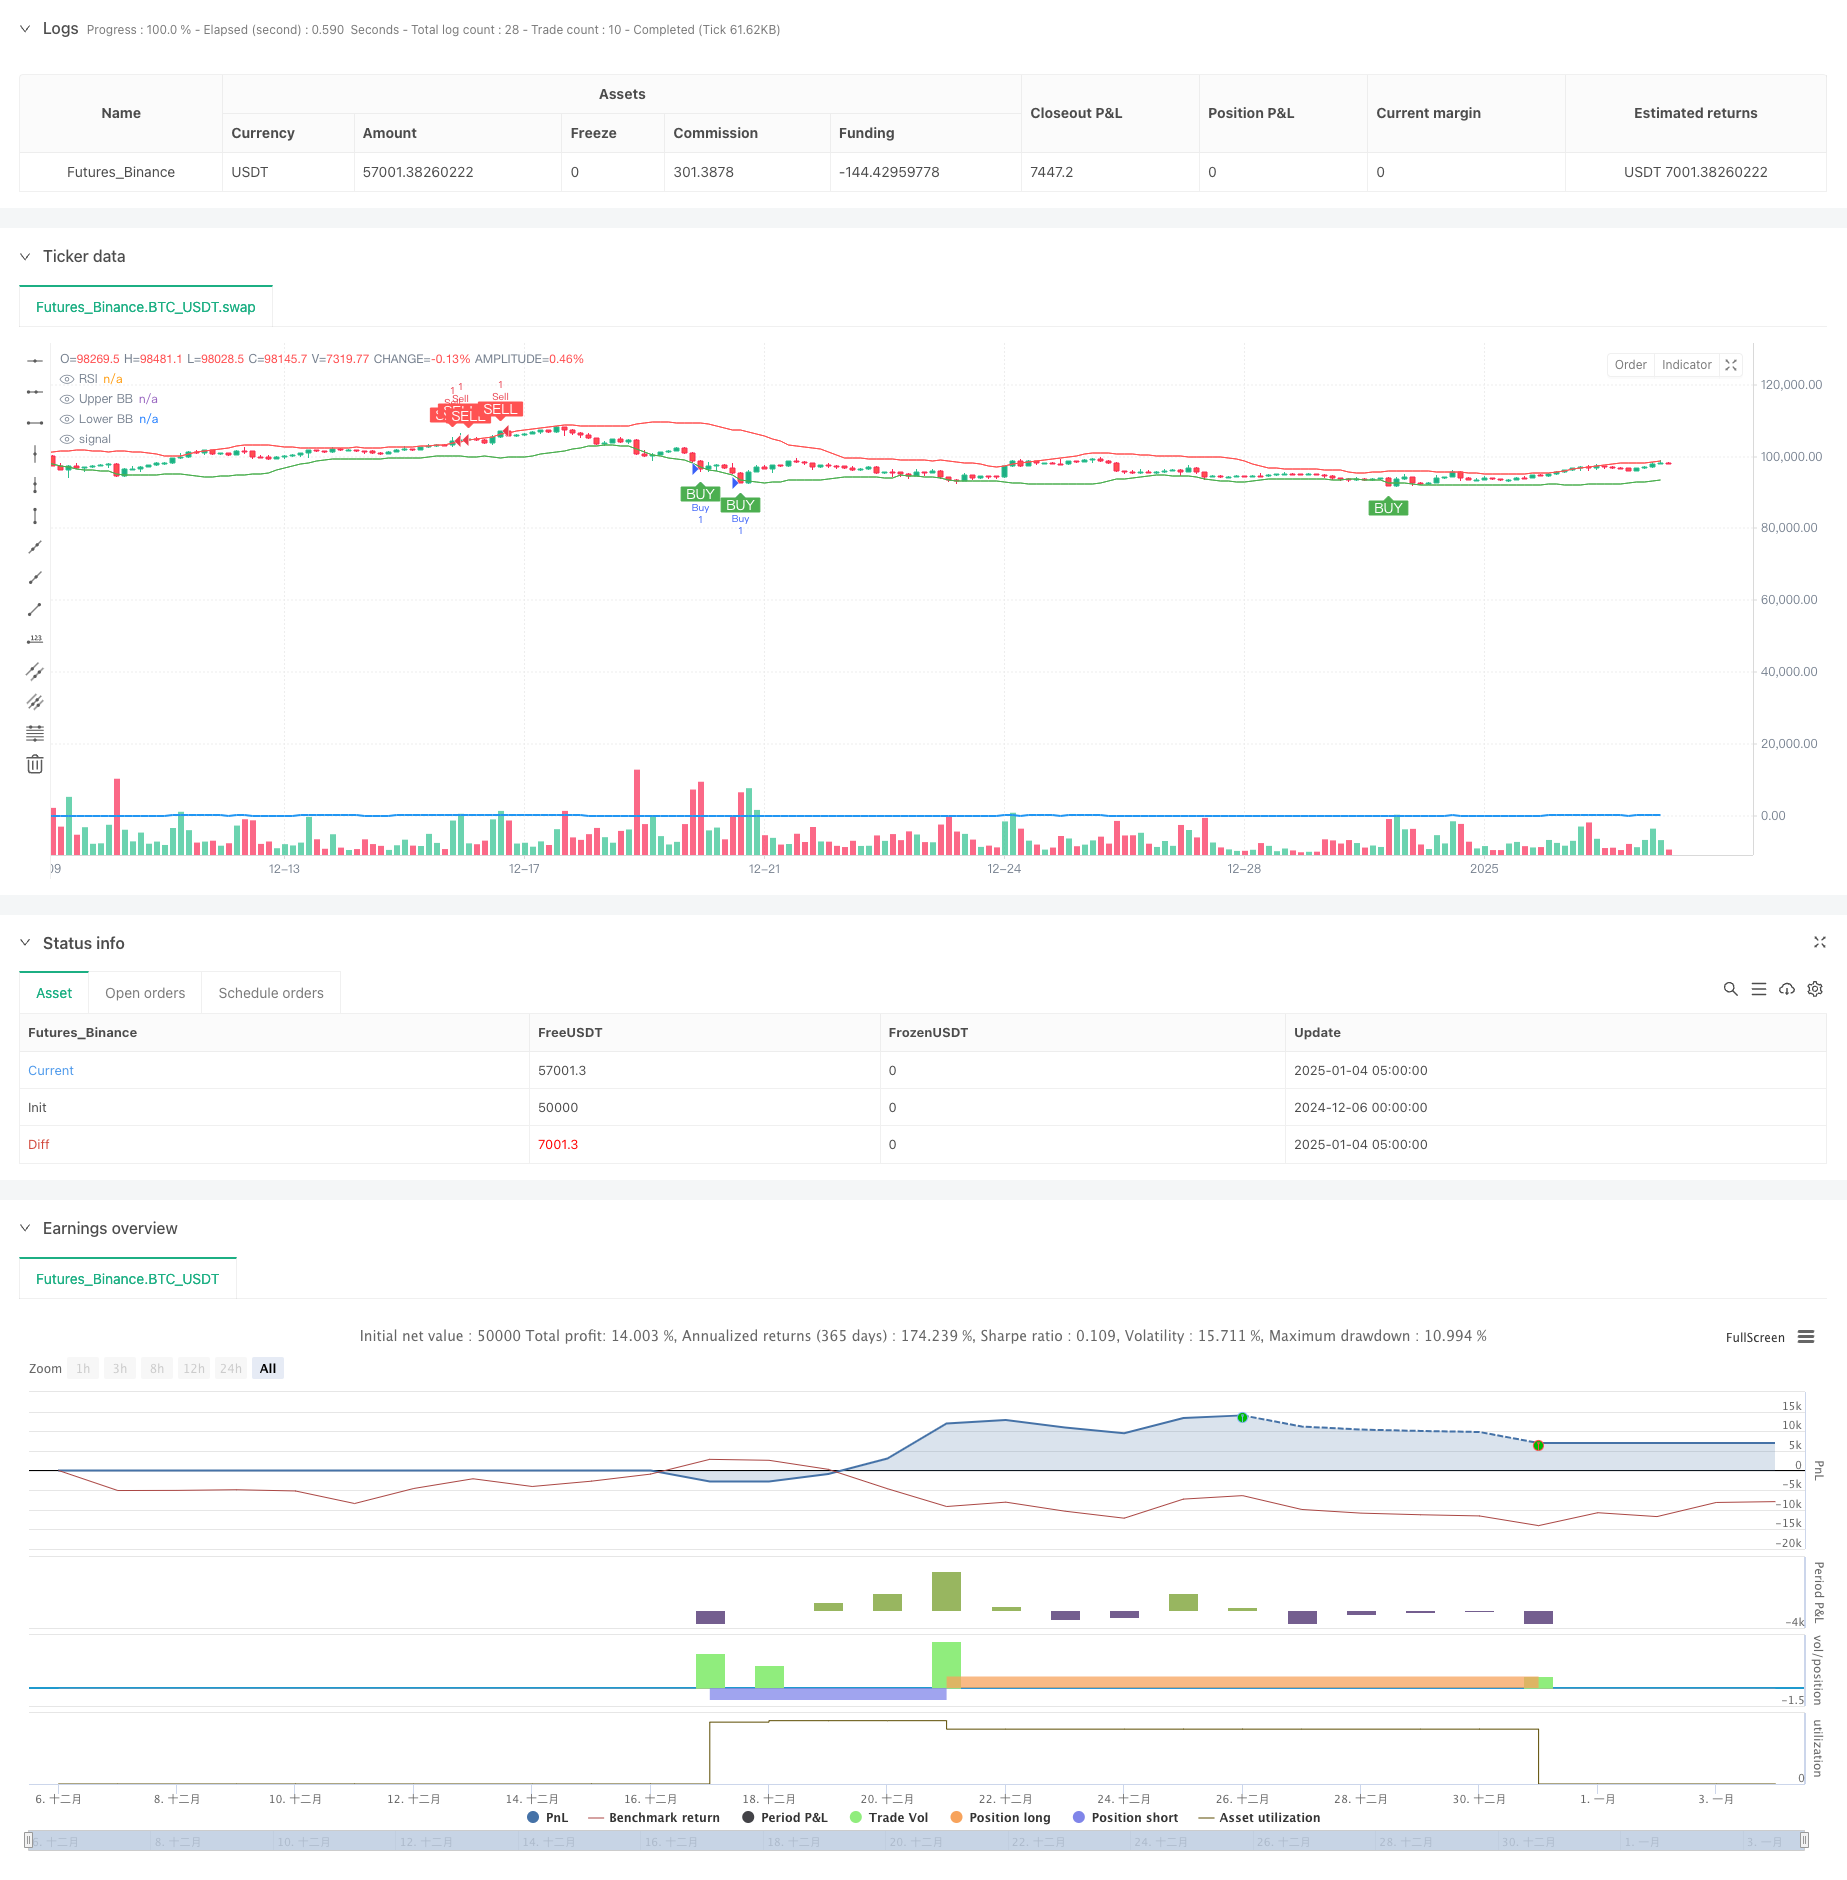
Эта стратегия представляет собой импульсную обратную торговую систему, объединяющую индикаторы RSI и Bollinger Bands, предназначенную для выявления перекупленных и перепроданных зон. Она реализует соотношение риск-вознаграждение 1:2 с последующим стоп-лосом для управления рисками. Основная логика заключается в выполнении сделок, когда как RSI, так и Bollinger Bands показывают сигналы перепродажи или перекупки одновременно, защищая капитал посредством строгого управления рисками.
Принципы стратегии
Стратегия использует 14-периодный RSI и 20-периодные полосы Боллинджера в качестве основных индикаторов. Условия покупки требуют как: RSI ниже 30 (перепроданность), так и цены на или ниже нижней полосы Боллинджера. Условия продажи требуют как: RSI выше 70 (перекупленность), так и цены на или выше верхней полосы Боллинджера. Система использует 5-барные высокие / низкие точки для остановок, с прибылью, установленной в два раза больше расстояния остановки потери, строго сохраняя соотношение риск-вознаграждение 1:2.
Преимущества стратегии
- Двойная индикаторная фильтрация улучшает качество сигнала и уменьшает ложные сигналы
- Сочетает в себе индикаторы динамики и волатильности для всеобъемлющей рыночной перспективы
- Строгие механизмы контроля риска, включая ограничения на остановку и фиксированное соотношение риск-прибыль
- Полностью автоматизированная система, устраняющая эмоциональные помехи.
- Ясная логика стратегии, которую легко понять и поддерживать
Стратегические риски
- Может возникать частые остановки на трендовых рынках
- Двойные условия могут лишить некоторых торговых возможностей
- Фиксированные параметры RSI и Bollinger Bands могут не соответствовать всем рыночным условиям
- Продолжающие остановки могут выйти из позиций слишком рано на волатильных рынках
- Требует надлежащего управления деньгами, чтобы справиться с последовательными потерями
Руководство по оптимизации
- Внедрение механизма адаптивных параметров для динамической корректировки настроек показателей на основе волатильности рынка
- Добавление фильтра тренда для приостановки торговли реверсией во время сильных трендов
- Разработка динамической системы соотношения риск-прибыль, адаптирующейся к рыночным условиям
- Включить подтверждение объема для повышения надежности сигнала
- Внедрять более гибкие механизмы остановки потери, такие как остановки отслеживания или выходы на основе времени
Резюме
Это хорошо структурированная стратегия обратной торговли, которая повышает точность с помощью двойных технических индикаторов и использует строгое управление рисками. Хотя она проста и интуитивна, она содержит все ключевые элементы, необходимые для зрелой торговой системы.
/*backtest
start: 2024-12-06 00:00:00
end: 2025-01-04 08:00:00
period: 3h
basePeriod: 3h
exchanges: [{"eid":"Futures_Binance","currency":"BTC_USDT"}]
*/

//@version=5
strategy("RSI + Bollinger Bands with 1:2 Risk/Reward", overlay=true)

// Define Inputs
length_rsi = input.int(14, title="RSI Period")
oversold_level = input.int(30, title="RSI Oversold Level")
overbought_level = input.int(70, title="RSI Overbought Level")
length_bb = input.int(20, title="Bollinger Bands Period")
src = close
risk_to_reward = input.float(2.0, title="Risk-to-Reward Ratio", minval=1.0, step=0.1)

// Calculate Indicators
rsi_value = ta.rsi(src, length_rsi)
basis = ta.sma(src, length_bb)
dev = ta.stdev(src, length_bb)
upper_band = basis + 2 * dev
lower_band = basis - 2 * dev

// Define Buy and Sell Conditions
rsi_buy_condition = rsi_value < oversold_level // RSI below 30 (buy signal)
bollinger_buy_condition = close <= lower_band // Price at or near lower Bollinger Band (buy signal)

rsi_sell_condition = rsi_value > overbought_level // RSI above 70 (sell signal)
bollinger_sell_condition = close >= upper_band // Price at or near upper Bollinger Band (sell signal)

// Combine Buy and Sell Conditions
buy_condition = rsi_buy_condition and bollinger_buy_condition
sell_condition = rsi_sell_condition and bollinger_sell_condition

// Plot Buy and Sell Signals with white text and green/red boxes
plotshape(series=buy_condition, location=location.belowbar, color=color.green, style=shape.labelup, title="Buy Signal", text="BUY", textcolor=color.white, size=size.small)
plotshape(series=sell_condition, location=location.abovebar, color=color.red, style=shape.labeldown, title="Sell Signal", text="SELL", textcolor=color.white, size=size.small)

// Calculate Swing Points (for Stop Loss)
swing_low = ta.lowest(low, 5)  // Last 5 bars' low
swing_high = ta.highest(high, 5) // Last 5 bars' high

// Calculate Risk (Distance from Entry to SL)
long_risk = close - swing_low
short_risk = swing_high - close

// Calculate Take Profit using 1:2 Risk-to-Reward Ratio
take_profit_long = close + 2 * long_risk
take_profit_short = close - 2 * short_risk

// Strategy Execution: Enter Buy/Sell Positions
if buy_condition
    strategy.entry("Buy", strategy.long)
    strategy.exit("Take Profit", "Buy", limit=take_profit_long, stop=swing_low)  // Set TP and SL for Buy

if sell_condition
    strategy.entry("Sell", strategy.short)
    strategy.exit("Take Profit", "Sell", limit=take_profit_short, stop=swing_high)  // Set TP and SL for Sell

// Plotting the Indicators for Visualization (Optional - comment out if not needed)
plot(rsi_value, color=color.blue, title="RSI", linewidth=2, display=display.none)
plot(upper_band, color=color.red, title="Upper BB", display=display.none)
plot(lower_band, color=color.green, title="Lower BB", display=display.none)
- Тенденция высокого уровня выигрыша означает обратную торговую стратегию
- Торговая стратегия Bollinger Bands RSI
- RSI и Bollinger Bands Синергетическая стратегия swing trading
- Показатели Bollinger Bands и стратегия кроссоверной торговли RSI
- Комбинированная стратегия торговли полосами Боллинджера и индексом RSI
- Комбинированная динамическая стратегия торговли полосами Боллинджера и индексом RSI
- Тенденция слияния мультитехнических индикаторов вследствие количественной стратегии торговли
- Динамическая стратегия управления позициями с адаптивными полосами Боллинджера
- Двойная стратегия перекрестной регрессии RSI и Bollinger Bands
- Высокоточная стратегия прорыва RSI и Bollinger Bands с оптимизированным коэффициентом риск-вознаграждение
- Динамическая стратегия многопериодного супертенденционного трейдинга с пирамидами
- Долгосрочная тенденционная квантитативная стратегия перекрестного SMA
- Тенденция слияния мультитехнических индикаторов вследствие количественной стратегии торговли
- Мультитехнический индикатор импульс-МА
- Трехмерная система перекрестного трейдинга EMA с управлением стоп-лоссами на основе умного R2R
- Динамическая волатильностная высокочастотная кроссоверная количественная стратегия EMA
- Многовременная количественная стратегия торговли, основанная на сглаженном EMA RSI и ATR Dynamic Stop-Loss/Take-Profit
- Анализ стратегии адаптивных полос Фибоначчи и Боллинджера
- Стратегия торговли многочасовыми моделями свечей
- Алгоритм многочасовой супертенденции динамического тренда
- Продвинутая стратегия перекрестной торговли MACD с адаптивным управлением рисками
- Стратегия по определению количественного тренда на основе анализа длины свеча
- Статистическое двойное отклонение от нормы VWAP
- Стратегия длинной сети, основанная на привлечении и целевой прибыли
- Динамическая скользящая средняя перекрестная тенденция в соответствии со стратегией с системой управления рисками ATR
- Многоиндикаторная оптимизированная стратегия перекрестка трендов KDJ, основанная на динамической системе торговли стохастическими моделями