概述
本策略是一个基于Tillson T3指标的趋势跟踪交易系统。它利用多重指数移动平均线(EMA)的交叉来生成买卖信号,并在TradingView平台上进行回测。该策略的核心思想是通过Tillson T3指标捕捉市场趋势,在上升趋势中开多仓,下降趋势中开空仓,以实现盈利。
策略原理
Tillson T3指标计算:
- 首先计算(高+低+2*收盘)/4的EMA
- 然后连续计算5次EMA,得到e1到e6
- 最后根据特定系数计算T3值
信号生成:
- 多头信号:当T3值上穿其前一个值时
- 空头信号:当T3值下穿其前一个值时
交易执行:
- 出现多头信号时,开多仓
- 出现空头信号时,开空仓
可视化:
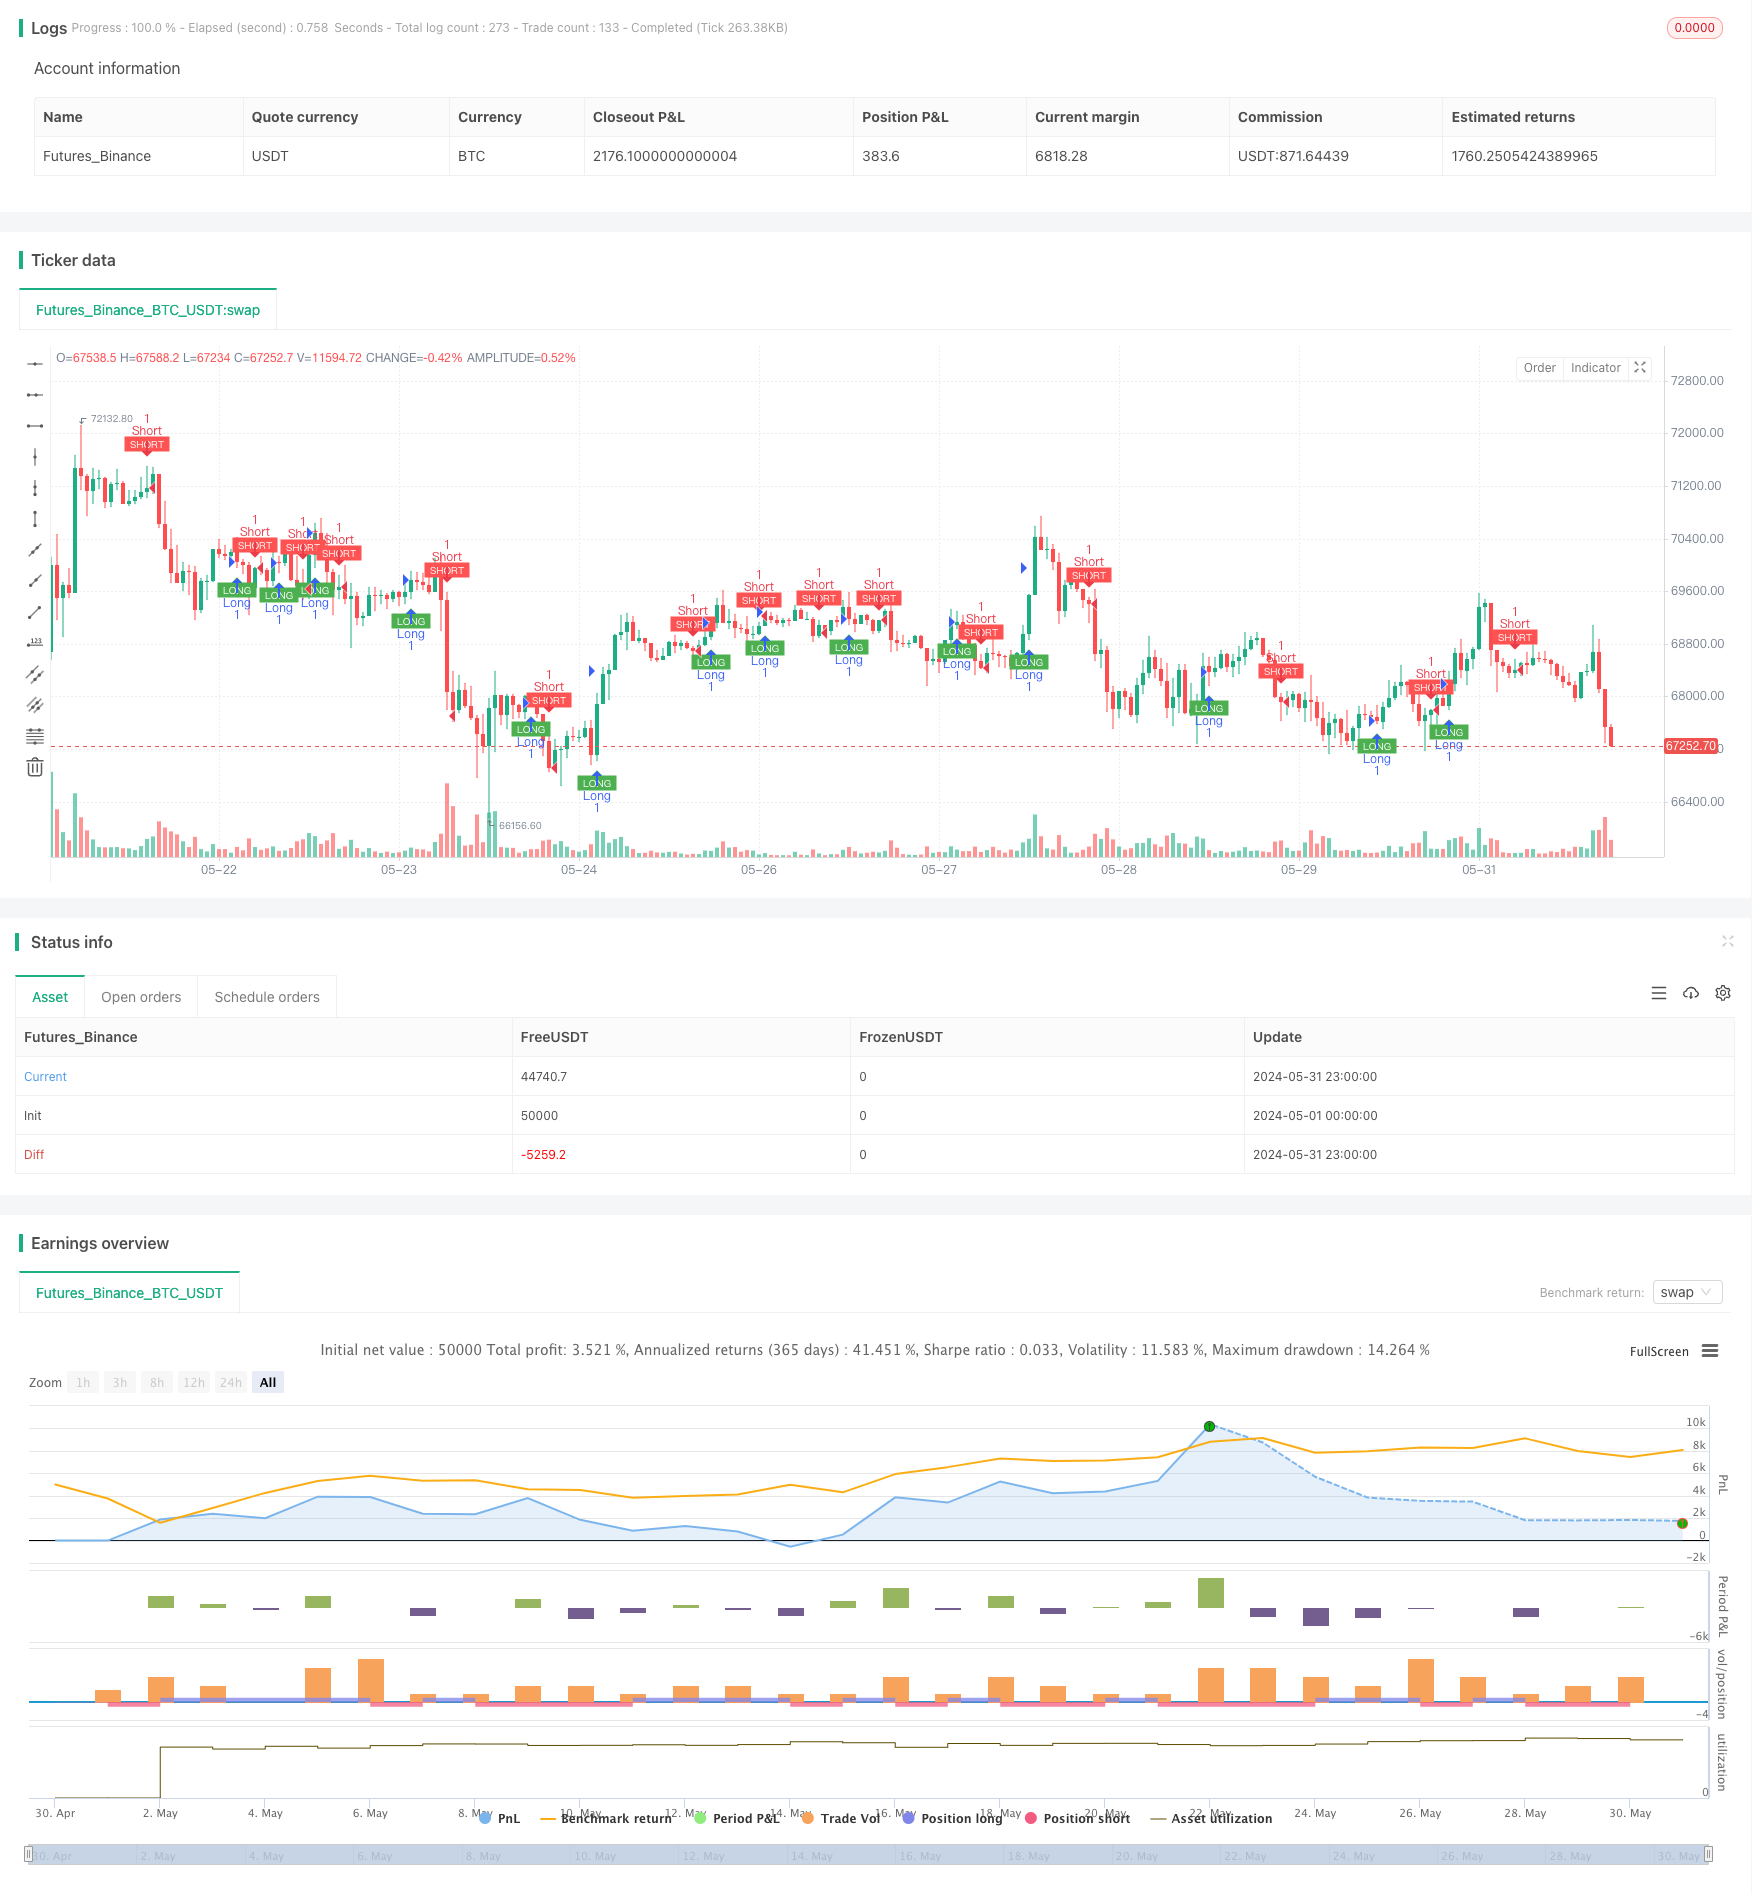
- 多头信号:图表下方绿色向上箭头
- 空头信号:图表上方红色向下箭头
策略优势
趋势跟踪:Tillson T3指标能有效捕捉市场趋势,减少假突破。
灵活性:通过调整长度和成交量因子,可适应不同市场环境。
视觉反馈:清晰的图形信号有助于交易决策。
自动化:可在TradingView平台上实现自动交易。
风险管理:使用资金百分比进行头寸管理。
策略风险
趋势反转:在震荡市场可能产生频繁假信号。
滞后性:作为滞后指标,可能错过趋势初期机会。
过度交易:频繁信号可能导致过度交易,增加成本。
参数敏感:性能高度依赖于参数设置。
单一指标:仅依赖Tillson T3可能忽视其他重要市场信息。
策略优化方向
多指标结合:引入RSI、MACD等指标进行信号确认。
止损优化:加入动态止损,如跟踪止损,提高风险管理能力。
时间框架分析:结合多个时间框架分析,提高信号可靠性。
波动率调整:根据市场波动调整仓位大小,优化风险收益比。
市场状态识别:加入市场状态判断逻辑,在不同市场环境下采用不同策略。
总结
多重均线交叉趋势跟踪策略是一个基于Tillson T3指标的自动化交易系统。它通过捕捉市场趋势来生成交易信号,具有趋势跟踪能力强、操作简单明确的优势。然而,该策略也面临着震荡市场假信号频繁、信号滞后等风险。通过多指标结合、优化止损策略、引入多时间框架分析等方式,可以进一步提升策略的稳定性和盈利能力。总的来说,这是一个具有良好基础的策略框架,通过持续优化和实盘测试,有望成为一个可靠的自动化交易系统。
策略源码
/*backtest
start: 2024-05-01 00:00:00
end: 2024-05-31 23:59:59
period: 1h
basePeriod: 15m
exchanges: [{"eid":"Futures_Binance","currency":"BTC_USDT"}]
*/

//@version=4
strategy("Hashtag Signals and Backtest", overlay=true)

// Input parameters for indicators
length1 = input(8, "T3 Length")
a1 = input(0.7, "Volume Factor")

// Tillson T3 Calculation
e1 = ema((high + low + 2 * close) / 4, length1)
e2 = ema(e1, length1)
e3 = ema(e2, length1)
e4 = ema(e3, length1)
e5 = ema(e4, length1)
e6 = ema(e5, length1)
c1 = -a1 * a1 * a1
c2 = 3 * a1 * a1 + 3 * a1 * a1 * a1
c3 = -6 * a1 * a1 - 3 * a1 - 3 * a1 * a1 * a1
c4 = 1 + 3 * a1 + a1 * a1 * a1 + 3 * a1 * a1
T3 = c1 * e6 + c2 * e5 + c3 * e4 + c4 * e3

// Signal conditions
longSignal = crossover(T3, T3[1])
shortSignal = crossunder(T3, T3[1])

// Plotting signals
plotshape(series=longSignal, title="Long Signal", location=location.belowbar, color=color.green, style=shape.labelup, text="LONG", textcolor=color.white, size=size.tiny)
plotshape(series=shortSignal, title="Short Signal", location=location.abovebar, color=color.red, style=shape.labeldown, text="SHORT", textcolor=color.white, size=size.tiny)

// Strategy Entries for Backtest
if (longSignal)
    strategy.entry("Long", strategy.long)

if (shortSignal)
    strategy.entry("Short", strategy.short)

// Alerts
alertcondition(longSignal, title="BUY", message="BUY!")
alertcondition(shortSignal, title="SELL", message="SELL!")
相关推荐